 05.01.PayloadOpPlan.01.v1
National Aeronautics and
Space Administration
Lunar Crater Observation and Sensing Satellite
(LCROSS)
Measurement and Operations Plan
April 02, 2010
APPROVAL
Submitted By:
_______________________________________
Mark Shirley Date
LCROSS Payload Software Lead
_______________________________________
Kimberly Smith Date
LCROSS Payload Scientist
Approved By:
_______________________________________
Anthony Colaprete Date
LCROSS Principle Investigator
1 Scope
This document describes the measurement and operation specifications for the Lunar Crater Observation and Sensing Satellite (LCROSS). The measurement specifications and operations are derived form the science and measurement goals as defined in the mission science plan (ARC-04.01.SciMP.01.v-DRAFTD) and Project Level 4 Science/Payload requirements.
The first nine sections describe the measurement and operations plan as it was before launch. Sections 10 and 11 briefly describe the command sequences as they were executed during the flight.
2 Table of Contents
3 Mission and Measurement Overview
7.1 Star Field Sequence Guidelines
7.2 Swing-By / Calibration Sequence Guidelines
7.3 Moon/Earth Look Sequence Guidelines
7.4 Centaur Separation Sequence Guidelines
7.5 Preimpact and the final hour of operations
7.6 Impact/Flash Sequence Guidelines
7.7 Impact/Curtain Sequence Guidelines
7.8 Impact/Crater Sequence GuidelineS
3 Mission and Measurement Overview
The primary objective of the Lunar Crater Observation and Sensing Satellite (LCROSS) is to confirm the presence of water ice at the Moon’s South Pole. This mission uses a 2000 kg kinetic impactor with more than 200 times the energy of the Lunar Prospector (LP) impact to excavate more than 250 metric tons of lunar regolith. The resulting ejecta cloud will be observed from a number of Lunar-orbital and Earth-based assets. The impact is achieved by steering the launch vehicle’s spent Earth Departure Upper Stage (EDUS) into a permanently shadowed polar region (Figure 1). The EDUS is guided to its target by a Shepherding Spacecraft (S-S/C), which after release of the EDUS, flies toward the impact plume, sending real-time data and characterizing the morphology, evolution and composition of the plume with a suite of instruments. The S-S/C then becomes a 700kg impactor itself, to provide a second opportunity to study the nature of the Lunar Regolith. LCROSS provides a critical ground-truth for Lunar Prospector and LRO neutron and radar maps, making it possible to assess the total lunar water inventory, as well as provide significant insight into the processes that delivered the hydrogen to the lunar poles in the first place.
Multiple measurement techniques will be utilized by the LCROSS S-S/C and include some measurement goal overlap. By addressing each measurement goal with overlapping techniques a level of robustness against misinterpretation can be achieved and the mission susceptibility to false positive / negative results minimized. Ground or orbital based measurements other than those performed from the S-S/C are not described here, however, the LCROSS science team, specifically the Observation Coordinator, will work with these other platforms to maximize their utility in achieving the LCROSS science goals. It is anticipated that the LCROSS S-C/C measurements will provide the measurements with a greater resolution and sensitivity than any other known ground based, or earth or lunar orbiting platforms. Therefore, the S-S/C measurements should be of higher priority than those from other platforms. Each measurement technique is summarized below.
Flash Photometry – At impact, the kinetic energy of the projectile is transferred to the kinetic (ejecta) and internal energy the target (compaction, heating). A portion of the internal energy may induce vapor resulting in vibrational and rotational emission lines that will evolve with space and time. The intensity and decay of the initial flash are related to the physical structure of the target (porosity, strength, volatile content, composition). Consequently, characterization of the initial flash provides a complementary tool to understand initial coupling and the nature of the target.
Visible Spectroscopy – Here visible spectroscopy refers to the measurement of spectra between 0.25 mm and 0.8 mm with a resolving power of l/dl >100. The LCROSS S-S/C will observe the pre- and post-EDUS-impacted lunar regolith in and outside the targeted region at a spatial resolution and viewing angle unobtainable from Earth. The visible spectrometer shall record the sunlit plume evolution, and track the evolution of OH- radicals from sunlight-dissociated water vapor molecules. The visible spectrometer will measure the OH- (308 nm) and H2O+ (619 nm) transitions simultaneous which shall assess the water vapor production.
NIR (Near Infrared) Spectroscopy – Here NIR spectroscopy refers to the measurement of spectra between 1.0 mm and 4.0 mm with a resolving power of l/dl >100. The LCROSS S-S/C will monitor spectral bands associated with water vapor, ice, and hydrated minerals covering the first overtones of the symmetric and asymmetric stretches of water; this band, relatively free from interferences, is more brightly illuminated by sunlight than the fundamentals near 3 microns, more than compensating the weaker absorption of the overtones. The regions near 1.4 and 1.9 microns, normally obscured by terrestrial atmospheric background in spectra from icy surfaces, will provide a sensitive indication of water vapor from ice or hydrates. The remainder of the spectral band will reveal the nature of ice crystals and mineral hydrates.
NIR Imaging – Imaging provides spatial resolution of the observed target. Two NIR imaging schemes are possible for LCROSS. The baseline includes two imagers, both with bandpass filters, one inside a water absorption line (e.g. at 1.6 mm) and one outside the line (e.g. at 1.4 mm), allowing the creation of water absorption band depth maps. The second scheme utilizes only a single broad band NIR imager to provide scene context for the NIR spectroscopy.
MIR (Mid Infrared) Imaging – For LCROSS, MIR imaging refers to imaging at thermal wavelengths between 6 and 15 mm. The same two NIR imaging schemes apply to MIR imaging. Pre- and post- impact thermal images of the impact terrain will be obtained from MIR cameras on the S-S/C to characterize the surface material (rock vs. regolith), obtain the thermal evolution of the plume (which is dependent on the water content), and observe the ejecta blanket and freshly exposed regolith.
Visible Imaging – Visible imaging for LCROSS refers to imaging at wavelengths between 0.4 and 0.8 mm with broad bandpass filtering for color.
Throughout the mission a verity of payload/measurement activities are planned prior to the final descent activities. These earlier activities monitor instrument health, perform instrument calibration, monitor for instrument contamination, or determine instrument alignment relative to each other and the spacecraft.
4 Impact Characterization
The LCROSS mission uses the impact of the Atlas V Centaur upper stage to excavate eject lunar surface material to where it can be observed by both the LCROSS S-S/C and other lunar orbiting, earth orbiting and ground based assets. It is necessary to model the expected results of the impact in order to plan and deploy the most effective measurement and operations plan. The next section summarizes the predicted characteristics of the impact as they relate to measurements and operation of the payload.
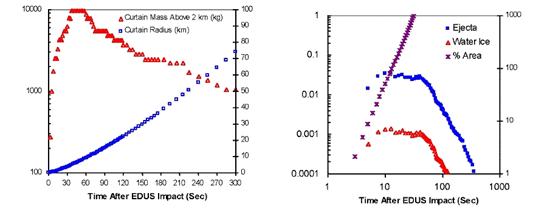
Total ejecta mass at
any altitude depends on a variety of parameters, including, but not limited to,
impact angle, impactor density and ejecta flight angle. Figure 1 shows a Monte-Carlo
study of ejecta mass at altitude for a variety of key impact parameter
combinations. Uncertainties in low velocity impacts (velocities less than
about 6 km s-1), such as the LCROSS impact, results in broad
profiles for the possible ejecta mass. 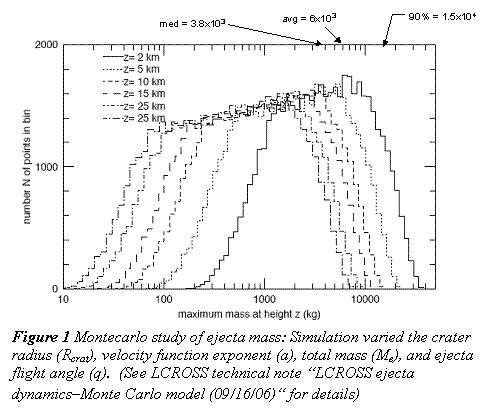 The evolution of the ejecta mass
and water is shown in Figure 2 assuming a total mass consistent with the
“median model” shown on the previous slide and an assumed 1% (wt) water content
in the regolith.
The evolution of the ejecta mass
and water is shown in Figure 2 assuming a total mass consistent with the
“median model” shown on the previous slide and an assumed 1% (wt) water content
in the regolith.
![Text Box:
Figure 2 (left) The predicted ejecta curtain mass as a function of altitude and time after impact; (right) the predicted water ice and vapor mass (assuming a 1%[wt] water regolith content) as a function of altitude and time after impact.](OPS_files/image003.gif)
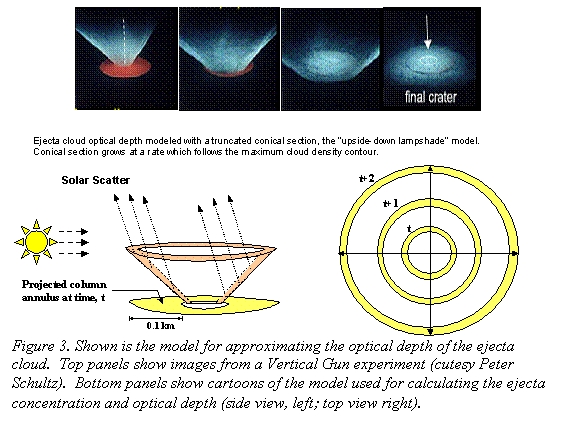 The
initial ejecta cloud will be cold (T<120 K). As the ejecta cloud reaches
sunlight the small particles will sublime quickly (~10 sec for a 40 micron
particle) releasing water vapor. The eject water mass at a variety of
altitudes is shown in Figure 2 (right panel), along with the estimation of the sublimed
water vapor. The opacity of the cloud is estimated from the total mass and
simplified cloud geometry. The ejecta cloud will approximately look like an
expanding conical section (Figure 3).
The
initial ejecta cloud will be cold (T<120 K). As the ejecta cloud reaches
sunlight the small particles will sublime quickly (~10 sec for a 40 micron
particle) releasing water vapor. The eject water mass at a variety of
altitudes is shown in Figure 2 (right panel), along with the estimation of the sublimed
water vapor. The opacity of the cloud is estimated from the total mass and
simplified cloud geometry. The ejecta cloud will approximately look like an
expanding conical section (Figure 3).

 Using
the model for optical depth described above, combined with an estimate of the
curtain radius (Figure 4, left), the ejecta and water ice optical depths
(Figure 4, right) as a function of time after impact can be calculated (for the
standard 1% water content model) at an altitude of 2 km above the crater
floor. The percent area curve (Figure 4, right) shows the percent of the nadir
UV/Visible and NIR spectrometer foreoptics aperture filled by curtain radiance
(for a four minute follow time).
Using
the model for optical depth described above, combined with an estimate of the
curtain radius (Figure 4, left), the ejecta and water ice optical depths
(Figure 4, right) as a function of time after impact can be calculated (for the
standard 1% water content model) at an altitude of 2 km above the crater
floor. The percent area curve (Figure 4, right) shows the percent of the nadir
UV/Visible and NIR spectrometer foreoptics aperture filled by curtain radiance
(for a four minute follow time).
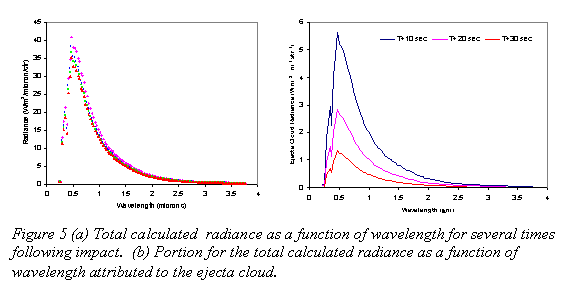
To simulate the solar illumination of the ejecta curtain the well know and tested multi-stream scattering code (Discrete Ordinate Radiative Transfer or DISORT) is used. The ejecta dust and water ice optical depths presented in Figure 4 are used for the ejecta opacity. Linear mixing is used to estimate combined dust and water ice cloud optical properties. The total radiance from the sunlit ejecta cloud is shown in Figure 5 (upper panel). Plotted are the total radiance (ejecta cloud + lunar surface) at time impact plus, 10 (pink), 20 (blue), 30 (green), and 60 (red) seconds. The radiance attributed to the ejecta cloud only (derived be subtracting off the spectra from the lunar surface) at three times (10, 20 and 30 seconds) after impact is shown in Figure 5 (lower panel).
5 Mission Periods
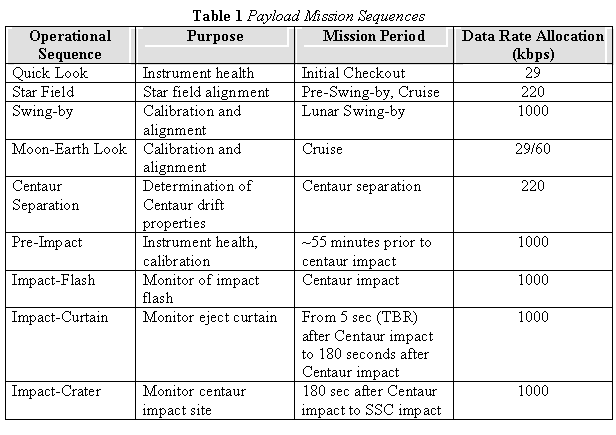 Payload
operations are organized by measurement goals and/or requirements. Specific
instrument operations are specified in sequences of commands/states. These
operational sequences, their general goals and the period in the mission in
which they are applied are summarized in Table 1.
Payload
operations are organized by measurement goals and/or requirements. Specific
instrument operations are specified in sequences of commands/states. These
operational sequences, their general goals and the period in the mission in
which they are applied are summarized in Table 1.
Quick Look – The primary purpose of this mode/sequence of operation is to check each instrument, individually, for its health status. Each instrument is place in its nominal operating configuration, and in some cases alternate configurations. No instruments are operated simultaneously in this mode. The s mode is used in some cases as a part of other modes/sequences.
Star Field – This mode/sequence makes measurements of specific star fields to be used in determining camera alignment relative to the spacecraft attitude control system.
Swing-by – The purpose of Swing-by is to make both wavelength and radiometric calibration measurements as well as pointing/alignment measurements with all instruments during the lunar swing-by encounter. The sequence is broken into two segments: 1) nadir viewing for calibration and inter-camera alignment, and 2) lunar limb crossings for spectrometer to camera alignment.
Moon-Earth Look – During Cruise at least two opportunities are planned to observe the Moon and one opportunity to observe the Earth. These observations will act as monitors of instrument health and contamination, calibrations and system alignment tests. This mode/sequence utilizes the Quick Look mode/sequence with a limb-crossing activity appended onto the end.
Centaur Separation – The goal of this mode/sequence is to measure the dynamics of the separated Centaur.
Pre-Impact – The first ~55 minutes of the final hour of descent is spend in the Pre-Impact mode/sequence. The purpose of this mode is to routinely check on instrument health, provide contextual descent data and instrument calibrations.
Just prior to impact of the Centaur (about 30 seconds prior to impact) the Impact mode/sequence is entered. In the Impact mode/sequence specific instrument configurations are managed with three sub-sequences including Flash, Curtain and Crater.
Impact-Flash – In this mode/sequence all instruments are configured to optimize measurements of the Centaur impact flash. The key instruments in this mode are the NIR camera #2, the TLP and the spectrometers.
Impact-Crater – In this mode/sequence all instruments are configured to optimize measurements of the impact ejecta curtain. In this mode the emphasis is on measuring the spectra and evolution of the solar-illuminated ejecta cloud.
Impact-Crater – In this mode/sequence all instruments are configured to optimize measurements of the crater formed by the Centaur impact itself.
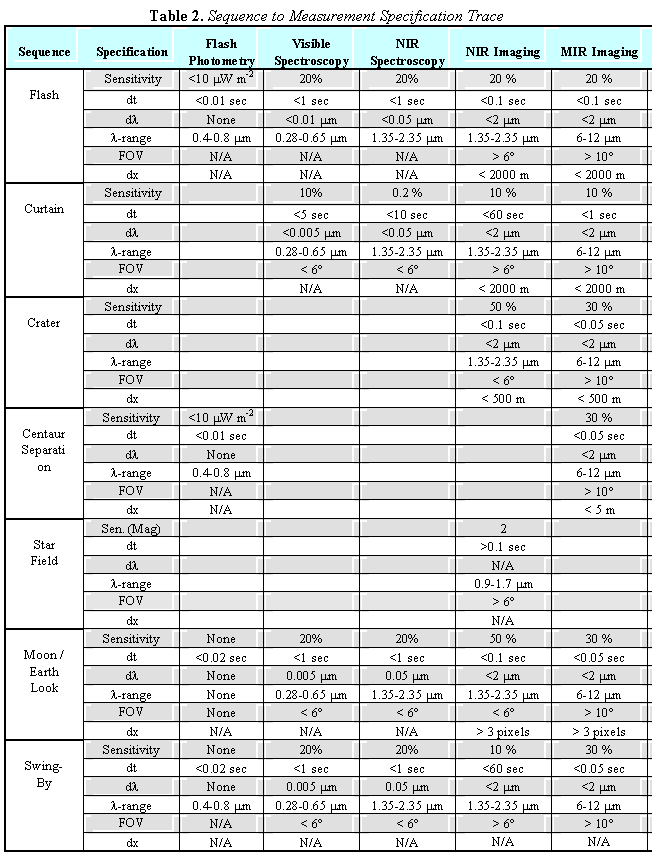
6 Measurement Specifications
Measurement specifications trace back to each of the measurement goals. Measurement specifications do not yet specify a technique but do identify a required accuracy and precision. Measurement requirements are captured in the Project Level 4 Requirements. Measurement specifications include (when applicable) instrument wavelength response, resolution, and sensitivity, and spatial resolution. These measurement specifications have been organized by measurement technique, as described the mission science plan (ARC-04.01.SciMP.01.v-DRAFTD), and mission period, and are summarized in Table 2. Ultimately it is the instrument specifications, captured as Level 4 requirements, which result in the particular instruments flown (defined in the Project Internal Payload Specification, document 05.02.PL-IDS.01.vDRAFT1) and, along with the impact characterization, define the specifics of the measurement and operational sequences.
7 Sequence Guidelines
Presented in this section are the guidelines for developing the mission sequences. Each sequence guideline defines the primary sequence goals, requirements and instrument operational specifications.
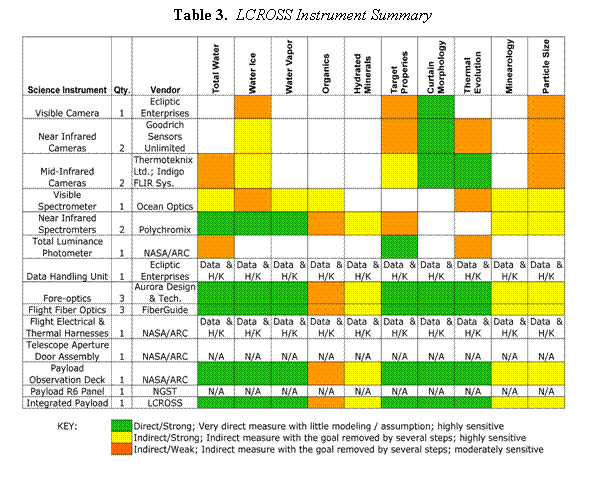
Instrument Definition
The various instruments that make up the LCROSS payload are summarized in Table 3. Detailed specifications for each instrument can be found in the Project Internal Payload Specification, document (05.02.PL-IDS.01.vDRAFT1).
The guidelines for developing the payload operational sequences are listed below. Each sequence is described in detail.
Review Status
The review status of each flight DHU sequence is summarized:
7.1 Quick Look
Primary Goals:
1. Take images/spectra from each instrument separately to determine functionality
2. Provide for commanding mode change for each instrument as appropriate
Requirements:
1. Must fit within in the specified downlink rate (29 kps)
2. Must isolate each instrument when powered
3. Require sufficient number of images/spectra from each instrument to ascertain contamination effects on performance
Instruments and Specifications:
<none>
Rate/Spec Summary:
<none>
Comparison of Specification to the QUICKLOOK Sequence:
|
Channel |
Specified |
Commanded |
Observed Rates/# Files (CPT) |
Deviations from Spec |
|
VIS |
<none> |
Rate=0.12Hz, dur=120s Total Powered Time: 120s |
0.11Hz |
<none> |
|
NIR1 |
<none> |
Rate=0.3Hz, Gain=1x · OPR 6, ENH: OFF, AGC:OFF, dur=30 s · OPR 9, ENH: OFF, AGC:OFF, dur=30s · OPR 15, ENH: OFF, AGC:OFF, dur=30s · Test Mode, dur=30s Total Powered Time: 120s |
0.28Hz 10 @ OPR 6 9 @ OPR 9 |
<none> |
|
NIR2 |
<none> |
Rate=0.3Hz, Gain=1x · OPR 6, ENH: OFF, AGC:OFF, dur=30 s · OPR 9, ENH: OFF, AGC:OFF, dur=30s · OPR 15, ENH: OFF, AGC:OFF, dur=30s · Test Mode, dur=30s Total Powered Time: 120s |
0.3Hz |
<none> |
|
MIR1 |
<none> |
Rate=0.07 Hz · High Gain, dur=60s · Lo Gain, dur=60s · Test Mode, dur=60s Total Powered Time: 180s |
0.07Hz |
<none> |
|
MIR2 |
<none> |
Rate=0.07 Hz · High Gain, dur=60s · Lo Gain, dur=60s · Test Mode, dur=60s Total Powered Time: 180s |
0.07Hz |
<none> |
|
NSP1 |
<none> |
Rate=72 Hz
Rate=166 Hz
Rate=1.7 Hz
Total Powered Time: 155s |
72.2Hz, 30s Total: 203 HS |
<none> |
|
NSP2 |
<none> |
Rate=72 Hz
Rate=166 Hz
Rate=1.7 Hz
Total Powered Time: 75s |
72.1Hz, 10s Total: 102 HS |
<none> |
|
VSP |
<none> |
Rate=0.2 Hz
Rate=1.4Hz
Two 4s exposures Rate=0.2Hz
Total Powered Time: 128s |
0.2 Hz 12 @ bracket 40 @ single 2 @ 4s snap 0.19 Hz Total: 93 spectra |
<none> |
|
TLP |
<none> |
Off |
Off |
(1) |
Notes:
[a] Each instrument is powered on/off sequentially in the order: VIS, NIR1, NIR2, VSP, MIR1, MIR2, NSP1 and NSP2. The TLP is not powered in this sequence. This pattern of instrument activation is used as an instrument checkout.
[b] NIR1/NIR2 undergo a specific set-up that fluctuates between a low and high base offset. Some of these images appear “saturated” although it is not dependent on light levels.
[c] Total numbers of IF and DM spectra from the NSP1/NSP2 do vary from run to run. The number shown here is from an actual run during CPT (4/2008) or later testing at NGST with the spacecraft.
Notes (Deviations from Specification):
(1) The TLP is not powered in this operation therefore its functionality is not checked.
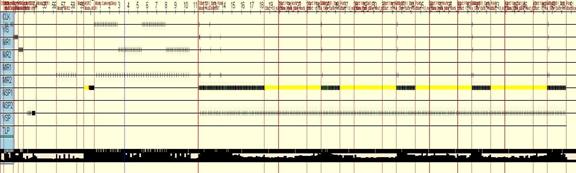
Quicklook-29k Observational Pattern: Last Updated: 2008-04-28
Tick marks on each row represent images or spectra returned by the instrument named at the left (the text label appears below the line containing its tick marks). For the cameras, a tick mark represents a single image. For the VSP, ticks represent either individual spectra or groups of three spectra (bracket mode). The VSP tick marks the receipt time of packet of the spectrum/spectra just taken (either single or triplet). Regarding the latter, a triplet spectra contains spectra take in this time order: (1) itime (base), 7ms delay, (2) itime/factor (short exposure), 7 ms delay, (3) itime*factor (long exposure) order then transfer time before time stamping packet. The yellow sections of the NSP1 and NSP2 lines represent flash mode (low resolution) spectra, and the red sections represent diagnostic mode packets. The black sections of those lines represent individual full-resolution spectra (Hadamard mode) and are individual ticks drawn too closely to distinguish at this scale. The TLP was not active here. The bottom row represents downlink capacity and usage. The top row is a timeline marked in minutes; this pattern is plotted using the DHU’s internal clock to generate the timeline rather than having it start with 0 at the beginning of the command sequence.
Quicklook-29k Sequence Milestones: Last Updated: 2009-02-19
Start Simulation
length: full-length
slot: 4
filename: quicklook-29k.cmd
msec NVM Msg min:sec
-------- - ---------------------------------------------- -----------
00000000 4 ECHO: Start Sequence (000:00.00)
00000050 4 ECHO: TLM_HSS_RATE :rate 29000 (000:00.05)
00000100 4 ECHO: Mode: QUICKLOOK 29 (000:00.10)
00000150 4 ECHO: Mode: VIS (000:00.15)
00121000 4 ECHO: Mode: NIR1 (002:01.00)
00273850 4 ECHO: Mode: NIR2 (004:33.85)
00426700 4 ECHO: Mode: VSP (007:06.70)
00546500 4 ECHO: Start VSP Exposure (009:06.50)
00556600 4 ECHO: Start VSP Exposure (009:16.60)
00610050 4 ECHO: Mode: MIR1 (010:10.05)
00799750 4 ECHO: Mode: MIR2 (013:19.75)
00989450 4 ECHO: Mode: NSP1 (016:29.45)
01144800 4 ECHO: Mode: NSP2 (019:04.80)
01220150 4 ECHO: Exit QUICKLOOK 29 (020:20.15)
--------------------------------
The sequence milestones listing shows messages printed by the QUICKLOOK command sequence when run on the DHU. The listing is intended for use when monitoring sequence execution.
Quicklook-29k Observation Statistics: Last Updated: 2009-02-19
Slot: 4
Filename: quicklook-29k.cmd
Elapsed Time: 1220250 msec (20.34 min)
PDS Data
Instrument Counts Volume Kbytes
---------- -------- --------
VIS: 15 15000
MIR1: 13 780
MIR2: 13 780
NIR1: 47 94000
NIR2: 47 94000
NSP1 IF: 2172 217
NSP1 HS: 205 2460
NSP1 DM: 100 10
NSP2 IF: 728 73
NSP2 HS: 103 1236
NSP2 DM: 100 10
VSP BM: 18 1620
VSP SM: 75 2250
TLP: 0 0
---------- -------- --------
263 Mbytes
The observation statistics show how many of each type of observation will be generated by each command sequence. The volume column is an early estimate of the contribution of this sequence to the PDS archive.
Quicklook Contingency:
There is no contingency rate case for Quicklook.
7.1 Star Field Sequence Guidelines
Primary Goals:
1. Take images of star fields for use in pointing calibration
2. Activate the TADA
Requirements:
1. Multiple images of star field with visible and NIR cameras
2. Deploy TADA
3. Take measurements with spectrometers before and after TADA deployment
4. Telemetry rate < 220 kbps
Instruments and Specifications:
1. Visible camera with periods of maximum rate (to minimize SC blur)
2. NIR camera following visible camera barrage, with integration times > 0.1 sec (TBR)
3. VSP and NSP sampled before and after TADA Activation at “nominal” rates/modes
Rate/Spec Summary:
Vis cam: 5 Hz
NIR1 cam: off
NIR2 cam: 0.5 Hz, integration = 0.1 sec
MIR1 cam: off
MIR2 cam: off
TLP: off
VSP: Bracket Mode with tau = 0.5 sec, factor = 5
NSP1: No Decimation, Hadamard mode
Comparison of Specification to the STARFIELD Sequence:
Last Updated: 2009-02-19
|
|
Specified |
Commanded |
Observed |
Deviations from Spec |
|
VIS |
Rate=5 Hz |
Off |
Off |
(1) |
|
NIR1 |
Off |
Off |
Off |
<none> |
|
NIR2 |
Rate=0.5 Hz Int=0.1 s |
Rate=0.5 Hz Gain=1x OPR 15, ENH: ON, AGC:OFF, dur=10 min OPR 15, ENH: OFF, AGC:OFF,
dur=20 min |
0.5 Hz 112 Setup @ OPR15 303 @ OPR15/ENHOFF |
(2) |
|
MIR1 |
Off |
Off |
Off |
<none> |
|
MIR2 |
Off |
Rate=0.5 Hz |
0.5 Hz |
<none> |
|
NSP1 |
Rate=1.7 Hz |
Off |
Off |
(4) |
|
NSP2 |
Not specified |
Off |
Off |
<none> |
|
VSP |
Bracket Mode Rate=<not specified> |
Single Mode Rate = 0.125 Hz Int = 5 seconds |
0.13 Hz Int = 5000 msec Total: 147 spectra |
<none> |
|
TLP |
Off |
Off |
Off |
<none> |
|
TADA |
Operated |
To be operated via ground command |
Not Operated |
(5) |
Notes (Deviations from Specification):
(1) VIS is not expected to be sensitive enough for this measurement and was removed from the sequence
(2) NIR2 (unfiltered) is the best candidate large-FOV imager for starfield.
(3) During CPT/TVAC testing however, a shortened version of starfield was used which is not representative of the actual flight sequence. The simulation suggests there will be 1620 and 1588 total NIR2 and MIR2 images, respectively.
(4) It is not expected that NSP1 will have sufficient sensitivity to detect stars in the proposed starfields.
(5) The syntax of the discrete commands to the DHU for TADA was tested during space vehicle thermal vacuum testing. In flight, TADA operations are to be performed with a ground command containing those same discrete commands through a STOL proc.
Starfield-220k Observational pattern: Last Updated: 2008-04-28
(A) The vertical line to the left of (A) indicates when the TADA will be commanded open via the ground. (Data: dhu_tvac_cpt2_starfield_220k-2008-06-06-PODCover-LiteTest)
(B) Marks approx. 17.4 minutes (1045s) since sequence start. Actual flight sequence is 53.5 minutes. Therefore this image is missing the NIR2 Enhancement OFF with continued MIR2 and VSP for another ~36 minutes of data.
Starfield-220k Sequence Milestones: Last Updated: 2009-02-19
Start Simulation
length: full-length
slot: 5
filename: starfield-220k.cmd
msec NVM Msg min:sec
-------- - ---------------------------------------------- -----------
00000000 5 ECHO: Start Sequence (000:00.00)
00000050 5 ECHO: TLM_HSS_RATE :rate 220000 (000:00.05)
00000100 5 ECHO: Mode: STARFIELD-220 (000:00.10)
00033600 5 ECHO: Turn on MIR2 (000:33.60)
00037950 5 ECHO: Turn on VSP (000:37.95)
00170300 5 ECHO: Activate TADA (002:50.30)
00832550 5 ECHO: NIR2 Enhancement ON (013:52.55)
01432700 5 ECHO: NIR2 Enhancement OFF (023:52.70)
03210850 5 ECHO: Expected Sequence End (053:30.85)
--------------------------------
Starfield-220k Observation Statistics: Last Updated: 2009-02-19
Slot: 5
Filename: starfield-220k.cmd
Elapsed Time: 3210950 msec (53.52 min)
PDS Data
Instrument Counts Volume Kbytes
---------- -------- --------
VIS: 0 0
MIR1: 0 0
MIR2: 1588 95280
NIR1: 0 0
NIR2: 1620 3240000
NSP1 IF: 0 0
NSP1 HS: 0 0
NSP1 DM: 0 0
NSP2 IF: 0 0
NSP2 HS: 0 0
NSP2 DM: 0 0
VSP BM: 0 0
VSP SM: 396 11880
TLP: 0 0
---------- -------- --------
6428 Mbytes
Starfield Contingency:
Nominal starfield is starfield-220k. Rate contingency is starfield-58k. Comparison between the baseline and contingency is summarized below. Only the rates for NIR2 and MIR2 were altered. This was not actually run on the S/C during March 2008 functionals. It was designed on the simulator with sufficient instrument complement to predict correct loads.
|
|
Baseline starfield-220k |
Contingency starfield-58k |
|
VIS |
Off |
Off |
|
NIR1 |
Off |
Off |
|
NIR2 |
Rate=0.5 Hz Gain=1x OPR 15, ENH: ON, AGC:OFF, dur=10 min OPR 15, ENH: OFF, AGC:OFF,
dur=20 min |
Rate=0.2 Hz Gain=1x OPR 15, ENH: ON, AGC:OFF, dur=10 min OPR 15, ENH: OFF, AGC:OFF,
dur=20 min |
|
MIR1 |
Off |
Off |
|
MIR2 |
Rate=0.5 Hz |
Rate=0.2 Hz |
|
NSP1 |
Off |
Off |
|
NSP2 |
Off |
Off |
|
VSP |
Single Mode Rate = 0.125 Hz Int = 5 seconds |
Single Mode Rate = 0.125 Hz Int = 5 seconds |
|
TLP |
Off |
Off |
|
TADA |
To be operated via ground command |
To be operated via ground command |
Contingency Starfield-58k Sequence Milestones: Last Updated: 2009-02-19
Start Simulation
length: full-length
slot: 6
filename: starfield-58k.cmd
msec NVM Msg min:sec
-------- - ---------------------------------------------- -----------
00000000 6 ECHO: Start Sequence (000:00.00)
00000050 6 ECHO: TLM_HSS_RATE :rate 58000 (000:00.05)
00000100 6 ECHO: Mode: STARFIELD-58 (000:00.10)
00033600 6 ECHO: Turn on MIR2 (000:33.60)
00037950 6 ECHO: Turn on VSP (000:37.95)
00170300 6 ECHO: Activate TADA (002:50.30)
00832550 6 ECHO: NIR2 Enhancement ON (013:52.55)
01432700 6 ECHO: NIR2 Enhancement OFF (023:52.70)
03210850 6 ECHO: Expected Sequence End (053:30.85)
--------------------------------
Contingency Starfield-58k Observation Statistics: Last Updated: 2009-02-19
Slot: 6
Filename: starfield-58k.cmd
Elapsed Time: 3210950 msec (53.52 min)
PDS Data
Instrument Counts Volume Kbytes
---------- -------- --------
VIS: 0 0
MIR1: 0 0
MIR2: 636 38160
NIR1: 0 0
NIR2: 648 1296000
NSP1 IF: 0 0
NSP1 HS: 0 0
NSP1 DM: 0 0
NSP2 IF: 0 0
NSP2 HS: 0 0
NSP2 DM: 0 0
VSP BM: 0 0
VSP SM: 396 11880
TLP: 0 0
---------- -------- --------
2580 Mbytes
7.2 Swing-By / Calibration Sequence Guidelines
Primary Goals:
1. Radiometric and spectral calibration all instruments
2. Determine instrument pointing relative to SC reference frame (Star Tracker)
3. Demonstrate SC “Science Mode” pointing control
4. Demonstrate “Final Hour” operation of all instruments.
Requirements:
1. Observation of lunar near side
2. Observations from the dark-side of the lunar terminator to the illuminated limb, with at least two “stares” with payload pointing drift rates of < 0.3 deg/sec
3. Crossing observations of the E-W and S-N lunar limb with payload pointing crossing rates of < 0.6 deg/sec (expected rate = 0.5 deg/sec)
Instruments and Specifications:
- During nadir/ground viewing run instruments in curtain mode
- During limb-crossing viewing:
- NSP1: Flash mode with no decimation
- VSP: Bracket Mode with tau = 0.2 sec, factor = 2
- Vis Cam: Sample Rate to constrain pixel crossing to < 0.1 deg = drift rate/0.1 = 5 Hz.
Rate/Spec Summary:
Nadir/Ground:
Per “Curtain” Mode
Limb-Crossings
Vis cam: 5 Hz
NIR1 cam: off
NIR2 cam: off
MIR1 cam: 0.5 Hz, High Gain
MIR2 cam: 0.5 Hz, High Gain
TLP: 1000 Hz
VSP: Bracket Mode with tau = 0.2 sec, factor = 2
NSP1: No Decimation, Flash mode
NSP2: No Decimation, Flash mode
Comparison of Specification to the SWINGBY-GROUND Sequence:
Last Updated: 2008-04-28
|
|
Specified |
Commanded |
Observed |
Deviations from Spec |
|
VIS |
Rate=1 Hz |
Rate=0.816 Hz |
0.79 Hz |
(1) |
|
NIR1 |
Rate=3 Hz |
Rate=0.408 Hz AGC:ON ENH:ENABLE OFF |
0.39 Hz |
(1) (2) |
|
NIR2 |
Rate=3 Hz |
Rate=0.408 Hz AGC:ON ENH:ENABLE OFF |
0.40 Hz |
(1) (2) |
|
MIR1 |
Rate=3 Hz |
Rate=3 Hz |
3.00 Hz |
|
|
MIR2 |
Rate=3 Hz |
Rate=3 Hz |
2.99 Hz |
|
|
NSP1 |
Rate=1.7 Hz |
Rate=1.7 Hz |
1.69 Hz |
|
|
NSP2 |
Rate=1.7 Hz |
Rate=1.7 Hz |
1.70 Hz |
|
|
VSP |
Rate=<none> |
Rate=0.5 Hz |
0.50 Hz |
(3) |
|
TLP |
Rate=1000 Hz |
Rate=0 Hz |
Off |
(4) |
Comparison of Specification to the SWINGBY-LIMB Sequence:
Last Updated: 2008-04-28
|
|
Specified |
Commanded |
Observed |
Deviations from Spec |
|
VIS |
Rate=5 Hz |
Rate=3.0 Hz |
3.0 Hz |
(5) |
|
NIR1 |
Rate=0 Hz |
2 context images AGC:ON ENH:ENABLE OFF |
2 context images per position
|
(6)
|
|
NIR2 |
Rate=0 Hz |
2 context images AGC:ON ENH:ENABLE OFF |
2 context images per position
|
(6)
|
|
MIR1 |
Rate=0.5 Hz |
2 context images |
2 context images per position |
(6)
|
|
MIR2 |
Rate=0.5 Hz |
2 context images |
2 context images per position |
(6)
|
|
NSP1 |
Rate=72 Hz |
Rate=72 Hz |
Flash mode |
|
|
NSP2 |
Rate=1.7 Hz |
Disabled |
Disabled |
(7) |
|
VSP |
Rate=<none> |
Rate=0.5 Hz |
0.49 Hz |
(8) |
|
TLP |
Rate=1000 Hz |
Off |
Off |
(4) |
Notes (Deviations from Specification):
(1) The DHU cannot continuously take images with more than one camera without allocating a command sequence to control the camera. Command sequences are a limited resource and are shared between science modes. The command sequence used here to control VIS, NIR1 and NIR2 is also used during the impact sequence, and the rates are determined by bandwidth available at that time.
(2) Image radiance in this situation will vary and has high uncertainty. The auto-gain mechanism on the NIR cameras was selected and the DHU periodically collects reports from the cameras to log the gain setting the cameras have adopted as a function of time.
(3) The VSP rate was not clearly specified in the requirements. For swingby-ground, the rate is higher (faster) than curtain mode due to shorter exposure times. Swingby-ground-1000k and (preimpact-impact-1000k) curtain have VSP bracket rates at 0.5 Hz and 0.2 Hz, respectively.
(4) The TLP will not be powered on during the swingby to reduce the number of power cycles it experiences.
(5) 5 Hz did not fit within the downlink budget
(6) NIR1, NIR2, MIR1 and MIR2 were changed to provide context images at the end of each limb crossing.
(7) ‘Disabled’ means the instrument is powered but its telemetry packets are suppressed.
(8) The VSP rate was unspecified in the requirements.
Swingby-1000k Observational Pattern: Last Updated: 2008-04-28
C A B
(A) The ground phase is shortened in this run.
(B) The red line to the left of B represents the transition between the swingby ground and limb phases.
(C) The columns of double hash marks represent the context images taken with NIR1, NIR2, MIR1 and MIR2
Swingby-1000k Sequence Milestones: Last Updated: 2009-02-19
Start Simulation
length: full-length
slot: 9
filename: swingby-1000k-ground.cmd
msec NVM Msg min:sec
-------- - ---------------------------------------------- -----------
00000000 9 ECHO: Start Sequence (000:00.00)
00000050 9 ECHO: TLM_HSS_RATE :rate 1000000 (000:00.05)
00000100 9 ECHO: Mode: SWINGBY 1000 AUTOGAIN (000:00.10)
00003050 9 ECHO: Mode: CURTAIN 1000 AUTOGAIN (000:03.05)
01840050 8 ECHO: Stop Other Sequences (030:40.05)
01840150 8 ECHO: Mode: Limb1_out (030:40.15)
01870150 8 ECHO: Limb_Slew (limb 1) (031:10.15)
01900150 8 ECHO: Limb1_in (031:40.15)
01960150 8 ECHO: Limb_Slew (limb 1) (032:40.15)
01990150 8 ECHO: Limb1_out (033:10.15)
02050150 8 ECHO: Limb_Slew (limb 1) (034:10.15)
02080150 8 ECHO: Limb1_in (034:40.15)
02140150 8 ECHO: 5_minute_slew to limb 2 (035:40.15)
02440150 8 ECHO: Limb1_out (040:40.15)
02470150 8 ECHO: Limb_Slew (limb 2) (041:10.15)
02500150 8 ECHO: Limb1_in (041:40.15)
02560150 8 ECHO: Limb_Slew (limb 2) (042:40.15)
02590150 8 ECHO: Limb1_out (043:10.15)
02650150 8 ECHO: Limb_Slew (limb 2) (044:10.15)
02680150 8 ECHO: Limb1_in (044:40.15)
02740150 8 ECHO: End limb 2 (045:40.15)
02740750 8 ECHO: End LIMB 1000 (045:40.75)
Swingby-1000k Observation Statistics: Last Updated: 2009-02-19
Slot: 9
Filename: swingby-1000k-ground.cmd
Elapsed Time: 2740850 msec (45.68 min)
PDS Data
Instrument Counts Volume Kbytes
---------- -------- --------
VIS: 4293 4293000
MIR1: 8232 493920
MIR2: 8223 493380
NIR1: 724 1448000
NIR2: 724 1448000
NSP1 IF: 65426 6543
NSP1 HS: 3129 37548
NSP1 DM: 0 0
NSP2 IF: 0 0
NSP2 HS: 3129 37548
NSP2 DM: 0 0
VSP BM: 1360 122400
VSP SM: 0 0
TLP: 0 0
---------- -------- --------
40303 Mbytes
Swingby Contingency: Last Updated: 2009-02-19
Nominal swingby is swingy-1000k. Rate contingency is swingby-220k. Comparison between the baseline and contingency is summarized below.
|
|
Baseline Swingby-ground-1000k |
Contingency Swingby-ground-220k |
|
VIS |
Rate=0.816 Hz |
Rate=0.119 Hz |
|
NIR1 |
Rate=0.408 Hz AGC:ON; ENH:ENABLE OFF |
Rate=0.119 Hz |
|
NIR2 |
Rate=0.408 Hz AGC:ON; ENH:ENABLE OFF |
Rate=0.119 Hz |
|
MIR1 |
Rate=3 Hz; High Gain |
Rate=0.2 Hz; High Gain |
|
MIR2 |
Rate=3 Hz; High Gain |
Rate=0.2 Hz; High Gain |
|
NSP1 |
Rate=1.7 Hz; Hadamard Mode |
Rate=1.7 Hz; Hadamard Mode |
|
NSP2 |
Rate=1.7 Hz; Hadamard Mode |
Rate=1.7 Hz; Hadamard Mode |
|
VSP |
Rate=0.5 Hz ; int=0.1, 0.2, 0.4 sec |
Rate=0.5 Hz; int=0.1, 0.2, 0.4 sec |
|
TLP |
Rate=0 Hz |
Rate=0 Hz |
|
|
Baseline Swingby-limb-1000k |
Contingency Swingby-limb-220k |
|
VIS |
Rate=3.0 Hz |
Rate=0.5 Hz |
|
NIR1 |
2 context images AGC:ON; ENH:ENABLE OFF |
2 context images AGC:ON; ENH:ENABLE OFF |
|
NIR2 |
2 context images AGC:ON; ENH:ENABLE OFF |
2 context images AGC:ON; ENH:ENABLE OFF |
|
MIR1 |
2 context images |
2 context images |
|
MIR2 |
2 context images |
2 context images |
|
NSP1 |
Rate=72 Hz |
Rate=72 Hz |
|
NSP2 |
Disabled |
Disabled |
|
VSP |
Rate=0.5 Hz |
Disabled |
|
TLP |
Off |
Off |
Swingby Contingency Sequence Milestones: Last Updated: 2009-02-19
Start Simulation
length: full-length
slot: 6
filename: swingby-220k-ground.cmd
msec NVM Msg min:sec
-------- - ---------------------------------------------- -----------
00000000 6 ECHO: Start Sequence (000:00.00)
00000050 6 ECHO: TLM_HSS_RATE :rate 220000 (000:00.05)
00000100 6 ECHO: Mode: SWINGBY 220 AUTOGAIN (000:00.10)
00003050 6 ECHO: Mode: CURTAIN 220 AUTOGAIN (000:03.05)
01840050 5 ECHO: Stop Other Sequences (030:40.05)
01840150 5 ECHO: Mode: Limb1_out (030:40.15)
01870150 5 ECHO: Limb_Slew (limb 1) (031:10.15)
01900150 5 ECHO: Limb1_in (031:40.15)
01960150 5 ECHO: Limb_Slew (limb 1) (032:40.15)
01990150 5 ECHO: Limb1_out (033:10.15)
02050150 5 ECHO: Limb_Slew (limb 1) (034:10.15)
02080150 5 ECHO: Limb1_in (034:40.15)
02140150 5 ECHO: 5_minute_slew to limb 2 (035:40.15)
02440150 5 ECHO: Limb1_out (040:40.15)
02470150 5 ECHO: Limb_Slew (limb 2) (041:10.15)
02500150 5 ECHO: Limb1_in (041:40.15)
02560150 5 ECHO: Limb_Slew (limb 2) (042:40.15)
02590150 5 ECHO: Limb1_out (043:10.15)
02650150 5 ECHO: Limb_Slew (limb 2) (044:10.15)
02680150 5 ECHO: Limb1_in (044:40.15)
02740150 5 ECHO: End limb 2 (045:40.15)
02740750 5 ECHO: End LIMB 220 (045:40.75)
Swingby Contingency Observation Statistics: Last Updated: 2009-02-19
Slot: 6
Filename: swingby-220k-ground.cmd
Elapsed Time: 2740850 msec (45.68 min)
PDS Data
Instrument Counts Volume Kbytes
---------- -------- --------
VIS: 650 650000
MIR1: 560 33600
MIR2: 559 33540
NIR1: 227 454000
NIR2: 227 454000
NSP1 IF: 65422 6542
NSP1 HS: 3129 37548
NSP1 DM: 0 0
NSP2 IF: 0 0
NSP2 HS: 3129 37548
NSP2 DM: 0 0
VSP BM: 910 81900
VSP SM: 0 0
TLP: 0 0
---------- -------- --------
3960 Mbytes
7.3 Moon/Earth Look Sequence Guidelines
Assumptions:
1. SC drift rate during measurement = 0.3 deg/sec
2. SC in “science” pointing/control mode
Primary Goals:
1. Calibration of spectrometers
2. Instrument health check
3. Contamination check
Requirements / Measurements:
1. Observe the moon from a distance between 100,000 km (lunar angle ~2 deg) and 200,000 km (lunar angle ~ 1 deg).
2. Observe the moon with all instruments.
3. Telemetry rate < 220 kbps
Instruments and Specifications:
1. Visible camera running at rate sufficient to track lunar edge between images to 0.1 deg: for a SC drift rate of 0.3 deg/sec, this is ~ 3 Hz
2. NIR camera IFOV ~0.1 deg: thus NIR cam integration should be < 0.3 sec, sample rate about 1/3 that of the visible camera (ratio of IFOVs ~3)
3. VSP at “nominal” rate
4. NSP sampled in Hadamard mode
Rate/Spec Summary:
Vis cam: 3 Hz
NIR1 cam: 1 Hz, integration ~0.08 sec (OPR 12) (TBR)
NIR2 cam: 1 Hz, integration ~0.05 sec (OPR 8) (TBR)
MIR1 cam: sample rate = 0.5 Hz
MIR2 cam: sample rate = 0.5 Hz
TLP: 1000 Hz
VSP: Bracket Mode with tau = 0.5 sec, factor = 5
NSP1: No Decimation, Hadamard mode
NSP2: No Decimation, Hadamard mode
Notes:
A single sequence has been prepared for both the earth looks and the moon looks (called EARTHMOON). Two versions of this sequence have been prepared to fit within 29K and 60K downlink budgets (EARTHMOON_29K and EARTHMOON_60K). Each EARTHMOON sequence combines an instrument health check (shortened quicklook) with instrument function and boresight calibration. The sequence (designed in March 2009) has three phases (1) shortened quicklook, (2) camera sleep (during a slew maneuver to bring the Earth/Moon into view, and (3) Alignment (a series of N-S then E-W operations with controlled stares at center, a pattern repeated 2x).
The boresight calibration is expected to involve sweeping the instrument boresight across the Earth or Moon in the pattern shown below. The solid circle represents the Earth (blue) or Moon (orange) and the dashed circle represents the NSP1 field-of-view (green). The drawing reflects their relative sizes for a 400,000 km distance calibration. The arrows show the movement of the boresight (NSP1) axis, moving 3 degree full swing, or 1.5 degree off-center. Center is defined at points 1,4, & 7. The 1-degree NSP1 field-of-view is expected to move completely off the target at points 2,3,5, & 6. The target will stay well-within the VIS/NIR/MIR camera’s field of view at all times. The Moon (dia. ~0.5 deg) is expected to under fill the 1deg NSP1/FOV for this distance.
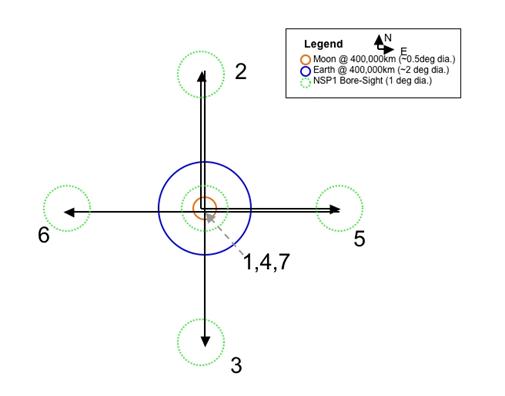
Figure 1. NSP1 FOV (dotted green circles) superimposed on the Earth (blue circle) or Moon (orange circle) for a 400,000 km Earthmoon look along with a representative pattern of slews and relative direction and lengths of slews drawn to proportion.
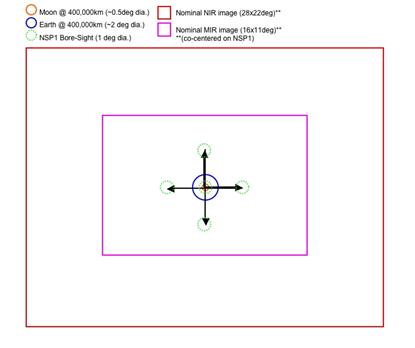
Figure 2. Two camera FOVs arranged to be co-centered (there are offsets in practice, but on order of a few pixels) with the NSP1 FOV (dotted green circles) center for the same scene in Figure 1. This figure shows that the Earth/Moon will be well captured within the Cameras for the duration of the sequence.
|
Comparison of Specification to the EARTHMOON_29K Sequence:
Last Updated 2009-03-09
|
|
Specified |
Commanded |
Observed |
Commanded |
Deviations from Spec |
|
Mini-Quicklook ~9 minutes (a) |
|||||
|
VIS |
Rate=3 Hz |
Rate=0.816 Hz |
0.79 Hz |
0.12 Hz Duration: 60 s |
(1)
|
|
NIR1 |
Rate=1 Hz |
Rate=0.408 Hz AGC:ON ENH:ENABLE OFF |
0.39 Hz |
0.3 Hz Setup, 15s OPR6, 15s Duration: ~30s |
(1) (2) |
|
NIR2 |
Rate=1 Hz |
Rate=0.408 Hz AGC:ON ENH:ENABLE OFF |
0.40 Hz |
0.3 Hz Setup, 15s OPR6, 15s Duration: ~30s |
(1) (2) |
|
MIR1 |
Rate=3 Hz |
Rate=3 Hz |
3.00 Hz |
0.07Hz HiGain LoGain Duration: 120s |
|
|
MIR2 |
Rate=3 Hz |
Rate=3 Hz |
2.99 Hz |
0.07Hz HiGain LoGain Duration: 120s |
|
|
NSP1 |
Rate=1.7 Hz |
Rate=1.7 Hz |
1.69 Hz |
IF: 72.2Hz, 30s |
|
|
NSP2 (a) |
Rate=1.7 Hz |
Rate=1.7 Hz |
1.70 Hz |
IF: 72.2Hz, 10s |
|
|
VSP |
Rate=<not specified> |
Rate=0.5 Hz |
0.50 Hz |
0.2 Hz/int=0.1, 0.5, 2.5s, for 30s 1.3 Hz/int=0.4s, for 20s Duration: ~82s |
(3) |
|
TLP |
Rate=1000 Hz |
Rate=0 Hz |
Off |
Off |
(4) |
|
Camera Sleep (during Large Slew to Target) ~ 10 minutes |
|||||
|
VIS |
|
|
|
0.12 Hz for ~2.5 min Gap for ~2.5 min 0.12 Hz for ~2.5 min Gap for ~2.5 min |
|
|
NIR2 |
|
|
|
Gap for 2.5 min AGC:ON for 2.5 min Gap for 2.5 min AGC:ON for 2.5 min |
|
|
MIR2 |
|
|
|
0.07 Hz for 10 min |
|
|
Alignment (Stare, Slew N-S-Center, Stare, Slew E-W-Center, Stare, x2) ~39 minutes |
|||||
|
VIS |
|
|
|
2 snaps at Position 1,4,7 |
|
|
NIR1 |
|
|
|
2 snaps each at: OPR6 @ Position 1 OPR9 @ Position 4 AGC:ON @ Position 7 |
|
|
NIR2 |
|
|
|
OPR6 @ Position 1 OPR9 @ Position 4 AGC:ON @ Position 7 |
|
|
MIR1 |
|
|
|
2 snaps per Position 1,4,7 separated by 6s |
|
|
MIR2 |
|
|
|
2 snaps per Position 1,4,7 separated by 6s |
|
|
VSP |
|
|
|
0.1 Hz/int=0.1,0.5,2.5 |
|
|
NSP1 |
|
|
|
IF: 5Hz during slews HS: 0.425 Hz during stare |
|
|
NSP2 |
|
|
|
Off |
|
Notes:
(a) The order for powering the instruments is slightly different from Quicklook. For EarthMoon they are in order: VIS, NIR1, NIR2, VSP, MIR1, MIR2, NSP2, and NSP1, keeping each instrument on after being powered EXCEPT NSP2 which is turned off after its quicklook operation. The TLP is not powered during this sequence
Notes (Deviations from Specification):
1. The DHU cannot continuously take images with more than one camera without allocating a command sequence to control the camera. Command sequences are a limited resource and are shared between science modes. The command sequence used here to control VIS, NIR1 and NIR2 is also used during the impact sequence, and the rates are determined by bandwidth available at that time.
2. Image radiance in this situation will vary and has high uncertainty. The auto-gain mechanism on the NIR cameras was elected, along with key OPR 6/9 settings and the cameras report periodically what gain setting they are using.
3. The VSP rate was unspecified in the requirements.
4. The TLP will not be powered on during the swingby to reduce the number of power cycles it experiences.
5. 5 Hz did not fit within the downlink budget.
6. NIR1, NIR2, MIR1 and MIR2 were changed to provide context images at the end of each limb crossing.
7. ‘Disabled’ means the instrument is powered but its telemetry packets are suppressed.
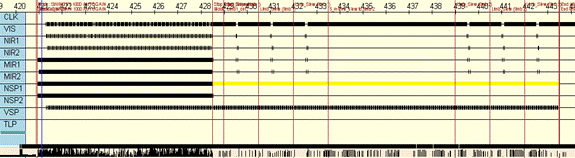
Earthmoon-29k Observation Pattern: Last Updated 2009-03-09
E2 D2 G2 F2 G1 F1 E1 D1 C B A
Notes: The pattern above is missing NIR1, MIR1 and NSP2. This is because this sequence was developed on the PL simulator that did not have a complete instrument complement.
(A) A shortened quicklook sequence (with a reverse in NSP2 and NSP1 order).
(B) During a slew towards the Earth/Moon where the Earth/Moon might be captured in the largest FOVs (VIS and NIR2/AGC:On are chosen to cover a large dynamic range). MIR2 is also streaming images. The other instruments, although powered, are having their data streamed from the DHU.
(C) Alignment portion of this sequence begins here with a 7-minute stare at Position 1. The 5 cameras have snapshots taken at 3 points.
(D1, D2) Slewing to the North, then South (through center) to Center. Only NSP1 and VSP data is taken throughout.
(E1, E2) Stare at Position 4 after a N/S slew. Snapshots with the 5 cameras are resumed. NSP1 and VSP data taken throughout.
(F1, F2) Slewing to the East then West(through center) to Center. Only NSP1 and VSP data is taken throughout.
(G1, G2) Stare at Position 7 after a E/W slew. Snapshots with the 5 cameras are resumed. NSP1 and VSP data taken throughout.
Earthmoon-29k Sequence Milestones: Last Updated 2009-03-09
Start Simulation
length: full-length
slot: 6
filename: earthmoon-29k.cmd
msec NVM Msg min:sec
-------- - ---------------------------------------------- -----------
00000000 6 ECHO: Start Sequence (000:00.00)
00000050 6 ECHO: TLM_HSS_RATE :rate 29000 (000:00.05)
00000100 6 ECHO: Mode: EARTHMOON 29 (000:00.10)
00000150 6 ECHO: Mode: VIS (000:00.15)
00060950 6 ECHO: Mode: NIR1 (001:00.95)
00093350 6 ECHO: Mode: NIR2 (001:33.35)
00125750 6 ECHO: Mode: VSP (002:05.75)
00207600 6 ECHO: Mode: MIR1 (003:27.60)
00336300 6 ECHO: Mode: MIR2 (005:36.30)
00465000 6 ECHO: Mode: NSP2 (007:45.00)
00510350 6 ECHO: Mode: NSP1 (008:30.35)
00575700 6 ECHO: Mode: Camera Sleep (009:35.70)
01236700 6 ECHO: Mode: ALIGNMENT (020:36.70)
01239950 6 ECHO: Start: DB1_Earth_Point (020:39.95)
01659950 6 ECHO: Start: 1.5_min_Slew_North_p3 (027:39.95)
01749950 6 ECHO: Start: Pitch_North_p3 (029:09.95)
01750950 6 ECHO: Start: 3_min_Slew_South_p3 (029:10.95)
01929950 6 ECHO: Start: Pitch_South_p3 (032:09.95)
01930950 6 ECHO: Start: 1.5_min_Slew_Earth_Point (032:10.95)
02019950 6 ECHO: Start: DB1_Earth_Point (033:39.95)
02139950 6 ECHO: Start: 1.5_min_Slew_East_p3 (035:39.95)
02229950 6 ECHO: Start: Yaw_East_p3 (037:09.95)
02230950 6 ECHO: Start: 3_min_Slew_West_p3 (037:10.95)
02409950 6 ECHO: Start: Yaw_West_p3 (040:09.95)
02410950 6 ECHO: Start: 1.5_min_Slew_Earth_Point (040:10.95)
02499950 6 ECHO: Start: DB1_Earth_Point (041:39.95)
02619950 6 ECHO: Start: 1.5_min_Slew_North_p3 (043:39.95)
02709950 6 ECHO: Start: Pitch_North_p3 (045:09.95)
02710950 6 ECHO: Start: 3_min_Slew_South_p3 (045:10.95)
02889950 6 ECHO: Start: Pitch_South_p3 (048:09.95)
02890950 6 ECHO: Start: 1.5_min_Slew_Earth_Point (048:10.95)
02979950 6 ECHO: Start: DB1_Earth_Point (049:39.95)
03099950 6 ECHO: Start: 1.5_min_Slew_East_p3 (051:39.95)
03189950 6 ECHO: Start: Yaw_East_p3 (053:09.95)
03190950 6 ECHO: Start: 3_min_Slew_West_p3 (053:10.95)
03369950 6 ECHO: Start: Yaw_West_p3 (056:09.95)
03370950 6 ECHO: Start: 1.5_min_Slew_Earth_Point (056:10.95)
03459950 6 ECHO: Start: DB1_Earth_Point (057:39.95)
03580450 6 ECHO: End Sequence (059:40.45)
--------------------------------
Earthmoon-29k Observation Statistics: Last Updated 2009-03-09
Slot: 6
Filename: earthmoon-29k.cmd
Elapsed Time: 3580550 msec (59.68 min)
PDS Data
Instrument Counts Volume Kbytes
---------- -------- --------
VIS: 58 58000
MIR1: 3260 195600
MIR2: 2559 153540
NIR1: 24 48000
NIR2: 60 120000
NSP1 IF: 9640 964
NSP1 HS: 439 5268
NSP1 DM: 100 10
NSP2 IF: 724 72
NSP2 HS: 52 624
NSP2 DM: 100 10
VSP BM: 241 21690
VSP SM: 20 600
TLP: 0 0
---------- -------- --------
11893 Mbytes
Earthmoon Higher Rate: Last Updated 2009-03-09
There are two possible rates for Earthmoon, 29k and 60k. Comparison between the two is summarized below. Changes are indicated with bold.
Comparison of Earthmoon_60k to Earthmoon_29k: Last Updated 2009-03-09
|
|
Earthmoon_29k |
Earthmoon_60k |
|
Mini-Quicklook ~9 minutes (a) |
||
|
VIS |
0.12 Hz, Total Duration: 60 s |
0.12 Hz, Total Duration: 60 s |
|
NIR1 |
0.3 Hz, Setup, 15s, OPR6, 15s Total Duration: ~30s |
0.3 Hz, Setup, 15s, OPR6, 15s Total Duration: ~30s |
|
NIR2 |
0.3 Hz, Setup, 15s, OPR6, 15s Total Duration: ~30s |
0.3 Hz, Setup, 15s, OPR6, 15s Total Duration: ~30s |
|
MIR1 |
0.07Hz, HiGain, 60s, LoGain, 60s Total Duration: 120s |
0.07Hz, HiGain, 60s, LoGain, 60s Total Duration: 120s |
|
MIR2 |
0.07Hz, HiGain, 60s, LoGain, 60s Total Duration: 120s |
0.07Hz, HiGain, 60s, LoGain, 60s Total Duration: 120s |
|
NSP1 |
IF: 72.2Hz, 30s DM: 145 Hz, 5s |
IF: 72.2Hz, 30s DM: 145 Hz, 5s |
|
NSP2 (a) |
IF: 72.2Hz, 10s |
IF: 72.2Hz, 10s |
|
VSP |
0.2 Hz/int=0.1, 0.5, 2.5s, for 30s 1.3 Hz/int=0.4s, for 20s Duration: ~82s |
0.2 Hz/int=0.1, 0.5, 2.5s, for 30s 1.3 Hz/int=0.4s, for 20s Duration: ~82s |
|
TLP |
Off |
Off |
|
Camera Sleep (during Large Slew to Target) ~ 10 minutes |
||
|
VIS |
0.12 Hz for ~2.5 min Gap for ~2.5 min 0.12 Hz for ~2.5 min Gap for ~2.5 min |
0.23 Hz for ~2.5 min Gap for ~2.5 min 0.23 Hz for ~2.5 min Gap for ~2.5 min |
|
NIR2 |
Gap for 2.5 min 0.12 Hz/AGC:ON for 2.5 min Gap for 2.5 min 0.12Hz/AGC:ON for 2.5 min |
0.23 Hz/AGC:ON for ~2.5 min Gap for ~2.5 min 0.23 Hz/AGC:ON for ~2.5 min Gap for ~2.5 min |
|
MIR2 |
0.07 Hz for 10 min |
0.125 Hz for 10 min |
|
Alignment (Stare, Slew N-S-Center, Stare, Slew E-W-Center, Stare, x2) ~39 minutes |
||
|
VIS |
2 snaps at Position 1,4,7 |
2 snaps at Position 1,4,7 |
|
NIR1 |
2 snaps each at: OPR6 @ Position 1 OPR9 @ Position 4 AGC:ON @ Position 7 |
2 snaps each at: OPR6 @ Position 1 OPR9 @ Position 4 AGC:ON @ Position 7 |
|
NIR2 |
OPR6 @ Position 1 OPR9 @ Position 4 AGC:ON @ Position 7 |
OPR6 @ Position 1 OPR9 @ Position 4 AGC:ON @ Position 7 |
|
MIR1 |
2 snaps per Position 1,4,7 separated by 6s |
2 snaps per Position 1,4,7 separated by 6s |
|
MIR2 |
2 snaps per Position 1,4,7 separated by 6s |
2 snaps per Position 1,4,7 separated by 6s |
|
VSP |
0.1 Hz/int=0.1,0.5,2.5 |
0.16 Hz/int=0.1,0.5,2.5 |
|
NSP1 |
IF: 5Hz during slews (skip 13) (Note there is a 5 Hz IF mode before Position1) HS: 0.425 Hz during stare (skip 3) |
IF: 10Hz during slews (skip 6) (Note there is a 5 Hz IF mode before Position1) HS: 0.85 Hz during stare (skip 2) |
|
NSP2 |
Off |
|
Earthmoon-60k Observation Pattern: Last Updated 2009-03-09
Notes: The pattern above is missing NIR1, MIR1 and NSP2. This is because this sequence was developed on the PL simulator that did not have a complete instrument complement.
Earthmoon-60k Sequence Milestones: Last Updated 2009-03-09
Start Simulation
length: full-length
slot: 6
filename: earthmoon-60k.cmd
msec NVM Msg min:sec
-------- - ---------------------------------------------- -----------
00000000 6 ECHO: Start Sequence (000:00.00)
00000050 6 ECHO: TLM_HSS_RATE :rate 60000 (000:00.05)
00000100 6 ECHO: Mode: EARTHMOON 60 (000:00.10)
00000150 6 ECHO: Mode: VIS (000:00.15)
00060950 6 ECHO: Mode: NIR1 (001:00.95)
00093350 6 ECHO: Mode: NIR2 (001:33.35)
00125750 6 ECHO: Mode: VSP (002:05.75)
00207600 6 ECHO: Mode: MIR1 (003:27.60)
00336300 6 ECHO: Mode: MIR2 (005:36.30)
00465000 6 ECHO: Mode: NSP2 (007:45.00)
00510350 6 ECHO: Mode: NSP1 (008:30.35)
00575700 6 ECHO: Mode: Camera Sleep (009:35.70)
01236700 6 ECHO: Mode: ALIGNMENT (020:36.70)
01239950 6 ECHO: Start: DB1_Earth_Point (020:39.95)
01659950 6 ECHO: Start: 1.5_min_Slew_North_p3 (027:39.95)
01749950 6 ECHO: Start: Pitch_North_p3 (029:09.95)
01750950 6 ECHO: Start: 3_min_Slew_South_p3 (029:10.95)
01929950 6 ECHO: Start: Pitch_South_p3 (032:09.95)
01930950 6 ECHO: Start: 1.5_min_Slew_Earth_Point (032:10.95)
02019950 6 ECHO: Start: DB1_Earth_Point (033:39.95)
02139950 6 ECHO: Start: 1.5_min_Slew_East_p3 (035:39.95)
02229950 6 ECHO: Start: Yaw_East_p3 (037:09.95)
02230950 6 ECHO: Start: 3_min_Slew_West_p3 (037:10.95)
02409950 6 ECHO: Start: Yaw_West_p3 (040:09.95)
02410950 6 ECHO: Start: 1.5_min_Slew_Earth_Point (040:10.95)
02499950 6 ECHO: Start: DB1_Earth_Point (041:39.95)
02619950 6 ECHO: Start: 1.5_min_Slew_North_p3 (043:39.95)
02709950 6 ECHO: Start: Pitch_North_p3 (045:09.95)
02710950 6 ECHO: Start: 3_min_Slew_South_p3 (045:10.95)
02889950 6 ECHO: Start: Pitch_South_p3 (048:09.95)
02890950 6 ECHO: Start: 1.5_min_Slew_Earth_Point (048:10.95)
02979950 6 ECHO: Start: DB1_Earth_Point (049:39.95)
03099950 6 ECHO: Start: 1.5_min_Slew_East_p3 (051:39.95)
03189950 6 ECHO: Start: Yaw_East_p3 (053:09.95)
03190950 6 ECHO: Start: 3_min_Slew_West_p3 (053:10.95)
03369950 6 ECHO: Start: Yaw_West_p3 (056:09.95)
03370950 6 ECHO: Start: 1.5_min_Slew_Earth_Point (056:10.95)
03459950 6 ECHO: Start: DB1_Earth_Point (057:39.95)
03580450 6 ECHO: End Sequence (059:40.45)
--------------------------------
Earthmoon-60k Observation Statistics: Last Updated 2009-03-09
Slot: 6
Filename: earthmoon-60k.cmd
Elapsed Time: 3580550 msec (59.68 min)
PDS Data
Instrument Counts Volume Kbytes
---------- -------- --------
VIS: 94 94000
MIR1: 3260 195600
MIR2: 2592 155520
NIR1: 24 48000
NIR2: 96 192000
NSP1 IF: 16639 1664
NSP1 HS: 567 6804
NSP1 DM: 100 10
NSP2 IF: 724 72
NSP2 HS: 52 624
NSP2 DM: 100 10
VSP BM: 397 35730
VSP SM: 20 600
TLP: 0 0
---------- -------- --------
12084 Mbytes
7.4 Centaur Separation Sequence Guidelines
Assumptions:
· SC slew rate = 0.5 deg/sec
· Possible cold-ops: T<0 C
Primary Goals:
1. Monitor Centaur separation from SC to measure separation and tumble rates
Requirements:
1. Want to image at visible and IR wavelengths as rapidly as possible.
2. Telemetry rate < 220 kbps
Instruments and Specifications:
1. Visible camera running at maximum allowable rate
2. MIR camera (unfiltered) running at maximum allowable rate
3. TLP also on looking for flashes from the Centaur
Rate/Spec Summary:
Vis cam: 5 Hz
NIR1 cam: off
NIR2 cam: off
MIR1 cam: off
MIR2 cam: sample rate = 5 Hz
TLP: 1000 Hz
VSP: off
NSP1: off
NSP2: off
Comparison of Specification to the SEPARATION Sequence:
Last Updated: 2009-03-06
|
|
Specified |
Commanded |
Observed |
Deviations from Spec |
|
VIS |
Rate=5 Hz |
Rate=0.816 Hz |
0.81 Hz Total: 584 (Funct) Total: 632 (ORT6) |
(1) |
|
NIR1 |
Off |
Off |
Off |
|
|
NIR2 |
Off |
Off |
Off |
|
|
MIR1 |
Off |
Off |
Off |
|
|
MIR2 |
Rate=5 Hz |
Rate=0.8 Hz |
0.81 Hz Total: 582 (Funct) Total: 697 (ORT6) |
(1) |
|
NSP1 |
Off |
Off |
Off |
|
|
NSP2 |
Off |
Off |
Off |
|
|
VSP |
Off |
Off |
Off |
|
|
TLP |
Rate=1000 Hz |
Off |
Off |
(2) |
Notes:
[a] In actual flight, the cameras will be kept on until the decision is made to turn them off or 1 hour after power up, whichever comes first. Therefore, the total number of VIS and MIR2 images will alter accordingly.
[b] In actual flight, the VIS camera will be powered on immediately after DHU turn on, but before the separation sequence. VIS is set to run with Rate=0.12 Hz (typical VIS rate for DHU at 29k). Once the S/C rate has been set to 246KHZ (DHU at 220k), then separation-220k is initiated.
Notes (Deviation from Specification):
1. VIS & MIR2 Cannot fit 5 Hz into the bandwidth.
2. The TLP is no longer part (powered) of this sequence. This is to minimize TLP power cycles during mission.
Separation-220k Observation Pattern: Last Updated 2008-04-24
Separation-220k Sequence Milestones: Last Updated 2008-04-24
Start Simulation
length: full-length
slot: 5
filename: separation-220k.cmd
msec NVM Msg min:sec
-------- - ---------------------------------------------- -----------
00000000 5 ECHO: Start Sequence (000:00.00)
00000100 5 ECHO: Mode: SEPARATION 220 (000:00.10)
01236250 5 ECHO: After nominal delay (020:36.25)
--------------------------------
Separation-220k Observation Statistics: Last Updated 2008-04-24
Slot: 5
Filename: separation-220k.cmd
Elapsed Time: 1236350 msec (20.61 min)
PDS Data
Instrument Counts Volume Kbytes
---------- -------- --------
VIS: 1012 1012000
MIR1: 0 0
MIR2: 1002 60120
NIR1: 0 0
NIR2: 0 0
NSP1 IF: 0 0
NSP1 HS: 0 0
NSP1 DM: 0 0
NSP2 IF: 0 0
NSP2 HS: 0 0
NSP2 DM: 0 0
VSP BM: 0 0
VSP SM: 0 0
TLP: 0 0
---------- -------- --------
3016 Mbytes
In actual flight, the cameras will be kept on until the decision is made to turn them off or 1 hour after power up, whichever comes first. Therefore, the total number of VIS and MIR2 images will alter accordingly, as the above simulation is for 20 minutes.
In actual flight, the VIS camera will be powered on immediately after DHU turn on, but before the separation sequence. VIS is set to run with Rate=0.12 Hz (typical VIS rate for DHU at 29k). Once the S/C rate has been set to 246KHZ (DHU at 220k), then separation-220k is initiated. Therefore there are additional VIS images from this early-glimpse period.
Separation Contingency: Last Updated: 2009-03-06
Nominal separation is separation-220k. Rate contingency is separation-58k. Comparison between the baseline and contingency is summarized below.
|
|
Baseline separation-220k |
Contingency separation-58k |
|
VIS |
Rate=0.816 Hz |
Rate= TBR |
|
NIR1 |
Off |
Off |
|
NIR2 |
Off |
Off |
|
MIR1 |
Off |
Off |
|
MIR2 |
Rate=3 Hz |
Rate=TBR |
|
NSP1 |
Off |
Off |
|
NSP2 |
Off |
Off |
|
VSP |
Off |
Off |
|
TLP |
Off |
Off |
Separation Contingency Sequence Milestones: Last Updated: 2009-03-06
<not done yet>
Separation Contingency Observation Statistics: Last Updated: 2009-03-06
<not done yet>
7.5 Preimpact and the final hour of operations
The final hour of the mission contains four mission periods: pre-impact, flash, curtain and crater. These periods are implemented on the DHU via two command sequences, preimpact and impact. The final hour is split into two sequences to facilitate managing anomalies from the ground. Each of these two sequences comes in two versions that differ by bandwidth: preimpact_1000k, preimpact_220k, impact_1000k and impact_220k.
Comparison of Specification to the PREIMPACT Sequence:
|
|
Specified |
Commanded |
Observed (CPT/TVAC) |
Deviations from Spec |
|
VIS |
None given |
Rate=0.816 Hz |
0.82 Hz |
|
|
NIR1 |
None given |
Rate=0.408 Hz ENH:ENABLE OFF |
0.41 Hz |
|
|
NIR2 |
None given |
Rate=0.408 Hz |
0.41 Hz |
|
|
MIR1 |
None given |
Rate=3 Hz |
3.00 Hz |
|
|
MIR2 |
None given |
Rate=3 Hz |
3.00 Hz |
|
|
NSP1 |
None given |
Rate=1.7 Hz |
IF for 155 s then DM for 60 s then |
|
|
NSP2 |
None given |
Rate=1.7 Hz |
IF for 155 s then DM for 60 s then HS @ 1.69 Hz |
|
|
VSP |
None given |
Rate=0.2 Hz |
0.20 Hz |
|
|
TLP |
None given |
Rate=1000 Hz |
(1000 Hz) |
(1) |
Notes (Deviations from Specification):
1. For flight, the TLP is powered on 20 minutes before the start of the impact sequence, not at the beginning of the preimpact sequence. This is achieved within the preimpact-1000k and also by a command from the ground (via the ATS). During instrument testing (CPT/TVAC) the TLP was not exercised within a DHU sequence, only powered separately for aliveness check. End2End testing (2009-02-27) is the only pre-flight test run with the entire correct complement.
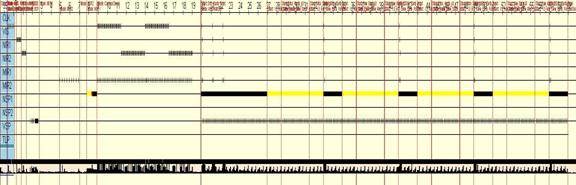
Preimpact-impact-1000k Observational Pattern: Last Updated 2008-04-24
E D C A B
Notes:
(A) Instrument initialization and checkout
(B) Long period of instrument operations in curtain mode
(C) Flash mode
(D) Curtain mode
(E ) Crater mode
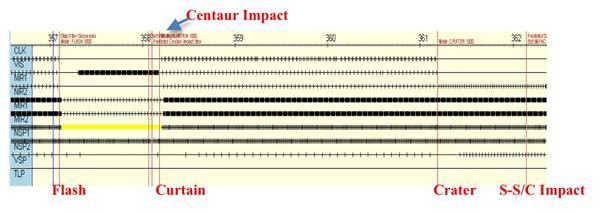
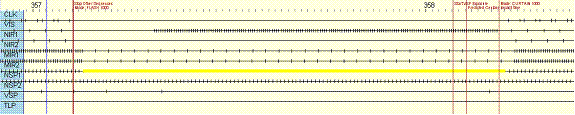
Impact-1000k Observation Pattern: Last Updated 2008-04-24

This figure gives an overview of the impact observation timeline. The beginning of each phase (flash, curtain, crater and S-S/C impact) is shown. (Impact here means impact of the shepherding spacecraft.) Figures below zoom in on each phase.
Preimpact-impact-1000k Sequence Milestones: Last Updated 2009-02-19
Start Simulation
length: full-length
slot: 1
filename: preimpact-1000k.cmd
msec NVM Msg min:sec
-------- - ---------------------------------------------- -----------
00000000 1 ECHO: Start Sequence (000:00.00)
00000050 1 ECHO: ver impact-1000k 2008-11-20 (000:00.05)
00000100 1 ECHO: TLM_HSS_RATE :rate 1000000 (000:00.10)
00002950 1 ECHO: Mode: PREIMPACT 1000 (000:02.95)
00217950 1 ECHO: MODE: PREIMPACT SLEEP (003:37.95)
01747350 1 ECHO: TLP Activated (029:07.35)
02947550 2 ECHO: Stop Other Sequences (049:07.55)
02947650 2 ECHO: Mode: FLASH 1000 (049:07.65)
03004450 2 ECHO: Start VSP Exposure (050:04.45)
03007450 2 ECHO: Predicted Centaur impact time (050:07.45)
03012350 2 ECHO: Mode: CURTAIN 1000 (050:12.35)
03192350 2 ECHO: Mode: CRATER 1000 (053:12.35)
03252350 2 ECHO: Predicted SSC impact time (054:12.35)
03549150 2 ECHO: Exit IMPACT 1000 (059:09.15
Preimpact-impact-1000k Observation Statistics: Last Updated 2009-02-19
Slot: 1
Filename: preimpact-1000k.cmd
Elapsed Time: 3549250 msec (59.15 min)
PDS Data
Instrument Counts Volume Kbytes
---------- -------- --------
VIS: 2531 2531000
MIR1: 10484 629040
MIR2: 10474 628440
NIR1: 1425 2850000
NIR2: 1506 3012000
NSP1 IF: 15991 1599
NSP1 HS: 5556 66672
NSP1 DM: 1202 120
NSP2 IF: 9863 986
NSP2 HS: 5666 67992
NSP2 DM: 1202 120
VSP BM: 797 71730
VSP SM: 0 0
TLP: 14450 144
---------- -------- --------
50518 Mbytes
7.6 Impact/Flash Sequence Guidelines
Flash time frame assumptions:
tau(vis flash) ~ 0.2 sec, T = 0.0 to 0.2 sec
tau(NIR flash) ~ 2.0 sec, T = 0.0 to 2.0 sec
tau(MIR flash) ~ 2.0 sec, T = 0.2 to 4.0 sec
Uncertainty in impact time = +/- 1 sec
Uncertainty in command time = +/- 1 sec
Uncertainty in SC clock time = +/- 1 sec
Total uncertainty = +/-1.7 sec
Need spectrum of flash to fix TLP total power measurements.
Primary Goals:
1. Identify the location of the flash
2. Capture the visible flash
3. Capture the NIR flash
4. Capture the MIR flash
5. Time resolved measurements of the total power of the flash
6. Measure the visible spectrum of the flash
7. Measure the NIR spectrum of the flash
Requirements:
Not written out explicitly in Draft A.
Instruments and Specifications:
1) NIR cam: Satisfies Measurements 1-3
a. Integration time set to > 0.2 seconds to capture entire visible flash while still resolving NIR flash. Would want sampling to be continuous: Rate = 1/0.2 sec = 5 Hz.
b. No filtering (not looking for water ice).
2) MIR cam: Satisfies Measurement 4
a. Sample rate must resolve the ~4 second lifetime: Rate > 1/2.0 = 0.5 Hz.
b. Both cameras, with filtering, as a water vapor plume may be possible.
3) TLP: Satisfies Measurement 5
a. Measurement Rate at 1000 Hz
4) Vis Spec: Satisfies Measurement 6
a. Integration time set to > 0.2 seconds to capture entire vis flash
b. Would want sampling to be continuous: Rate = 1/0.2 sec = 5 Hz.
5) NIR Spec: Satisfies Measurement 7
a. Continuous Nadir measurements in “flash” mode
Rate/Spec Summary:
Vis cam: 0.1 Hz
NIR1 cam: 0.1 Hz, integration = 0.2 sec
NIR2 cam: 5 Hz, integration = 0.2 sec
MIR1 cam: 0.5 Hz, High Gain
MIR2 cam: 0.5 Hz, High Gain
TLP: 1000 Hz
VSP: 5 Hz, integration = 0.2 sec
NSP1: No Decimation, Flash mode
NSP2: No Decimation, Hadamard mode
Comparison of Specification to the FLASH Mode: Last Updated 2009-03-09
|
|
Specified |
Commanded |
Observed |
Observed |
Deviations from Spec |
|
VIS |
Rate=0.1 Hz |
Rate=0 Hz |
Disabled |
Disabled |
(1) |
|
NIR1 |
Rate=0.1 Hz |
Rate=3 Hz OPR=15 (int=16.24 ms) ENH:ENABLE OFF |
2.98 Hz |
2.98 Hz |
(2) (3) |
|
NIR2 |
Rate=5 Hz |
Rate=0 Hz |
Disabled |
Disabled |
(1) |
|
MIR1 |
Rate=0.5 Hz |
Rate=0.5 Hz |
0.50 Hz |
0.50 Hz |
|
|
MIR2 |
Rate=0.5 Hz |
Rate=0.5 Hz |
0.50 Hz |
0.50 Hz |
|
|
NSP1 |
Rate=72 Hz |
Rate=72 Hz |
Flash mode |
Flash mode |
|
|
NSP2 |
Rate=1.7 Hz |
Rate=1.7 Hz |
1.69 Hz |
1.69 Hz |
|
|
VSP |
Rate=5 Hz |
Rate=Two 4s exp. |
2 x 4s exposures |
Triplet 2s,2s,2s exposures |
(4) |
|
TLP |
Rate=1000 Hz |
Rate=1000 Hz |
Not Tested |
1000 Hz |
|
Notes:
1. Multiplexing the VIS, NIR1 and NIR2 cameras greatly reduces the achievable rates. To get a high rate on NIR1, VIS and NIR2 were stopped during flash. Although NIR2 is more sensitive, NIR1 was chosen to allow a longer integration time before saturating.
2. 5 Hz does not fit with appropriate margin in the bandwidth.
3. NIR camera does not support 0.2 s integration times with the currently understood interface.
4. 5 Hz is not achievable with the DHU’s current VSP interface. Decision was made to go for triplet of 2s to cover the expected Centaur-impact time. This was only tested during 2008-12-10 Post Cap and 2009-02-26/27 E2E testing, due to a late delivery of this sequence nuance. All CPT testing prior has two 4s exposures, with a gap in VSP coverage at the beginning of curtain.
FCA
Flash Mode Observational Pattern: Last Updated 2008-04-24
A BB ECA CA DCA Curtain Flash
Notes:
A. The VIS/NIR1/NIR2 camera loop stops and NIR1 starts. Note the unavoidable delay in starting NIR1. NSP1 transitions to flash mode.
B. The tick on the VSP line represents receipt of one 4 second test exposure.
C. The start of the VSP 4 second exposure positioned to cover the impact flash
D. The predicted Centaur impact time
E. The receipt of the VSP packet.
F. Numbers on the clock line represent minutes. Unnumbered ticks represent seconds. Flash mode is approximately 1 minute long.
7.7 Impact/Curtain Sequence Guidelines
Curtain Design Drivers:
At Time After Impact (TAI) = 10 sec
Ejecta cloud optical depth, t = .03
Ejecta Cloud Radius, R = 1 km
Vis Cam dx/pxl = 0.41 km
NIR Cam dx/pxl = 0.92 km
MIR Cam dx/pxl = 0.83 km
Mean (mass weighted) curtain velocity ~125 m/sec
At Time After Impact (TAI) = 60 sec
Ejecta cloud optical depth, t = .02
Ejecta Cloud Radius, R = 10 km
Vis Cam dx/pxl = 0.41 km
NIR Cam dx/pxl = 0.72 km
MIR Cam dx/pxl = 0.65 km
Mean (mass weighted) curtain velocity ~175 m/sec
At Time After Impact (TAI) = 120 sec
Ejecta cloud optical depth, t = .004
Ejecta Cloud Radius, R = 20 km
Vis Cam dx/pxl = 0.21 km
NIR Cam dx/pxl = 0.48 km
MIR Cam dx/pxl = 0.44 km
Mean (mass weighted) curtain velocity ~250 m/sec
Primary Goals:
- Monitor eject curtain to determine composition and properties
- Measure curtain evolution to estimate total ejecta mass
- Monitor eject curtain thermal evolution
- Obtain image pairs in with NIR and MIR cameras
Requirements:
1. Measure ejecta cloud radiance in the UV/Visible at levels between 0.5 and 5 W m-2 mm-1 str-1 (curtain only component) with a contrast ratio of 80 and 8 respectively: VSP integration times should bracket this change in contrast: 0.5 sec with a fact of 4 multiplier gives 0.1<dt<2.5 sec, or a contrast range of 25.
2. Measure ejecta cloud radiance in the NIR at levels between 0.25 and 1 W m-2 mm-1 str-1 (curtain only component at 1.5 mm) with a contrast ratio of 20 and 5 respectively: NSP samples should be undecimated to maximize total number of samples. NIR Camera integration times should bracket this change in contrast: 0.02 (TBR) <dt< 0.08 (TBR) sec, or a contrast range of 4.
3. Image the expansion of the ejecta curtain without blur: visible images once every 2 seconds, NIR/MIR image pairs once every 4 seconds.
4. Resolve the expansion of the ejecta cloud by not allowing ejecta parcels to travel further than ~3 pixels between images
5. Solar viewing NSP (NSP2) kept in view of the sun (+/- 65 degrees) as long as the MGA FOV kept to earth.
Instruments and Specifications:
1. NSP 1 – Hadamard mode, no decimation
2. NSP 2 – Hadamard mode, no decimation
3. VSP in bracket mode: dt = 0.5 sec, factor = 5
4. Visible camera images separated by < 3x(resolution/curtain_velocity) = 3x0.21 km/ 0.25 km/sec = 3x0.8 sec = 2.5 sec (requirement #4 above)
5. NIR cameras with time separation between image pairs (one from each camera) < (resolution/curtain_velocity) = 0.44 km/ 0.25 km/sec = 1.8 sec
6. NIR camera image pairs separated by < 3x(resolution/curtain_velocity) = 5.4 sec (requirement #4 above)
7. MIR cameras with time separation between image pairs (one from each camera) < (resolution/curtain_velocity) = 0.48 km/ 0.25 km/sec = 1.9 sec
8. MIR camera image pairs (image pair period) separated by < 3x(resolution/curtain_velocity) = 5.7 sec
9. TLP, no decimation
Rate/Spec Summary:
Vis cam: 1 Hz
NIR1/NIR2 image pair period: 3 Hz
NIR1 OPR 8 and 15 (TBR)
NIR2 OPR 8 and 15 (TBR)
MIR1/MIR2 image pair period: 3 Hz
MIR1, High Gain
MIR2, High Gain
TLP: 1000 Hz
VSP: Bracket Mode with tau = 0.5 sec, factor = 5
NSP1: No Decimation, Hadamard mode
NSP2: No Decimation, Hadamard mode
Curtain Model Supplementary Figures
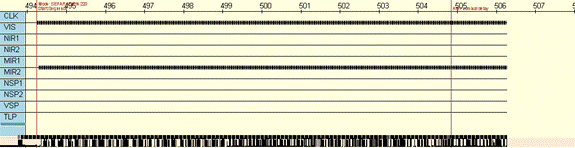
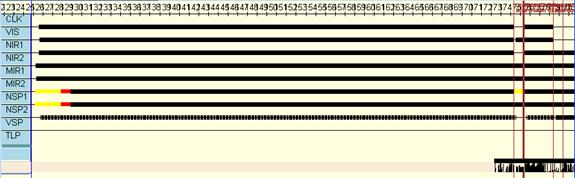
Comparison of Specification to the CURTAIN Mode: Last Updated 2009-03-09
|
|
Specified |
Commanded (CPT) |
Observed (CPT) |
Observed |
Deviations from Spec |
|
VIS |
Rate=1 Hz |
Rate=0.816 Hz |
0.82 Hz |
0.82 Hz |
(1) |
|
NIR1 |
Rate=3 Hz |
Rate=0.408 Hz ENH:ENABLE OFF |
0.41 Hz |
0.41 Hz |
(1) (2) |
|
NIR2 |
Rate=3 Hz |
Rate=0.408 Hz |
0.41 Hz |
0.41 Hz |
(1) (2) |
|
MIR1 |
Rate=3 Hz |
Rate=3 Hz |
3.00 Hz |
3.00 Hz |
|
|
MIR2 |
Rate=3 Hz |
Rate=3 Hz |
3.00 Hz |
3.00 Hz |
|
|
NSP1 |
Rate=1.7 Hz |
Rate=1.7 Hz |
1.69 Hz |
1.69 Hz |
|
|
NSP2 |
Rate=1.7 Hz |
Rate=1.7 Hz |
1.69 Hz |
1.69 Hz |
|
|
VSP |
Rate=? |
Rate=0.2 Hz |
0.20 Hz |
0.20 Hz |
(3) |
|
TLP |
Rate=1000 Hz |
Rate=1000 Hz |
Not Tested |
1000k |
(4) |
Notes:
1. VIS at 1Hz + NIR1 at 3Hz + NIR2 at 3 Hz, does not fit within the available bandwidth with suitable margin.
2. Sensitivity (exposure time) for NIRs is a placeholder based on radiometric calibration. Desire NIR1 and NIR2 to maintain the same OPR setting to simplify image differencing.
3. No specification in rate was given for VSP. The rate of 0.2 Hz is the fastest the DHU can reliably drive the VSP in bracket mode for the above integration times. Note the VSP could go ~30% faster, but the interface between it and the DHU is prone to synchronization errors.
4. TLP is powered off at the beginning of Crater.
Curtain Mode Observational Pattern: Last Updated 2008-04-28
C B A
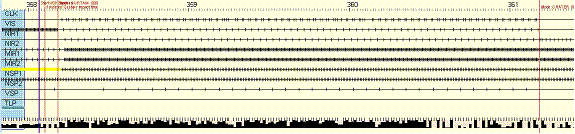
Detail showing transition from flash to curtain (clock ticks
indicate seconds):
Last Updated 2008-04-28
G H F D E
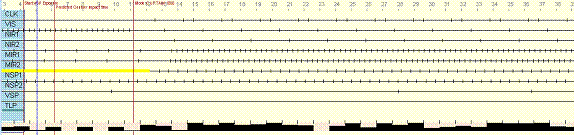
Detail showing variation in image time stamping:
Last Updated 2008-04-28
J I
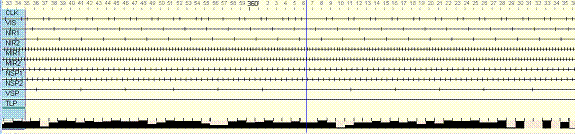
Notes:
A. Predicted Centaur impact time
B. Transition to curtain mode
C. Transition to crater mode
D. Predicted Centaur impact time (in the detail view)
E. Transition to curtain mode, 5 seconds after the predicted impact time to account for prediction and execution errors.
F. First VSP packet timestamped, 6.325 seconds after the transition to curtain.
G. This is a bracket mode packet; the first exposure starts at approximately G, 6 seconds after the transition and 11 seconds after the predicted Centaur impact time.
H. The more important transition of NSP1 from Flash mode back to Hadamard spectrum mode.
I. Marks a triple cluster of ticks. One of the pair following the triple has moved earlier to join another pair. This is an open action item; the underlying cause isn’t clear. We have not decided on a strategy to correct for it or whether to leave it uncorrected.
7.8 Impact/Crater Sequence GuidelineS
Crater Design Drivers:
Centaur crater diameter ~20 meters
Interior crater temperatures 180 seconds after Centaur impact >200 K
Primary Goals:
1. Image Centaur impact crater
2. Improve identification of impact crater location
3. Monitor ejecta cloud with side viewing spectrometer for composition and particle properties
Requirements:
1. Image Centaur impact point and surrounding terrain out to a distance of 15 km
2. Image crater in the thermal IR:>1 pixels across crater: <20 meter/pixel resolution
Instruments and Specifications:
1. MIR camera pixel resolution <20 meters/pixel (meets requirement #1)
2. MIR and NIR camera imaging of Centaur impact point at an altitude of 150 km (meets requirement #2)
3. NSP2 observations from 150 km to surface in Hadamard mode
Rate/Spec Summary:
Vis cam: 0.25 Hz
NIR1 cam: 0.25 Hz
NIR2 cam: 0.5 Hz
MIR1 cam: 0.25 Hz, High Gain
MIR2 cam: 0.5 Hz, High Gain
TLP: 1000 Hz
VSP: Bracket Mode with tau = 0.2 sec, factor = 2
NSP1: No Decimation, Hadamard mode
Comparison of Specification to the CRATER Mode: Last Updated 2009-03-19
|
|
Specified |
Commanded |
Observed (CPT) |
Observed |
Deviations from Spec |
|
VIS |
Rate=0.25 Hz |
Rate=0 Hz |
Rate=0 Hz |
Rate=0 Hz |
(1) |
|
NIR1 |
Rate=0.25Hz |
Rate=0 Hz |
Rate=0 Hz |
Rate=0 Hz |
(1) |
|
NIR2 |
Rate=0.5 Hz |
Rate=0.66 Hz |
0.67 Hz |
0.67 Hz |
(1) (2) |
|
MIR1 |
Rate= 0.25 Hz |
Rate=3 Hz |
3.00 Hz |
3.00 Hz |
(1) |
|
MIR2 |
Rate= 0.5 Hz |
Rate=3 Hz |
3.00 Hz |
3.00 Hz |
(1) |
|
NSP1 |
Rate=1.7 Hz |
Rate=1.7 Hz |
1.70 Hz |
1.70 Hz |
|
|
NSP2 |
Rate=1.7 Hz |
Rate=1.7 Hz |
1.70 Hz |
1.70 Hz |
|
|
VSP |
Rate=? |
Rate=0.5 Hz |
0.50 Hz |
0.50 Hz |
(3) |
|
TLP |
Rate=1000 Hz |
Off |
Not Tested |
Off |
(4) |
Notes:
1. To emphasize the MIR imagery during this phase, they are placed at a max rate, with VIS and NIR1 not used. NIR2 camera can fit in at 0.66 Hz within the model.
2. NIR2 set to max sensitivity for this last minute. Currently parameterized as OPR 15 (16.24 ms).
3. No specification in rate was given for VSP. The rate of 0.52 Hz is the fastest the DHU can reliably drive the VSP in bracket mode for the above integration times.
4. TLP is powered off within CRATER to save bandwidth.
Crater Mode Observational Pattern: Last Updated 2008-04-28
B C A D
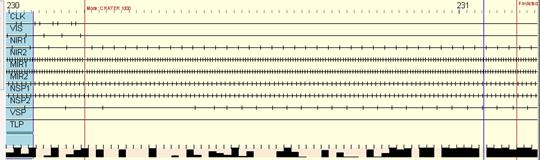
Notes for the timeline:
A. Start of crater mode
B. Shepherding spacecraft impact
C. Dropped image (image decompression error)
D. Transition delay between VSP modes
Crater Model Supplementary Figures:
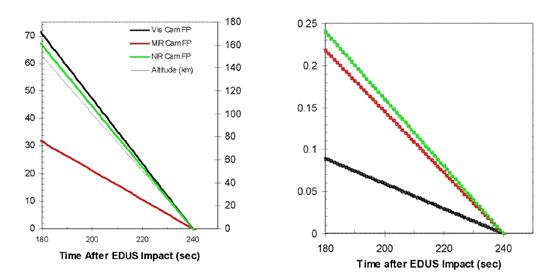
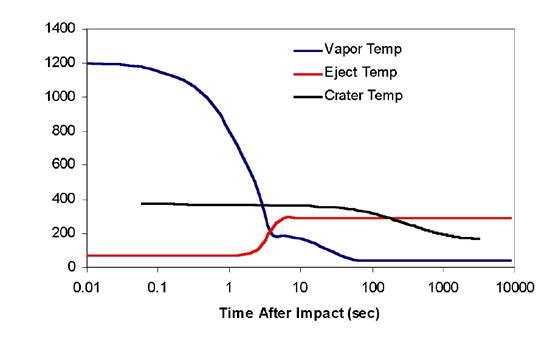
Preimpact-Impact Contingency: Last Updated: 2009-03-09
Nominal preimpact-impact is preimpact-impact-1000k. Rate contingency is preimpact-impact-220k. Comparison between the baseline and contingency is summarized below.
|
|
Baseline preimpact-1000k |
Contingency preimpact-220k |
|
VIS |
0.82 Hz |
0.119 Hz |
|
NIR1 |
0.41 Hz |
0.119 Hz |
|
NIR2 |
0.41 Hz |
0.119 Hz |
|
MIR1 |
3.00 Hz |
0.15 Hz |
|
MIR2 |
3.00 Hz |
0.15 Hz |
|
NSP1 |
IF for 155 s then DM for 60 s then |
IF for 155 s then DM for 60 s then |
|
NSP2 |
IF for 155 s then DM for 60 s then HS @ 1.72 Hz |
IF for 155 s then DM for 60 s then HS @ 1.72 Hz |
|
VSP |
0.20 Hz, 100ms, 500ms, 2500ms |
0.20 Hz, 100ms, 500ms, 2500ms |
|
TLP |
1000 Hz [21 min before FLASH] |
1000 Hz [21 min before FLASH] |
|
|
Baseline impact-1000k |
Contingency impact-220k |
|
|
FLASH |
FLASH |
|
VIS |
Disabled |
Disabled |
|
NIR1 |
2.98 Hz, OPR15 |
0.5 Hz, OPR15 |
|
NIR2 |
Disabled |
Disabled |
|
MIR1 |
0.50 Hz, Hi Gain |
0.10 Hz, Hi Gain |
|
MIR2 |
0.50 Hz, Hi Gain |
0.10 Hz, Hi Gain |
|
NSP1 |
Flash mode |
Flash Mode |
|
NSP2 |
Hadamard mode, 1.72 Hz |
Hadamard mode, 1.72 Hz |
|
VSP |
Triplet 2s,2s,2s exposures |
Triplet 2s,2s,2s exposures |
|
TLP |
1000 Hz |
1000 Hz |
|
|
CURTAIN |
CURTAIN |
|
VIS |
0.82 Hz |
0.119 Hz |
|
NIR1 |
0.41 Hz, OPR 6 |
0.119 Hz, OPR 6 |
|
NIR2 |
0.41 Hz, OPR 6 |
0.119 Hz, OPR 6 |
|
MIR1 |
3.00 Hz, Hi Gain |
0.15 Hz, Hi Gain |
|
MIR2 |
3.00 Hz, Hi Gain |
0.15 Hz, Hi Gain |
|
NSP1 |
Hadamard mode, 1.72 Hz |
Hadamard mode, 1.72 Hz |
|
NSP2 |
Hadamard mode, 1.72 Hz |
Hadamard mode, 1.72 Hz |
|
VSP |
0.20 Hz, 100ms, 500ms, 2500ms |
0.20 Hz, 100ms, 500ms, 2500ms |
|
TLP |
1000k |
|
|
|
CRATER |
CRATER |
|
VIS |
Disabled |
Disabled |
|
NIR1 |
Disabled |
Disabled |
|
NIR2 |
0.67 Hz, OPR15 |
0.1 Hz, OPR15 |
|
MIR1 |
3.00 Hz, Hi Gain |
0.6 Hz, Hi Gain |
|
MIR2 |
3.00 Hz, Hi Gain |
0.6 Hz, Hi Gain |
|
NSP1 |
Hadamard mode, 1.72 Hz |
Hadamard mode, 1.72 Hz |
|
NSP2 |
Hadamard mode, 1.72 Hz |
Hadamard mode, 1.72 Hz |
|
VSP |
0.50 Hz, 100ms,200ms,400ms |
0.50 Hz, 100ms,200ms,400ms |
|
TLP |
Off |
|
Preimpact-Impact-220k Sequence Milestones: Last Updated: 2009-03-09
Start Simulation
length: full-length
slot: 7
filename: preimpact-220k.cmd
msec NVM Msg min:sec
-------- - ---------------------------------------------- -----------
00000000 7 ECHO: Start Sequence (000:00.00)
00000050 7 ECHO: ver impact-220k 2008-11-20 (000:00.05)
00000100 7 ECHO: TLM_HSS_RATE :rate 220000 (000:00.10)
00002950 7 ECHO: Mode: PREIMPACT 220 (000:02.95)
00217950 7 ECHO: MODE: PREIMPACT SLEEP (003:37.95)
01747350 7 ECHO: TLP Activated (029:07.35)
02947550 8 ECHO: Stop Other Sequences (049:07.55)
02947650 8 ECHO: Mode: FLASH 220 (049:07.65)
03004450 8 ECHO: Start VSP Exposure (050:04.45)
03007450 8 ECHO: Predicted Centaur impact time (050:07.45)
03012350 8 ECHO: Mode: CURTAIN 220 (050:12.35)
03192350 8 ECHO: Mode: CRATER 220 (053:12.35)
03252350 8 ECHO: Predicted SSC impact time (054:12.35)
03549150 8 ECHO: Exit IMPACT 220 (059:09.15)
Preimpact-Impact-220k Observation Statistics: Last Updated: 2009-03-09
Slot: 7
Filename: preimpact-220k.cmd
Elapsed Time: 3549250 msec (59.15 min)
PDS Data
Instrument Counts Volume Kbytes
---------- -------- --------
VIS: 396 396000
MIR1: 694 41640
MIR2: 695 41700
NIR1: 423 846000
NIR2: 432 864000
NSP1 IF: 15991 1599
NSP1 HS: 5556 66672
NSP1 DM: 1202 120
NSP2 IF: 9863 986
NSP2 HS: 5666 67992
NSP2 DM: 1202 120
VSP BM: 797 71730
VSP SM: 0 0
TLP: 14450 144
---------- -------- --------
5093 Mbytes
7.9 Fault Guidelines
Primary Goals:
1. Provide for key science mode observation in case of inability to command.
Requirements:
1. Must be able to run without ground intervention
2. Must power all instruments (incl. TLP) and ensure TADA is open
Instruments and Specifications:
1. Same as for Curtain-1000k
Rate/Spec Summary:
1. Same as for Curtain-1000k
Fault-1000k Observational Pattern:
<Not generated. Equivalent to the Curtain portion of the sequence except for the startup transient.>
Fault-1000k Sequence Milestones: Last Updated: 2009-03-09
Start Simulation
length: full-length
slot: 0
filename: fault-1000k.cmd
msec NVM Msg min:sec
-------- - ---------------------------------------------- -----------
00000000 0 ECHO: Start Sequence (000:00.00)
00010100 0 ECHO: Mode: FAULT 1000 (000:10.10)
00600000 0 ECHO: Activate the TLP (010:00.00)
00610100 0 ECHO: Activate TADA (010:10.10)
00621250 0 ECHO: Exit FAULT 1000 (010:21.25)
--------------------------------
8 Post-contact status reports
After each payload activation, the payload team will be responsible for generating a summary of the payload performance for the mission status briefing. Raw inputs to this summary will be the command sequence checklist and the following telemetry reports:
- Payload Environment Report, which includes
- R6 temperatures
- Payload internal temperatures
- Payload voltage and current
- S/C payload telemetry stats
2. Payload operations report, which includes
- Timeline charts
- Downlink margin (expected & actual)
- NIR OPR settings reported
- NIR commanding error counts
- Clock synchronization performance
- Anomaly list
9 Remaining Work
All prelaunch tuning of the payload command sequences has been finished. If analysis of on-orbit instrument performance indicates that instrument settings should be adjusted for impact observations, then the sequences may be changed slightly and reloaded.
10 Instrument Command Sequences as Run
This section contains plots and statistics for each data collection period.
QUICKLOOK
Summary: No problems
Data Collection Plot:
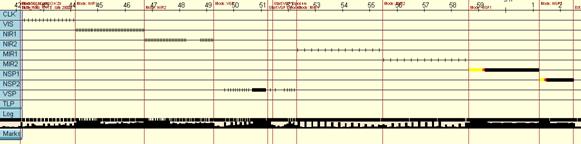
Timestamps of sequence milestones:
2428185096 ccsds_downlink_command(): echoing "Start Sequence"
2428185149 ccsds_downlink_command(): echoing "TLM_HSS_RATE :rate 29000"
2428185199 ccsds_downlink_command(): echoing "Mode: QUICKLOOK 29"
2428185249 ccsds_downlink_command(): echoing "Mode: VIS"
2428306101 ccsds_downlink_command(): echoing "Mode: NIR1"
2428458953 ccsds_downlink_command(): echoing "Mode: NIR2"
2428611806 ccsds_downlink_command(): echoing "Mode: VSP"
2428731608 ccsds_downlink_command(): echoing "Start VSP Exposure"
2428741708 ccsds_downlink_command(): echoing "Start VSP Exposure"
2428795159 ccsds_downlink_command(): echoing "Mode: MIR1"
2428984862 ccsds_downlink_command(): echoing "Mode: MIR2"
2429174565 ccsds_downlink_command(): echoing "Mode: NSP1"
2429329917 ccsds_downlink_command(): echoing "Mode: NSP2"
2429405268 ccsds_downlink_command(): echoing "Exit QUICKLOOK 29"
Data collected during sequence phases
timestamp message NSP1---------+ NSP2---------+ VSP----------+
VCB VIS NIR1 NIR2 MIR1 MIR2 HS1 IF1 DM1 HS2 IF2 DM2 CNT SM BM TLP
000000564 Start Sequence" 0 0 0 0 0 0 0 0 0 0 0 0 1 0 0 0
2428185660 Start Sequence" 0 0 0 0 0 0 0 0 0 0 0 0 0 0 0 0
2428185713 TLM_HSS_RATE :rate 2 0 0 0 0 0 0 0 0 0 0 0 0 0 0 0 0
2428185763 Mode: QUICKLOOK 29" 0 0 0 0 0 0 0 0 0 0 0 0 0 0 0 0
2428185813 Mode: VIS" 15 15 0 0 0 0 0 0 0 0 0 0 0 0 0 0
2428306665 Mode: NIR1" 46 0 46 0 0 0 0 0 0 0 0 0 0 0 0 0
2428459517 Mode: NIR2" 46 0 0 46 0 0 0 0 0 0 0 0 0 0 0 0
2428612370 Mode: VSP" 0 0 0 0 0 0 0 0 0 0 0 0 65 42 11 0
2428732172 Start VSP Exposure" 0 0 0 0 0 0 0 0 0 0 0 0 0 0 0 0
2428742272 Start VSP Exposure" 0 0 0 0 0 0 0 0 0 0 0 0 11 1 5 0
2428795723 Mode: MIR1" 0 0 0 0 260 0 0 0 0 0 0 0 1 0 0 0
2428985426 Mode: MIR2" 0 0 0 0 0 260 0 0 0 0 0 0 0 0 0 0
2429175129 Mode: NSP1" 0 0 0 0 0 0 203 2167 709 0 1 0 0 0 0 0
2429330481 Mode: NSP2" 0 0 0 0 0 0 0 0 0 101 721 689 0 0 0 0
2429405832 Exit QUICKLOOK 29" 107 15 46 46 260 260 203 2167 709 101 722 689 78 43 16 0
STARFIELD
Summary: No problems
Data Collection Plot:
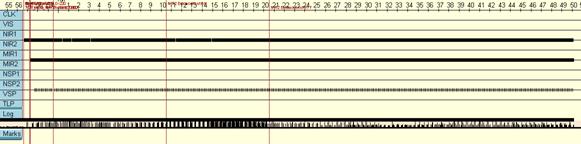
Timestamps of sequence milestones:
2648655059 ccsds_downlink_command(): echoing "Start Sequence"
2648655110 ccsds_downlink_command(): echoing "TLM_HSS_RATE :rate 220000"
2648655160 ccsds_downlink_command(): echoing "Mode: STARFIELD-220"
2648688661 ccsds_downlink_command(): echoing "Turn on MIR2"
2648693011 ccsds_downlink_command(): echoing "Turn on VSP"
2648825363 ccsds_downlink_command(): echoing "Activate TADA"
2649487624 ccsds_downlink_command(): echoing "NIR2 Enhancement ON"
2650087784 ccsds_downlink_command(): echoing "NIR2 Enhancement OFF"
Data collected during sequence phases
timestamp message NSP1---------+ NSP2---------+ VSP----------+
VCB VIS NIR1 NIR2 MIR1 MIR2 HS1 IF1 DM1 HS2 IF2 DM2 CNT SM BM TLP
000000564 Start Sequence" 0 0 0 0 0 0 0 0 0 0 0 0 1 0 0 0
2648655623 Start Sequence" 0 0 0 0 0 0 0 0 0 0 0 0 0 0 0 0
2648655674 TLM_HSS_RATE :rate 2 0 0 0 0 0 0 0 0 0 0 0 0 0 0 0 0
2648655724 Mode: STARFIELD-220" 16 0 0 16 0 0 0 0 0 0 0 0 0 0 0 0
2648689225 Turn on MIR2" 2 0 0 2 0 20 0 0 0 0 0 0 0 0 0 0
2648693575 Turn on VSP" 66 0 0 66 0 1320 0 0 0 0 0 0 19 14 0 0
2648825927 Activate TADA" 331 0 0 331 0 6620 0 0 0 0 0 0 83 83 0 0
2649488188 NIR2 Enhancement ON" 299 0 0 299 0 5994 0 0 0 0 0 0 75 75 0 0
2650088348 NIR2 Enhancement OFF 714 0 0 714 0 13954 0 0 0 0 0 0 178 172 0 0
SWINGBY
Summary: Successfully collected data for instrument calibration; bandwidth oversubscription observed.
Data Collection Plot:
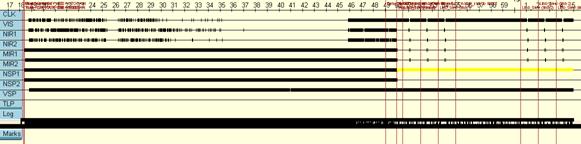
Timestamps of sequence milestones:
2721957170 ccsds_downlink_command(): echoing "Start Sequence"
2721957221 ccsds_downlink_command(): echoing "TLM_HSS_RATE :rate 1000000"
2721957271 ccsds_downlink_command(): echoing "Mode: SWINGBY 1000 AUTOGAIN"
2721959176 ccsds_downlink_command(): echoing "Mode: CURTAIN 1000 AUTOGAIN"
2723799149 ccsds_downlink_command(): echoing "Swingby-1000k-ground ran off the end"
2723857102 ccsds_downlink_command(): echoing "Stop Other Sequences"
2723857205 ccsds_downlink_command(): echoing "Mode: Limb1_out"
2723887206 ccsds_downlink_command(): echoing "Limb_Slew (limb 1)"
2723977207 ccsds_downlink_command(): echoing "Limb_Slew (limb 1)"
2724067208 ccsds_downlink_command(): echoing "Limb_Slew (limb 1)"
2724157210 ccsds_downlink_command(): echoing "5_minute_slew to limb 2"
2724487215 ccsds_downlink_command(): echoing "Limb_Slew (limb 2)"
2724577216 ccsds_downlink_command(): echoing "Limb_Slew (limb 2)"
2724667218 ccsds_downlink_command(): echoing "Limb_Slew (limb 2)"
Data collected during sequence phases
timestamp message NSP1---------+ NSP2---------+ VSP----------+
VCB VIS NIR1 NIR2 MIR1 MIR2 HS1 IF1 DM1 HS2 IF2 DM2 CNT SM BM TLP
000000565 Start Sequence" 0 0 0 0 0 0 0 0 0 0 0 0 1 0 0 0
2721957735 Start Sequence" 0 0 0 0 0 0 0 0 0 0 0 0 0 0 0 0
2721957786 TLM_HSS_RATE :rate 1 0 0 0 0 0 0 0 0 0 0 0 0 0 0 0 0
2721957836 Mode: SWINGBY 1000 A 0 0 0 0 0 0 0 0 0 0 1 0 1 0 0 0
2721959741 Mode: CURTAIN 1000 A 870 331 294 245 110157 106839 3118 0 0 3118 0 0 915 0 908 0
2723799714 Swingby-1000k-ground 92 46 23 23 3463 3489 99 0 0 98 0 0 29 0 29 0
2723857667 Stop Other Sequences 0 0 0 0 0 0 0 0 0 0 0 0 0 0 0 0
2723857770 Mode: Limb1_out" 99 99 0 0 80 81 3 2048 0 2 0 0 15 0 15 0
2723887771 Limb_Slew (limb 1)" 277 273 2 2 40 40 0 6503 0 0 0 0 45 0 45 0
2723977772 Limb_Slew (limb 1)" 278 274 2 2 40 40 0 6510 0 0 0 0 45 0 45 0
2724067773 Limb_Slew (limb 1)" 279 275 2 2 40 40 0 6518 0 0 0 0 45 0 45 0
2724157775 5_minute_slew to lim 1098 1098 0 0 0 0 0 23865 0 0 0 0 165 0 165 0
2724487780 Limb_Slew (limb 2)" 278 274 2 2 40 40 0 6511 0 0 0 0 45 0 45 0
2724577781 Limb_Slew (limb 2)" 278 274 2 2 40 40 0 6510 0 0 0 0 45 0 45 0
2724667783 Limb_Slew (limb 2)" 3549 2944 327 278 113900 110609 3220 58465 0 3218 1 0 1351 0 1342 0
EARTHLOOK1
Summary: No problems
Data Collection Plot:
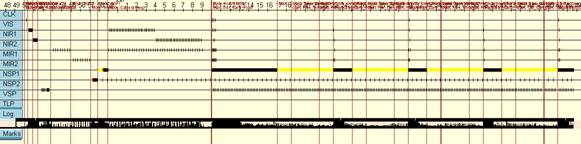
Timestamps of sequence milestones:
1830889765 ccsds_downlink_command(): echoing "Start Sequence"
1830889816 ccsds_downlink_command(): echoing "TLM_HSS_RATE :rate 29000"
1830889866 ccsds_downlink_command(): echoing "Mode: EARTHLOOK 29"
1830889916 ccsds_downlink_command(): echoing "Mode: VIS"
1830910716 ccsds_downlink_command(): echoing "Mode: NIR1"
1830943116 ccsds_downlink_command(): echoing "Mode: NIR2"
1830975517 ccsds_downlink_command(): echoing "Mode: VSP"
1831057368 ccsds_downlink_command(): echoing "Mode: MIR1"
1831186070 ccsds_downlink_command(): echoing "Mode: MIR2"
1831314771 ccsds_downlink_command(): echoing "Mode: NSP2"
1831360122 ccsds_downlink_command(): echoing "Mode: NSP1"
1831425473 ccsds_downlink_command(): echoing "Mode: Camera Sleep"
1832086532 ccsds_downlink_command(): echoing "Mode: ALIGNMENT"
1832089782 ccsds_downlink_command(): echoing "Start: DB1_Earth_Point"
1832509788 ccsds_downlink_command(): echoing "Start: 1.5_min_Slew_North_p3"
1832599790 ccsds_downlink_command(): echoing "Start: Pitch_North_p3"
1832600790 ccsds_downlink_command(): echoing "Start: 3_min_Slew_South_m3"
1832779792 ccsds_downlink_command(): echoing "Start: Pitch_South_m3"
1832780792 ccsds_downlink_command(): echoing "Start: 1.5_min_Slew_Earth_Point"
1832869793 ccsds_downlink_command(): echoing "Start: DB1_Earth_Point"
1832989795 ccsds_downlink_command(): echoing "Start: 1.5_min_Slew_East_p3"
1833079797 ccsds_downlink_command(): echoing "Start: Yaw_East_p3"
1833080797 ccsds_downlink_command(): echoing "Start: 3_min_Slew_West_m3"
1833259799 ccsds_downlink_command(): echoing "Start: Yaw_West_m3"
1833260799 ccsds_downlink_command(): echoing "Start: 1.5_min_Slew_Earth_Point"
1833348725 ccsds_downlink_command(): echoing "Start: DB1_Earth_Point"
1833469802 ccsds_downlink_command(): echoing "Start: 1.5_min_Slew_North_p3"
1833559804 ccsds_downlink_command(): echoing "Start: Pitch_North_p3"
1833560804 ccsds_downlink_command(): echoing "Start: 3_min_Slew_South_m3"
1833739806 ccsds_downlink_command(): echoing "Start: Pitch_South_m3"
1833740806 ccsds_downlink_command(): echoing "Start: 1.5_min_Slew_Earth_Point"
1833829808 ccsds_downlink_command(): echoing "Start: DB1_Earth_Point"
1833949809 ccsds_downlink_command(): echoing "Start: 1.5_min_Slew_East_p3"
1834039811 ccsds_downlink_command(): echoing "Start: Yaw_East_p3"
1834040811 ccsds_downlink_command(): echoing "Start: 3_min_Slew_West_m3"
1834219813 ccsds_downlink_command(): echoing "Start: Yaw_West_m3"
1834220813 ccsds_downlink_command(): echoing "Start: 1.5_min_Slew_Earth_Point"
1834309815 ccsds_downlink_command(): echoing "Start: DB1_Earth_Point"
Data collected during sequence phases
timestamp message NSP1---------+ NSP2---------+ VSP----------+
VCB VIS NIR1 NIR2 MIR1 MIR2 HS1 IF1 DM1 HS2 IF2 DM2 CNT SM BM TLP
000000565 Start Sequence" 0 0 0 0 0 0 0 0 0 0 0 0 1 0 0 0
1830890330 Start Sequence" 0 0 0 0 0 0 0 0 0 0 0 0 0 0 0 0
1830890381 TLM_HSS_RATE :rate 2 0 0 0 0 0 0 0 0 0 0 0 0 0 0 0 0
1830890431 Mode: EARTHLOOK 29" 0 0 0 0 0 0 0 0 0 0 0 0 0 0 0 0
1830890481 Mode: VIS" 2 2 0 0 0 0 0 0 0 0 0 0 0 0 0 0
1830911281 Mode: NIR1" 9 0 9 0 0 0 0 0 0 0 0 0 0 0 0 0
1830943681 Mode: NIR2" 9 0 1 8 0 0 0 0 0 0 0 0 0 0 0 0
1830976082 Mode: VSP" 2 0 0 2 0 0 0 0 0 0 0 0 38 20 5 0
1831057933 Mode: MIR1" 0 0 0 0 180 0 0 0 0 0 0 0 0 0 0 0
1831186635 Mode: MIR2" 0 0 0 0 0 180 0 0 0 0 0 0 0 0 0 0
1831315336 Mode: NSP2" 0 0 0 0 0 0 0 0 0 50 721 667 0 0 0 0
1831360687 Mode: NSP1" 0 0 0 0 0 0 50 2167 664 2 0 0 0 0 0 0
1831426038 Mode: Camera Sleep" 64 0 32 32 820 0 0 0 0 22 0 0 0 0 0 0
1832087097 Mode: ALIGNMENT" 0 0 0 0 0 0 0 13 0 0 0 0 0 0 0 0
1832090347 Start: DB1_Earth_Poi 15 6 5 4 120 120 177 3 0 14 0 0 42 0 42 0
1832510353 Start: 1.5_min_Slew_ 0 0 0 0 0 0 1 459 0 3 0 0 9 0 9 0
1832600355 Start: Pitch_North_p 0 0 0 0 0 0 0 5 0 0 0 0 0 0 0 0
1832601355 Start: 3_min_Slew_So 0 0 0 0 0 0 0 925 0 6 0 0 18 0 18 0
1832780357 Start: Pitch_South_m 0 0 0 0 0 0 0 5 0 0 0 0 0 0 0 0
1832781357 Start: 1.5_min_Slew_ 0 0 0 0 0 0 0 461 0 3 0 0 9 0 9 0
1832870358 Start: DB1_Earth_Poi 6 2 2 2 40 40 50 2 0 4 0 0 12 0 12 0
1832990360 Start: 1.5_min_Slew_ 0 0 0 0 0 0 1 462 0 3 0 0 9 0 9 0
1833080362 Start: Yaw_East_p3" 0 0 0 0 0 0 0 5 0 0 0 0 0 0 0 0
1833081362 Start: 3_min_Slew_We 0 0 0 0 0 0 0 925 0 6 0 0 18 0 18 0
1833260364 Start: Yaw_West_m3" 0 0 0 0 0 0 0 5 0 0 0 0 0 0 0 0
1833261364 Start: 1.5_min_Slew_ 0 0 0 0 0 0 0 459 0 3 0 0 9 0 9 0
1833349290 Start: DB1_Earth_Poi 6 2 2 2 40 40 50 2 0 4 0 0 12 0 12 0
1833470367 Start: 1.5_min_Slew_ 0 0 0 0 0 0 1 462 0 3 0 0 9 0 9 0
1833560369 Start: Pitch_North_p 0 0 0 0 0 0 0 5 0 0 0 0 0 0 0 0
1833561369 Start: 3_min_Slew_So 0 0 0 0 0 0 0 925 0 6 0 0 18 0 18 0
1833740371 Start: Pitch_South_m 0 0 0 0 0 0 0 5 0 0 0 0 0 0 0 0
1833741371 Start: 1.5_min_Slew_ 0 0 0 0 0 0 0 459 0 3 0 0 9 0 9 0
1833830373 Start: DB1_Earth_Poi 6 2 2 2 40 40 51 3 0 4 0 0 12 0 12 0
1833950374 Start: 1.5_min_Slew_ 0 0 0 0 0 0 0 461 0 3 0 0 9 0 9 0
1834040376 Start: Yaw_East_p3" 0 0 0 0 0 0 0 5 0 0 0 0 0 0 0 0
1834041376 Start: 3_min_Slew_We 0 0 0 0 0 0 0 925 0 6 0 0 18 0 18 0
1834220378 Start: Yaw_West_m3" 0 0 0 0 0 0 0 5 0 0 0 0 0 0 0 0
1834221378 Start: 1.5_min_Slew_ 0 0 0 0 0 0 0 461 0 3 0 0 9 0 9 0
1834310380 Start: DB1_Earth_Poi 119 14 53 52 1240 420 381 9614 664 148 721 667 261 20 227 0
MIRLOOK
Summary: No problems
Data Collection Plot:
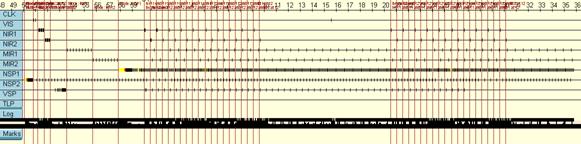
Timestamps of sequence milestones:
3162890840 ccsds_downlink_command(): echoing "Start Sequence"
3162890892 ccsds_downlink_command(): echoing "TLM_HSS_RATE :rate 29000"
3162890942 ccsds_downlink_command(): echoing "Mode: MIRLOOK 29"
3162890992 ccsds_downlink_command(): echoing "Mode: NSP2"
3162936342 ccsds_downlink_command(): echoing "Mode: VIS"
3162957142 ccsds_downlink_command(): echoing "Mode: NIR1"
3162989543 ccsds_downlink_command(): echoing "Mode: NIR2"
3163021943 ccsds_downlink_command(): echoing "Mode: VSP"
3163103794 ccsds_downlink_command(): echoing "Mode: MIR1"
3163232496 ccsds_downlink_command(): echoing "Mode: MIR2"
3163361198 ccsds_downlink_command(): echoing "Mode: NSP1"
3163490850 ccsds_downlink_command(): echoing "Begin Stare 1"
3163490900 ccsds_downlink_command(): echoing "NIR1 at 3"
3163520900 ccsds_downlink_command(): echoing "NIR2 at 3"
3163550901 ccsds_downlink_command(): echoing "NIR1 at 5"
3163580901 ccsds_downlink_command(): echoing "NIR2 at 5"
3163610821 ccsds_downlink_command(): echoing "NIR1 at 7"
3163640902 ccsds_downlink_command(): echoing "NIR2 at 7"
3163670902 ccsds_downlink_command(): echoing "NIR1 at 9"
3163700903 ccsds_downlink_command(): echoing "NIR2 at 9"
3163730903 ccsds_downlink_command(): echoing "NIR1 at 11"
3163760904 ccsds_downlink_command(): echoing "NIR2 at 11"
3163795904 ccsds_downlink_command(): echoing "NIR1 at 4"
3163825905 ccsds_downlink_command(): echoing "NIR2 at 4"
3163855905 ccsds_downlink_command(): echoing "NIR1 at 6"
3163885905 ccsds_downlink_command(): echoing "NIR2 at 6"
3163915906 ccsds_downlink_command(): echoing "NIR1 at 8"
3163945906 ccsds_downlink_command(): echoing "NIR2 at 8"
3163975907 ccsds_downlink_command(): echoing "NIR1 at 10"
3164005907 ccsds_downlink_command(): echoing "NIR2 at 10"
3164035908 ccsds_downlink_command(): echoing "NIR1 at 12"
3164065908 ccsds_downlink_command(): echoing "NIR2 at 12"
3164721867 ccsds_downlink_command(): echoing "Begin Stare 2"
3164721917 ccsds_downlink_command(): echoing "NIR1 at 3"
3164751918 ccsds_downlink_command(): echoing "NIR2 at 3"
3164781918 ccsds_downlink_command(): echoing "NIR1 at 5"
3164811919 ccsds_downlink_command(): echoing "NIR2 at 5"
3164841919 ccsds_downlink_command(): echoing "NIR1 at 7"
3164871920 ccsds_downlink_command(): echoing "NIR2 at 7"
3164901920 ccsds_downlink_command(): echoing "NIR1 at 9"
3164930876 ccsds_downlink_command(): echoing "NIR2 at 9"
3164961921 ccsds_downlink_command(): echoing "NIR1 at 11"
3164991921 ccsds_downlink_command(): echoing "NIR2 at 11"
3165026922 ccsds_downlink_command(): echoing "NIR1 at 4"
3165056927 ccsds_downlink_command(): echoing "NIR2 at 4"
3165086928 ccsds_downlink_command(): echoing "NIR1 at 6"
3165116928 ccsds_downlink_command(): echoing "NIR2 at 6"
3165146929 ccsds_downlink_command(): echoing "NIR1 at 8"
3165176929 ccsds_downlink_command(): echoing "NIR2 at 8"
3165206929 ccsds_downlink_command(): echoing "NIR1 at 10"
3165236930 ccsds_downlink_command(): echoing "NIR2 at 10"
3165266930 ccsds_downlink_command(): echoing "NIR1 at 12"
3165296931 ccsds_downlink_command(): echoing "NIR2 at 12"
Data collected during sequence phases
timestamp message NSP1---------+ NSP2---------+ VSP----------+
VCB VIS NIR1 NIR2 MIR1 MIR2 HS1 IF1 DM1 HS2 IF2 DM2 CNT SM BM TLP
000000564 Start Sequence" 0 0 0 0 0 0 0 0 0 0 0 0 1 0 0 0
3162891404 Start Sequence" 0 0 0 0 0 0 0 0 0 0 0 0 0 0 0 0
3162891456 TLM_HSS_RATE :rate 2 0 0 0 0 0 0 0 0 0 0 0 0 0 0 0 0
3162891506 Mode: MIRLOOK 29" 0 0 0 0 0 0 0 0 0 0 1 0 0 0 0 0
3162891556 Mode: NSP2" 0 0 0 0 0 0 0 0 0 50 721 695 0 0 0 0
3162936906 Mode: VIS" 2 2 0 0 0 0 0 0 0 1 0 0 0 0 0 0
3162957706 Mode: NIR1" 8 0 8 0 0 0 0 0 0 2 0 0 0 0 0 0
3162990107 Mode: NIR2" 9 0 2 7 0 0 0 0 0 2 0 0 0 0 0 0
3163022507 Mode: VSP" 3 0 0 3 0 0 0 0 0 5 0 0 38 20 5 0
3163104358 Mode: MIR1" 0 0 0 0 180 0 0 0 0 9 0 0 0 0 0 0
3163233060 Mode: MIR2" 0 0 0 0 0 180 0 0 0 8 0 0 0 0 0 0
3163361762 Mode: NSP1" 0 0 0 0 0 4 62 2211 703 9 0 0 0 0 0 0
3163491414 Begin Stare 1" 0 0 0 0 0 0 0 0 0 0 0 0 0 0 0 0
3163491464 NIR1 at 3" 3 0 3 0 20 16 6 0 0 2 0 0 2 0 2 0
3163521464 NIR2 at 3" 3 0 0 3 20 20 7 0 0 2 0 0 1 0 1 0
3163551465 NIR1 at 5" 3 0 3 0 0 20 6 0 0 2 0 0 1 0 1 0
3163581465 NIR2 at 5" 3 0 0 3 20 5 7 0 0 2 0 0 1 0 1 0
3163611385 NIR1 at 7" 3 0 3 0 20 15 6 0 0 1 0 0 1 0 1 0
3163641466 NIR2 at 7" 3 0 0 3 20 20 6 0 0 2 0 0 1 0 1 0
3163671466 NIR1 at 9" 3 0 3 0 0 20 7 0 0 2 0 0 1 0 1 0
3163701467 NIR2 at 9" 3 0 0 3 20 0 6 0 0 2 0 0 1 0 1 0
3163731467 NIR1 at 11" 3 0 3 0 20 20 7 0 0 3 0 0 1 0 1 0
3163761468 NIR2 at 11" 3 0 0 3 20 20 7 42 0 2 0 0 2 0 2 0
3163796468 NIR1 at 4" 3 0 3 0 17 20 5 0 0 2 0 0 0 0 0 0
3163826469 NIR2 at 4" 3 0 0 3 3 20 7 0 0 2 0 0 1 0 1 0
3163856469 NIR1 at 6" 3 0 3 0 20 0 6 0 0 1 0 0 1 0 1 0
3163886469 NIR2 at 6" 3 0 0 3 20 20 6 0 0 2 0 0 1 0 1 0
3163916470 NIR1 at 8" 3 0 3 0 20 20 7 0 0 2 0 0 1 0 1 0
3163946470 NIR2 at 8" 3 0 0 3 0 16 6 0 0 2 0 0 1 0 1 0
3163976471 NIR1 at 10" 3 0 3 0 20 4 7 0 0 2 0 0 1 0 1 0
3164006471 NIR2 at 10" 2 0 0 2 20 20 6 0 0 2 0 0 1 0 1 0
3164036472 NIR1 at 12" 3 0 2 1 1 20 6 0 0 2 0 0 1 0 1 0
3164066472 NIR2 at 12" 7 3 1 3 339 320 139 0 0 43 0 0 22 0 22 0
3164722431 Begin Stare 2" 0 0 0 0 0 0 0 0 0 0 0 0 0 0 0 0
3164722481 NIR1 at 3" 3 0 3 0 20 20 6 0 0 2 0 0 1 0 1 0
3164752482 NIR2 at 3" 3 0 0 3 0 20 7 0 0 2 0 0 1 0 1 0
3164782482 NIR1 at 5" 3 0 3 0 20 5 6 0 0 2 0 0 1 0 1 0
3164812483 NIR2 at 5" 3 0 0 3 20 15 7 0 0 2 0 0 1 0 1 0
3164842483 NIR1 at 7" 3 0 3 0 20 20 6 0 0 2 0 0 1 0 1 0
3164872484 NIR2 at 7" 3 0 0 3 0 20 6 0 0 2 0 0 1 0 1 0
3164902484 NIR1 at 9" 3 0 3 0 20 1 7 0 0 2 0 0 1 0 1 0
3164931440 NIR2 at 9" 3 0 0 3 20 19 7 0 0 2 0 0 1 0 1 0
3164962485 NIR1 at 11" 2 0 2 0 16 20 5 0 0 2 0 0 1 0 1 0
3164992485 NIR2 at 11" 3 0 1 2 20 18 7 40 0 2 0 0 1 0 1 0
3165027486 NIR1 at 4" 4 0 3 1 4 22 6 3 0 2 0 0 1 0 1 0
3165057491 NIR2 at 4" 3 0 0 3 20 0 6 0 0 2 0 0 1 0 1 0
3165087492 NIR1 at 6" 3 0 3 0 20 20 7 0 0 2 0 0 1 0 1 0
3165117492 NIR2 at 6" 3 0 0 3 14 20 6 0 0 2 0 0 1 0 0 0
3165147493 NIR1 at 8" 3 0 3 0 6 20 6 0 0 2 0 0 0 0 0 0
3165177493 NIR2 at 8" 3 0 0 3 20 0 7 0 0 2 0 0 0 0 0 0
3165207493 NIR1 at 10" 3 0 3 0 20 20 7 0 0 2 0 0 0 0 0 0
3165237494 NIR2 at 10" 3 0 0 3 3 20 6 0 0 2 0 0 0 0 0 0
3165267494 NIR1 at 12" 3 0 3 0 17 14 6 0 0 1 0 0 0 0 0 0
3165297495 NIR2 at 12" 142 5 70 67 1080 1094 443 2296 703 203 722 695 95 20 60 0
EARTHLOOK2
Summary: No problems
Data Collection Plot:
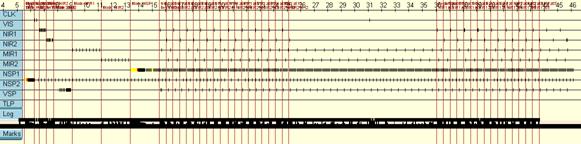
Timestamps of sequence milestones:
1669653476 ccsds_downlink_command(): echoing "Start Sequence"
1669653528 ccsds_downlink_command(): echoing "TLM_HSS_RATE :rate 29000"
1669653578 ccsds_downlink_command(): echoing "Mode: MIRLOOK 29"
1669653628 ccsds_downlink_command(): echoing "Mode: NSP2"
1669698979 ccsds_downlink_command(): echoing "Mode: VIS"
1669719779 ccsds_downlink_command(): echoing "Mode: NIR1"
1669752179 ccsds_downlink_command(): echoing "Mode: NIR2"
1669784580 ccsds_downlink_command(): echoing "Mode: VSP"
1669866431 ccsds_downlink_command(): echoing "Mode: MIR1"
1669995079 ccsds_downlink_command(): echoing "Mode: MIR2"
1670123834 ccsds_downlink_command(): echoing "Mode: NSP1"
1670253486 ccsds_downlink_command(): echoing "Begin Stare 1"
1670253536 ccsds_downlink_command(): echoing "NIR1 at 3"
1670283536 ccsds_downlink_command(): echoing "NIR2 at 3"
1670313537 ccsds_downlink_command(): echoing "NIR1 at 5"
1670343537 ccsds_downlink_command(): echoing "NIR2 at 5"
1670373538 ccsds_downlink_command(): echoing "NIR1 at 7"
1670403538 ccsds_downlink_command(): echoing "NIR2 at 7"
1670433538 ccsds_downlink_command(): echoing "NIR1 at 9"
1670463539 ccsds_downlink_command(): echoing "NIR2 at 9"
1670493539 ccsds_downlink_command(): echoing "NIR1 at 11"
1670523540 ccsds_downlink_command(): echoing "NIR2 at 11"
1670558540 ccsds_downlink_command(): echoing "NIR1 at 4"
1670588540 ccsds_downlink_command(): echoing "NIR2 at 4"
1670618541 ccsds_downlink_command(): echoing "NIR1 at 6"
1670648541 ccsds_downlink_command(): echoing "NIR2 at 6"
1670678542 ccsds_downlink_command(): echoing "NIR1 at 8"
1670708542 ccsds_downlink_command(): echoing "NIR2 at 8"
1670738542 ccsds_downlink_command(): echoing "NIR1 at 10"
1670768543 ccsds_downlink_command(): echoing "NIR2 at 10"
1670798543 ccsds_downlink_command(): echoing "NIR1 at 12"
1670828544 ccsds_downlink_command(): echoing "NIR2 at 12"
1671484503 ccsds_downlink_command(): echoing "Begin Stare 2"
1671484553 ccsds_downlink_command(): echoing "NIR1 at 3"
1671514553 ccsds_downlink_command(): echoing "NIR2 at 3"
1671544554 ccsds_downlink_command(): echoing "NIR1 at 5"
1671574554 ccsds_downlink_command(): echoing "NIR2 at 5"
1671604555 ccsds_downlink_command(): echoing "NIR1 at 7"
1671634555 ccsds_downlink_command(): echoing "NIR2 at 7"
1671664555 ccsds_downlink_command(): echoing "NIR1 at 9"
1671694556 ccsds_downlink_command(): echoing "NIR2 at 9"
1671724556 ccsds_downlink_command(): echoing "NIR1 at 11"
1671754557 ccsds_downlink_command(): echoing "NIR2 at 11"
1671789557 ccsds_downlink_command(): echoing "NIR1 at 4"
1671819558 ccsds_downlink_command(): echoing "NIR2 at 4"
1671849558 ccsds_downlink_command(): echoing "NIR1 at 6"
1671879558 ccsds_downlink_command(): echoing "NIR2 at 6"
1671909559 ccsds_downlink_command(): echoing "NIR1 at 8"
1671939559 ccsds_downlink_command(): echoing "NIR2 at 8"
1671969560 ccsds_downlink_command(): echoing "NIR1 at 10"
1671999560 ccsds_downlink_command(): echoing "NIR2 at 10"
1672029561 ccsds_downlink_command(): echoing "NIR1 at 12"
1672059561 ccsds_downlink_command(): echoing "NIR2 at 12"
Data collected during sequence phases
timestamp message NSP1---------+ NSP2---------+ VSP----------+
VCB VIS NIR1 NIR2 MIR1 MIR2 HS1 IF1 DM1 HS2 IF2 DM2 CNT SM BM TLP
000000565 Start Sequence" 0 0 0 0 0 0 0 0 0 0 0 0 1 0 0 0
1669654041 Start Sequence" 0 0 0 0 0 0 0 0 0 0 0 0 0 0 0 0
1669654093 TLM_HSS_RATE :rate 2 0 0 0 0 0 0 0 0 0 0 0 0 0 0 0 0
1669654143 Mode: MIRLOOK 29" 0 0 0 0 0 0 0 0 0 0 0 0 0 0 0 0
1669654193 Mode: NSP2" 0 0 0 0 0 0 0 0 0 50 722 677 0 0 0 0
1669699544 Mode: VIS" 2 2 0 0 0 0 0 0 0 1 0 0 0 0 0 0
1669720344 Mode: NIR1" 10 0 10 0 0 0 0 0 0 2 0 0 0 0 0 0
1669752744 Mode: NIR2" 8 0 0 8 0 0 0 0 0 2 0 0 0 0 0 0
1669785145 Mode: VSP" 2 0 0 2 0 0 0 0 0 5 0 0 39 20 6 0
1669866996 Mode: MIR1" 0 0 0 0 180 0 0 0 0 9 0 0 0 0 0 0
1669995644 Mode: MIR2" 0 0 0 0 0 180 0 0 0 8 0 0 0 0 0 0
1670124399 Mode: NSP1" 0 0 0 0 0 7 62 2211 727 9 0 0 0 0 0 0
1670254051 Begin Stare 1" 0 0 0 0 0 0 0 0 0 0 0 0 0 0 0 0
1670254101 NIR1 at 3" 3 0 3 0 20 13 7 0 0 2 0 0 2 0 2 0
1670284101 NIR2 at 3" 3 0 0 3 20 20 6 0 0 2 0 0 1 0 1 0
1670314102 NIR1 at 5" 3 0 3 0 0 20 6 0 0 2 0 0 1 0 1 0
1670344102 NIR2 at 5" 3 0 0 3 20 4 7 0 0 2 0 0 1 0 1 0
1670374103 NIR1 at 7" 3 0 3 0 20 16 6 0 0 1 0 0 1 0 1 0
1670404103 NIR2 at 7" 3 0 0 3 20 20 6 0 0 2 0 0 1 0 1 0
1670434103 NIR1 at 9" 3 0 3 0 0 20 7 0 0 2 0 0 1 0 1 0
1670464104 NIR2 at 9" 3 0 0 3 20 2 6 0 0 2 0 0 1 0 1 0
1670494104 NIR1 at 11" 3 0 3 0 20 18 6 0 0 2 0 0 1 0 1 0
1670524105 NIR2 at 11" 3 0 0 3 20 20 7 38 0 3 0 0 1 0 1 0
1670559105 NIR1 at 4" 3 0 3 0 19 20 6 4 0 2 0 0 1 0 1 0
1670589105 NIR2 at 4" 3 0 0 3 1 20 7 0 0 2 0 0 1 0 1 0
1670619106 NIR1 at 6" 3 0 3 0 20 0 6 0 0 1 0 0 1 0 1 0
1670649106 NIR2 at 6" 3 0 0 3 20 20 6 0 0 2 0 0 1 0 1 0
1670679107 NIR1 at 8" 3 0 3 0 19 20 7 0 0 2 0 0 1 0 1 0
1670709107 NIR2 at 8" 3 0 0 3 1 20 6 0 0 2 0 0 1 0 1 0
1670739107 NIR1 at 10" 3 0 3 0 20 0 6 0 0 2 0 0 1 0 1 0
1670769108 NIR2 at 10" 3 0 0 3 20 20 7 0 0 2 0 0 1 0 1 0
1670799108 NIR1 at 12" 3 0 3 0 19 20 6 0 0 2 0 0 1 0 1 0
1670829109 NIR2 at 12" 6 3 0 3 321 320 139 0 0 43 0 0 22 0 22 0
1671485068 Begin Stare 2" 0 0 0 0 0 0 0 0 0 0 0 0 0 0 0 0
1671485118 NIR1 at 3" 3 0 3 0 20 20 6 0 0 2 0 0 1 0 1 0
1671515118 NIR2 at 3" 3 0 0 3 0 20 7 0 0 2 0 0 1 0 1 0
1671545119 NIR1 at 5" 3 0 3 0 20 3 6 0 0 2 0 0 1 0 1 0
1671575119 NIR2 at 5" 3 0 0 3 20 17 6 0 0 2 0 0 1 0 1 0
1671605120 NIR1 at 7" 3 0 3 0 20 20 7 0 0 2 0 0 1 0 1 0
1671635120 NIR2 at 7" 3 0 0 3 0 20 6 0 0 2 0 0 1 0 1 0
1671665120 NIR1 at 9" 3 0 3 0 20 5 7 0 0 2 0 0 1 0 1 0
1671695121 NIR2 at 9" 3 0 0 3 20 15 6 0 0 2 0 0 1 0 1 0
1671725121 NIR1 at 11" 3 0 3 0 20 20 6 0 0 2 0 0 1 0 1 0
1671755122 NIR2 at 11" 3 0 0 3 17 20 7 43 0 2 0 0 1 0 1 0
1671790122 NIR1 at 4" 3 0 3 0 3 18 6 0 0 2 0 0 1 0 1 0
1671820123 NIR2 at 4" 3 0 0 3 20 2 6 0 0 2 0 0 1 0 1 0
1671850123 NIR1 at 6" 3 0 3 0 20 20 7 0 0 2 0 0 1 0 1 0
1671880123 NIR2 at 6" 3 0 0 3 17 20 6 0 0 2 0 0 1 0 1 0
1671910124 NIR1 at 8" 3 0 3 0 3 20 6 0 0 2 0 0 1 0 1 0
1671940124 NIR2 at 8" 3 0 0 3 20 0 7 0 0 2 0 0 1 0 1 0
1671970125 NIR1 at 10" 3 0 3 0 20 20 6 0 0 2 0 0 1 0 1 0
1672000125 NIR2 at 10" 3 0 0 3 17 20 7 0 0 2 0 0 1 0 1 0
1672030126 NIR1 at 12" 3 0 3 0 3 20 6 0 0 1 0 0 1 0 1 0
1672060126 NIR2 at 12" 142 5 70 67 1080 1100 443 2296 727 203 722 677 101 20 67 0
SEPARATION
Summary: This sequence was reworked during the flight to incorporate MOS’ experience managing changes in the downlink bandwidth during maneuvers. Control of the camera sampling rates after the s/c had turned to face the Centaur was shifted to the ground and run from there. Otherwise, the sequence was the same as had been planned.
Data Collection Plot:
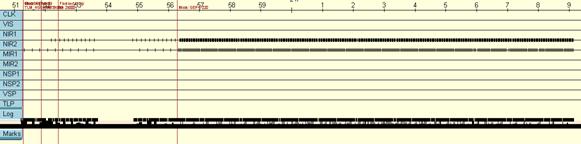
Timestamps of sequence milestones:
3425598488 ccsds_downlink_command(): echoing "Start Sequence"
3425598522 ccsds_downlink_command(): echoing "TLM_HSS_RATE :rate 29000"
3425598572 ccsds_downlink_command(): echoing "Mode: SEP A 29"
3425634023 ccsds_downlink_command(): echoing "Mode: NIR2"
Data collected during sequence phases
timestamp message NSP1---------+ NSP2---------+ VSP----------+
VCB VIS NIR1 NIR2 MIR1 MIR2 HS1 IF1 DM1 HS2 IF2 DM2 CNT SM BM TLP
000000565 Start Sequence" 0 0 0 0 0 0 0 0 0 0 0 0 1 0 0 0
3425599053 Start Sequence" 0 0 0 0 0 0 0 0 0 0 0 0 0 0 0 0
3425599087 TLM_HSS_RATE :rate 2 0 0 0 0 0 0 0 0 0 0 0 0 0 0 0 0
3425599137 Mode: SEP A 29" 0 0 0 0 55 0 0 0 0 0 0 0 0 0 0 0
3425634588 Mode: NIR2" 0 0 0 0 55 0 0 0 0 0 0 0 1 0 0 0
PREIMPACT
IMPACT
Summary: Described in the next section
Data Collection Plot:
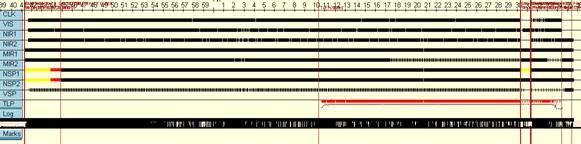
Timestamps of sequence milestones:
3457395479 ccsds_downlink_command(): echoing "Start Sequence"
3457395530 ccsds_downlink_command(): echoing "ver impact-1000k 2009-10-01"
3457395580 ccsds_downlink_command(): echoing "TLM_HSS_RATE :rate 1000000"
3457398430 ccsds_downlink_command(): echoing "Mode: PREIMPACT 1000"
3457613454 ccsds_downlink_command(): echoing "MODE: PREIMPACT SLEEP"
3459143360 ccsds_downlink_command(): echoing "TLP Activated"
3460341442 ccsds_downlink_command(): echoing "Stop Other Sequences"
3460342546 ccsds_downlink_command(): echoing "Mode: FLASH 1000"
3460399424 ccsds_downlink_command(): echoing "Start VSP Exposure"
3460402424 ccsds_downlink_command(): echoing "Predicted Centaur impact time"
3460407324 ccsds_downlink_command(): echoing "Mode: CURTAIN 1000"
3460587424 ccsds_downlink_command(): echoing "Mode: CRATER 1000"
3460647432 ccsds_downlink_command(): echoing "Predicted SSC impact time"
Data collected during sequence phases
timestamp message NSP1---------+ NSP2---------+ VSP----------+
VCB VIS NIR1 NIR2 MIR1 MIR2 HS1 IF1 DM1 HS2 IF2 DM2 CNT SM BM TLP
000000564 Start Sequence" 0 0 0 0 0 0 0 0 0 0 0 0 1 0 0 0
3457396043 Start Sequence" 0 0 0 0 0 0 0 0 0 0 0 0 0 0 0 0
3457396094 ver impact-1000k 200 0 0 0 0 0 0 0 0 0 0 0 0 0 0 0 0
3457396144 TLM_HSS_RATE :rate 1 0 0 0 0 0 0 0 36 0 0 18 0 1 0 0 0
3457398994 Mode: PREIMPACT 1000 306 151 77 78 8545 8415 0 11229 12333 0 11237 12312 44 0 37 0
3457614018 MODE: PREIMPACT SLEE 2306 1138 584 584 56656 29905 2404 0 86 2404 0 107 284 0 284 0
3459143924 TLP Activated" 1964 980 490 494 25920 7340 2033 0 0 2033 0 0 240 0 240 1061400
3460342006 Stop Other Sequences 0 0 0 0 0 0 0 0 0 0 0 0 0 0 0 0
3460343110 Mode: FLASH 1000" 134 0 134 0 580 560 2 4045 0 96 0 0 5 0 3 56900
3460399988 Start VSP Exposure" 9 0 9 0 40 20 0 217 0 5 0 0 0 0 0 3000
3460402988 Predicted Centaur im 14 0 14 0 40 60 0 347 0 8 0 0 1 0 1 4800
3460407888 Mode: CURTAIN 1000" 242 103 71 68 4820 3820 304 49 0 306 0 0 21 1 13 173300
3460587988 Mode: CRATER 1000" 40 0 0 40 3540 3450 101 0 0 101 0 0 30 0 23 700
3460647996 Predicted SSC impact 5015 2372 1379 1264 100141 53570 4844 15923 12419 4953 11255 12419 627 1 601 1300100
11 The Final Hour
The PREIMPACT and IMPACT data collection periods covered the final hour of the LCROSS mission. The plan for these periods was flexible and included commands from the ground. There were also several ways in which what happened differed from the plan. This section describes what occurred and why. It is a simplified version the final entry in the LCROSS Flight Director's blog. This version focuses on issues that impact the quality of the data submitted to the Planetary Data System performance and eliminates other material. This account covers why some of the pictures were fuzzy and some were white and why ground commands were sent during the last minutes of the flight. The original, full account is here: http://blogs.nasa.gov/cm/blog/lcrossfdblog.
Available Bandwidth
Data from all nine instruments shared 1 mbit/s of a 1.096 mbit/s telemetry channel. This was the maximum data rate available for the LCROSS mission, and it was used only during the lunar swingby on June 22nd and during the impact on October 9th. Instrument calibration activities used a variety of lower data rates.
The Observation Plan
The two components of the LCROSS mission, the Centaur and the Shepherding Spacecraft (S-S/C), separated about 10 hours before they reached the moon. At the moment the Centaur impacted, the S-S/C was still 600 kilometers above the surface. Falling at 2.5 kilometers per second, the S-S/C reached the surface 4 minutes later.
The diagram below shows the plan for observing from the S-S/C, starting one minute before Centaur impact. The diagram plots the intended schedule of instrument observations against time: each row represents one of the instruments (instrument abbreviations appear below each row of data), and each tick mark along a row represents one observation, either an image or a spectrum. Over some intervals, the observations are spaced so closely that the plot looks like a solid bar.
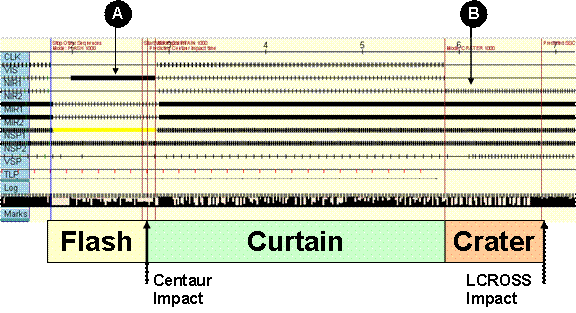
Figure 1 The LCROSS impact observation plan: These timelines indicate when each image and spectra was planned to occur during the final four minutes of the mission.
The last four minutes were divided into three periods, called FLASH, CURTAIN and CRATER. Each period focused on a different aspect of the expected impact event and emphasized data collection from different instruments.
FLASH started one minute before the Centaur impact and focused on the very short burst of light generated by the Centaur impact itself. Starting from the top of the diagram, the plan was to stop both the Visible Light Camera (VIS) and the Near-Infrared Camera #2 (NIR2). This allocated downlink bandwidth to NIR1 images which had the best chance of catching the location of the impact flash. These three cameras shared a common input to our payload computer, called the Data Handling Unit (DHU), and could not be used simultaneously. By stopping VIS and NIR2, we could run NIR1 at a faster rate (see the segment labeled 'A'), increasing the odds that it would image the flash. The planned sequence also increased the NIR1 exposure time to capture the flash signature even if it was very faint. This would produce a badly overexposed image of the illuminated lunar surface, but we did not expect to overexpose the shadowed regions and believed the impact flash would be visible against the dark background. Shifting between cameras like this accounts for the periods where one camera image would stop updating for a while.
The FLASH strategy for the spectrometers was also designed around an expectation of a dim, short duration flash event. Near Infrared Spectrometer #1 (NSP1), the main water-detection instrument, was put into a high-speed, low resolution mode called ‘Flash Mode’. This is represented by the yellow bar. The Visible and Ultraviolet light Spectrometer (VSP) was commanded to take long exposures, and Total Luminescence Photometer (TLP) was powered early enough to reach equilibrium and be at its most sensitive for the flash event.
The second phase, CURTAIN, started just after the Centaur impact and ran for three minutes. Its purpose was to take spectra and images of the expanding vapor and dust clouds thrown up by the impact. CURTAIN was the most important period and also the simplest. All instruments ran in their default modes, as follows. The DHU shifted between the three analog cameras in a stuttering pattern - VIS, VIS, NIR1, NIR2 - repeating. Both thermal cameras monitored the plume shape and temperature. The two downward-facing spectrometers (NSP1 and VSP) looked
for water and other chemicals. The side-looking spectrometer (NSP2) also looked for water and other compounds, but from sunlight scattered or absorbed by the dust and vapor cloud. The TLP continued to take data during this period, but it’s primarily function was during FLASH.
The goal of CRATER, the final period, was to image the crater made by the Centaur impact to get its precise location and, more importantly, its size. The primary instruments in this period were the two thermal cameras, MIR1 and MIR2. Their sample rates were increased relative to those for CURTAIN. To image the crater in a second frequency band, NIR2, the more sensitive near infrared camera, was commanded to its most sensitive setting. NIR1 and VIS would not be used during this period because neither was sensitive enough to see anything in the permanently shadowed area. All spectrometers would continue running to look for light reflected off of any plume or vapor cloud. At the end of this phase, the S-S/C would fall below the rim of Cabeus Crater, cutting off radio transmission to Earth, and then impact the surface a couple of seconds later.
There were three keys to making this plan work:
- Downlink Bandwidth: the data collected had to fit within the 1 megabit radio downlink. A lot of testing before launch to work out a data collection plan that was further confirmed and refined based on on-orbit performance. We gave priority to data from the most important instrument, the near-infrared spectrometers, to provide robustness to the design.
- Camera Exposure: The flight team planned for the possibility that camera exposure settings would need to be adjusted during the descent to reflect the changing scene brightness. Defaults were pre-programmed based on the latest lighting models for impact morning.
- Command Timing: The instrument command sequences governing FLASH, CURTAIN and CRATER periods changed instrument configuration and sampling rates frequently as needed to focus on different aspects of the impact event. There were many constraints governing the design of these sequences, and they were necessarily somewhat brittle to lags in command execution.
What actually happened?
LCROSS collected a very rich and interesting data set that met the science objectives. However, there were challenges in all three areas – bandwidth, exposure settings and command timing. Although all ultimately proved minor, it was, in some ways, a close call. This diagram shows what data was actually collected during the final four minutes of the mission.
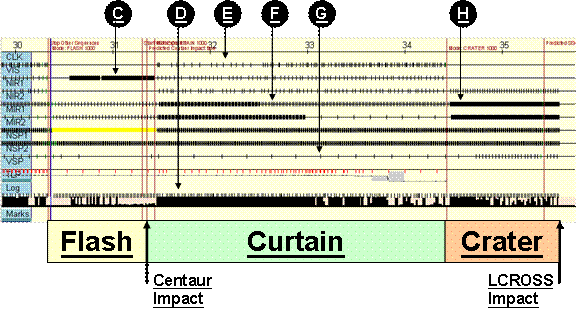
Figure 2 Actual data collection performance of the lcross payload: These timelines indicate when the images and spectra were taken on the morning of the impact. The pattern gives clues about the performance of the hardware and software systems that collected the data.
First, the rows representing the spectrometers, NSP1, NSP2 and VSP, look almost exactly as they should. Except for one problem with the Visible and Ultraviolet light spectrometer (VSP), which I describe later, the plan for collecting spectra worked perfectly. This is very good, because the spectra carried most of the information LCROSS was trying to collect.
As for the cameras, several differences from the plan jump out. The most obvious is that the timing of observations along some timelines is irregular with many observations missing, e.g., the visible camera pointed to by note E. This occurred with all five cameras (the first five timelines) but not with the spectrometers (the next three timelines).
Scene Complexity and Bandwidth Limitations
The irregularity of observations occurred because we underestimated the complexity of the lunar scene during ground testing. We had done much of our testing with a large reproduction of the moon's north pole in front of the cameras, and data from this testing was used to allocate downlink bandwidth to the instruments and to margin. However, this reproduction and its lighting didn't mimic the high contrast and detail of the real scene sufficiently. Scene complexity and contrast mattered because the images were highly compressed and changes in the moon scene changed the sizes of the compressed images by a factor of 4. We first observed this behavior during the lunar swingby LCROSS performed during the first week of its mission. Turning on the instruments during the swingby was intended as a learning experience, and it proved critically important. It provided the best operational practice we got for the impact as well as data to calibrate the instruments.
After the lunar swingby in June, we changed the thermal camera sampling rates in the instrument command sequences for the final hour. Unfortunately, the compression problem turned out to be about 20% worse during the final hour of the mission than during the lunar swingby. This forced the flight team to change the thermal camera rates again in real-time. In the NASA TV impact video sequence, the Science Team can be heard requesting a change of MIR1 rates to 1 Hz, and MIR2 to 0.1 Hz. (See note F in the figure. The rate for thermal camera #1 (MIR1) changes just before this note and changes for MIR2 just after it.
The bandwidth problem could have been avoided if in addition to changing camera sampling rates in the command sequences, the stuttering pattern for the analog cameras mentioned above had also been changed to eliminate one VIS image during each repetition. Collecting a single VIS image during each repetition rather than two would have made no difference to the quality of the data collected, particularly since the two images were closely spaced. However, the ground instrument simulator did not have the full set of instruments, which made it impossible to adequately test this change on the ground. Testing this change on orbit was discussed but dropped due to the anomaly LCROSS experienced on 8/22/2009.
One other problem caused by the complex lunar scene was damaged images. After compression, some of the visible camera images were still too large to fit within a single data packet for transmission to Earth. Here's an example of the kind of damaged image that resulted. The shadowed area should be completely dark, but instead contains wispy bright areas. These compression-artifacts are intimately linked to the scene and need to be taken out with image post-processing.
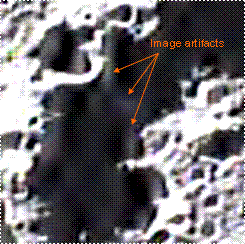
Figure 3 Example of damage to downlinked images due to clipping in the telemetry packet formatting software.
What caused these compression artifacts? The software for compressing these images had been written some years before to clip the compressed form of images to ensure they always fit within a single data packet (maximum size 65536 bytes). The DHU used a wavelet-based compression algorithm, and clipping the compressed images removed some information needed to recreate the image accurately. An alternative would have been to split the images across multiple packets and reassemble them on the ground. This certainly could have been done in principle, but doing so would have introduced significant changes right at the heart of software that the project had planned to reuse without change after its successful use on previous projects.
Changing NIR Exposure Settings
Most of the commanding done from the ground was to adjust the exposure times of the near infrared cameras as the scene changed. The other cameras either controlled themselves (VIS) or had only one appropriate setting (the thermal cameras, MIR1 and MIR2). We controlled the exposure setting for the near infrared cameras explicitly because we were trying to image a relatively dim flash and ejecta curtain close to bright mountain peaks.
Near the beginning of the FLASH period, the flight team discovered the exposure setting wasn’t correct. To image the dim centaur impact flash, the sunlit peaks were deliberately overexposed. In this case, the sunlit areas electronically bled into nearby parts of the image. That occurs when electrons in overexposed pixels move across the image detector to other pixels. In this case, the shadowed area of Cabeus crater was completely covered, obscuring our view of the impact. That was why the only image that was updating just before the Centaur impact was white. This level of bleeding didn’t occur earlier in the mission, or in almost any of the ground testing. However, a search of the data archive did find that it occurred once, a year before launch, in one flashlight test in a darkened room. We did not fully understand the implications of that test.
Once the flight team noticed the problem, a command was sent to adjust the exposure setting, but the command arrived about two seconds after the Centaur impact. Therefore, NIR1 failed to capture the location of the impact flash. However, the thermal cameras, MIR1 and MIR2 did image the impact location.
We intentionally caused the same bleeding problem later, during the CRATER period, but we had better success (see above figure at the segment labeled 'B’). Initially, the NIR2 camera images were badly overexposed for the same reason as during FLASH (hence the white images that appear in the NASA TV video just after entry to DV Mode). The flight team made the call to reduce the exposure time slightly, from the exposure setting called “OPR 15” to “OPR 10”. As the lit peaks slid out of the field of view, this change produced excellent images of the very dark crater floor, including the image that gave us our best estimate of the Centaur crater location and size. These images go all the way down to 2 seconds before S-S/C impact where the craft was 5 kilometers above the surface, although the centaur impact crater leaves the field of view before that. The crater floor of Cabeus was indeed brighter than any of the predictions, at least in the near infrared.


Figure 4 This image sequence was captured just before the end of the mission and shows the NIR2 camera going from badly overexposed to acceptably exposed as the lit peaks surrounding Cabeus leave the field of view.
The right side of Figure 5 shows one of these NIR2 images overlaid with a MIR1 image. This allows the centaur impact crater to be reliably identified in the NIR2 imagery which ultimately has turned out to be the best source data for computing the coordinates of the centaur impact crater.
The left figure below shows aligned images from NIR2 and MIR1, taken before the Centaur impact. The right figure shows aligned images from these cameras taken just before the S-S/C impacted and showing the Centaur impact crater (see inset). These images don't align perfectly because they were taken about a second and 2.5 kilometers apart.

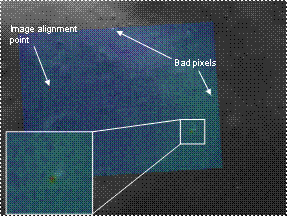
Figure 5 The right image shows the Centaur impact crater in both near-infrared and mid-infrared images. The left images overlays images taken before the impact by the same two cameras.
Unintentionally Long Exposure Times
The commanding side of the automatic sequence ran almost perfectly. However, there was one problem with the Visible and Ultraviolet Spectrometer during the CURTAIN period. Because the DHU was at its maximum data throughput capacity during the first part of CURTAIN, one command to change exposure time was delayed and sent during a period when the instrument wasn't listening. That command was ignored. This occurred at time D in Figure 2 and resulted in capturing fewer spectra with longer-than-planned exposure times. The effect of this on the VSP calibrated dataset is fewer spectra with longer integration times and lower signal-to-noise ratios.