 SRO-09M-20x
February 18, 2010
To: Distribution
From: J R Jensen
Subject: LRO Mini-RF S-band transmit polarization ellipse as observed at Green Bank on August 23, 2009
Coordinate Systems
The LRO coordinate system is shown in Figure 1. The flight direction is the orbiter X-axis, which is also the horizontal axis for the Mini-RF radar.
Figure 2 shows the coordinate systems that will be used throughout this report. The figure shows the LRO Mini-RF and Green Bank coordinates as viewed by an observer that is behind the Green Bank antenna and is looking through the Green Bank antenna at the front (radiating) surface of the Mini-RF antenna. The Mini-RF beam direction and the Green Bank +Z-axis are parallel and are out-of-the-page in the figure. The direction of circulation for the Arecibo uplink test and the field transmitted from LRO Mini-RF are also shown on this figure for use later.
Geometries of the Azimuth and Elevation Scans
Two nearly orthogonal scans of the Mini-RF antenna were conducted on August 23, 2009. The first was a scan in the elevation plane (the orbiter Y-Z plane; the vertical axis in Figure 2). The second was in the azimuth plane (includes the orbiter X-axis and the antenna normal; the horizontal axis in Figure 2). After projection of the LRO Mini-RF axes onto the Green Bank antenna, the angle between the Mini-RF H-axis and the Green Bank X-axis is 44.6˚ for the elevation scan. The corresponding angle for the azimuth scan is 134.5˚. These two projections are shown in Figures 3 and 4. The rotation between these two scans is 89.9˚.
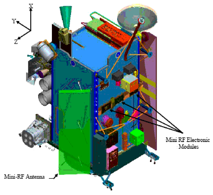
Figure 1. LRO coordinate system. The solar panels are not shown.
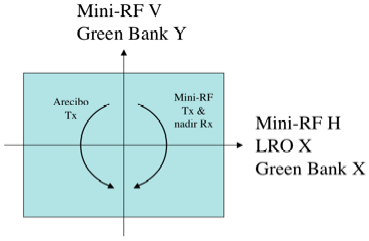
Figure 2. Coordinate systems for Green Bank and LRO
Mini-RF. The LRO Mini-RF beam is out-of-the-page ( ), as is the Green
Bank +Z-axis (
), as is the Green
Bank +Z-axis ( ).
).
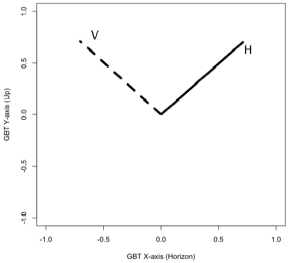
Figure 3. Projection of the Mini-RF coordinates onto the Green Bank antenna for the elevation scan. The angle between the LRO Mini-RF H-axis and the Green Bank X-axis is 44.6˚.
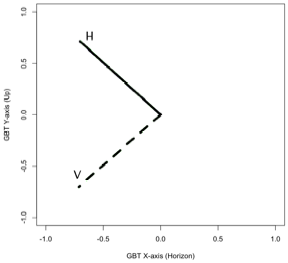
Figure 4. Projection of the Mini-RF coordinates onto the Green Bank antenna for the azimuth scan. The angle between the LRO Mini-RF H-axis and the Green Bank X-axis is 134.5˚.
Green Bank Observations
The plots of the Green Bank data are contained in Figures 5 and 6. “XX” and “YY” are the powers in the X and Y linear receiver channels, whose alignment is as shown in Figure 1. “XY” and “YX” are the real and imaginary parts of the cross-term (product of X and Y*). The values for these quantities at the center of the scan are taken from these plots and are listed in Table 1. Because the peaks of the “YX” plots do not occur at the same time for which the “XX” and “YY” plots have their maximum, the values in Table 1 are lower than the peak values in the plots. In order to be meaningful, the values must all pertain to a single instant of time.
Here we determine a set of receiver gain coefficients and incident field components for the two scans such that a) the data are consistent with the values in Table 1 for both scans, and b) the field components are rotated between the two scans as shown in Figures 3 and 4. The determination of these gains and field components involves solving a quadratic equation, which has two solutions. The two solutions correspond to the opposite polarization of the incident field. That is, one solution is left-hand circularly polarized and the other is right-hand.
The Green Bank +Z-axis points
from space to the antenna. The field transmitted from LRO Mini-RF is left-hand
circularly polarized, in the forward sense, as observed by the APL ground
station. This means that the phase of the Y-component of the field will lead
the phase of the X-component and  for the correct
solution.
for the correct
solution.
Table 1. Measured values of the power for each receiver channel (“XX” and “YY”) and the real and imaginary components of the cross-term (“XY” and “YX”), for the LRO Mini-RF Green Bank measurements at the center of each scan.
|
|
azimuth scan |
elevation scan |
|
XX |
0.6 x 10⁷ |
1.2 x 10⁷ |
|
YY |
3.1 x 10⁷ |
2.1 x 10⁷ |
|
XY |
-1.0 x 10⁷ |
-1.2 x 10⁷ |
|
YX |
-0.9 x 10⁷ |
-1.0 x 10⁷ |
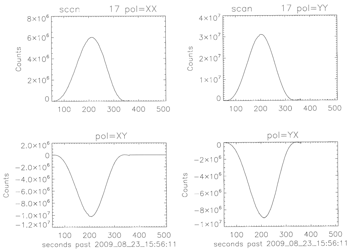
Figure 5. Elevation scan results.
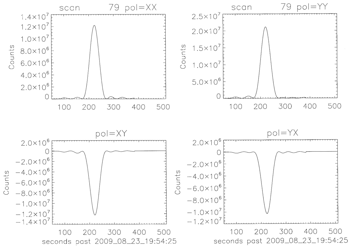
Figure 6. Azimuth scan results.
Solution for the gains and field components
Arbitrarily setting the gain of the “X” receiver channel to 1 and specifying that the field component on the X-axis be real for the azimuth scan (the analysis leaves some things undetermined, but also unimportant), the values in Table 1 can be broken down as follows.
Receiver gain terms

Field components for azimuth scan

Field components for elevation scan

Demonstration of the solution
The field components from the elevation scan are related to the components of the azimuth scan by a rotation angle of -147.8˚. That is,

where  is an overall real
scale factor for the second scan that is equal to 1.0789 for this case. Such a
scale factor can account for a difference in the atmospheric absorption, for
example.
is an overall real
scale factor for the second scan that is equal to 1.0789 for this case. Such a
scale factor can account for a difference in the atmospheric absorption, for
example.
Using these values, the computed powers for the azimuth scan are

and for the elevation scan

These agree with the observed values listed in Table 1 taken from the curves in Figures 5 and 6.
The critical assumption in the above analysis is that the Green Bank receiver has operated in an identical fashion for both of the scans. The only changes that are assumed between the two scans are a rotation and an overall scale factor applied to the incident field. A comparison of the results to independent measurements below encourages acceptance of this assumption.
Projection of the Fields onto LRO Mini-RF Antenna
The above results for  and
and  pertain to the
geometry shown in Figure 3. In order to determine the field components in the
Mini-RF coordinates, the fields must be rotated by -44.6˚ to align the Green
Bank axes and the Mini-RF axes as shown in Figure 2.
pertain to the
geometry shown in Figure 3. In order to determine the field components in the
Mini-RF coordinates, the fields must be rotated by -44.6˚ to align the Green
Bank axes and the Mini-RF axes as shown in Figure 2.
The transformation is

The result of the rotation is
Field components rotated into Mini-RF frame

This is the final result for the calculation of the LRO Mini-RF transmitted field in the absence of Faraday rotation.
Faraday Rotation
The results above do not account for any Faraday rotation that may take place as the signals travel through the ionosphere between the Moon and Green Bank. Faraday rotation will result in the plane of polarization rotating clockwise from the perspective of an observer at the Moon.
During the elevation scan, the Moon had an elevation angle between 13˚ and 17˚ at the Green Bank Telescope. The elevation angle for the azimuth scan was about 39˚. The lower elevation angle of the elevation scan results in a much longer path length through the ionosphere which can produce greater Faraday rotation.
No facility for the measurement of the total electron content along the propagation path is present at Green Bank. Models are used here in place of measurements. Because significant uncertainty exists in the degree of rotation, two calculations of the impact of Faraday rotation have been performed. The first assumes an ambient ionosphere, while the second assumes an elevated ionosphere as an upper bound to the degree of Faraday rotation. No-rotation and the elevated ionosphere represent bounds on the Faraday rotation. The rotation angles and the impact on the power and phase imbalances are shown in Table 2. For the elevation scan, the rotation angle changes significantly over the course of the scan. The angle at the center of the scan are used to derive the results in Table 2. Faraday rotation is seen to have a small impact on the channel-to-channel phase balance and the axial ratio. The channel-to-channel power balance shows the most sensitivity, but still at the level of less that 0.25 dB even for the Faraday rotation that is predicted for an elevated ionosphere.
Table 2. Impact of Faraday rotation on the channel balance and axial ratio.
|
|
no Faraday rotation |
ambient ionosphere |
elevated ionosphere |
composite |
|
elevation scan Faraday rotation |
0˚ |
5˚ |
11.6˚ |
|
|
azimuth scan Faraday rotation |
0˚ |
0.4˚ |
1.0˚ |
|
|
V/H |
-0.12 dB |
-0.34 dB |
-0.63 dB |
-0.37 ± 0.25 dB |
|
V-H |
74.66˚ |
74.75˚ |
74.92˚ |
74.8˚ ± 0.1˚ |
|
axial ratio |
2.356 dB |
2.365 dB |
2.401 dB |
2.38 ± 0.02 dB |
Digital Continuum Receiver
Another pair of products obtained at Green Bank during the two scans is shown in Figures 7 and 8. This data are not sufficient to completely solve for the gains and field components, but it provides a consistency test for the previous analysis.
The peaks of the four traces are as follows:
Elevation scan X = 2.2 x 10⁵ Azimuth scan X = 3.8 x 10⁵
Elevation scan Y = 3.3 x 10⁵ Azimuth scan Y = 2.0 x 10⁵
These imply an imbalance of the
incident field of 2.3 dB ( ).
This is in good agreement with what was reported above. These data do not imply
an orientation of the polarization ellipse, but if combined with the previous
observation that the ellipse is very well aligned with the Green Bank antenna
frame, then this imbalance can be interpreted as an axial ratio of 2.3 dB for the
transmitted field.
).
This is in good agreement with what was reported above. These data do not imply
an orientation of the polarization ellipse, but if combined with the previous
observation that the ellipse is very well aligned with the Green Bank antenna
frame, then this imbalance can be interpreted as an axial ratio of 2.3 dB for the
transmitted field.
These data imply an imbalance of
the ground station of only 0.5 dB, with the “X” channel being the stronger of
the two channels. This contrasts with the receiver gain imbalance implied by
the solution for  and
and  above, which
indicate a gain imbalance of 4.8 dB, with the “Y” channel being the stronger of
the two. Therefore, while the two data products produce a similar picture of
the incident field, they produce different pictures of the receiver channels.
Green Bank personnel have reported that differences in the channel balance of
these two products is not unreasonable.
above, which
indicate a gain imbalance of 4.8 dB, with the “Y” channel being the stronger of
the two. Therefore, while the two data products produce a similar picture of
the incident field, they produce different pictures of the receiver channels.
Green Bank personnel have reported that differences in the channel balance of
these two products is not unreasonable.
Communications Experiment Observations
During a downlink communications experiment performed on August 16, the downlink power was observed on both left-hand circular (LHC) and right-hand circular (RHC) polarized channels. The RHC signal was observed in that experiment to be 17.8 dB weaker than the LHC signal. This implies an axial ratio 2.25 dB.

This is close to the value inferred from the spectral processor and the digital continuum receiver.
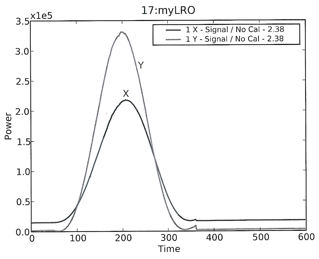
Figure 7. Elevation scan from digital continuous receiver.
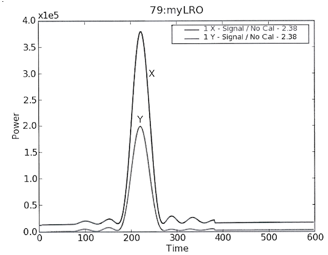
Figure 8. Azimuth scan from digital continuous receiver.
Discussion
The above results can be compared to other, independent measurements of the LRO Mini-RF instrument. In particular, uplink tests with the Arecibo Radio Telescope were conducted on August 17, August 20, and September 13, 2009, and a nadir collection was performed on July 16, 2009. The uplink test characterizes the complete receiver components of the radar, while the Green Bank test addressed above characterizes the complete transmit components. The nadir test is an end-to-end test of the system. A full understanding of the instrument performance needs to integrate all of these observations.
Gain and Phase Balance Observations from Arecibo Uplink
From the Arecibo uplink test, it
was determined that  ,
where
,
where  is the amplitude of
the vertical channel signal and
is the amplitude of
the vertical channel signal and  is the amplitude of the horizontal channel signal. This is a gain imbalance due
to the antenna and the receiver system. The digital data are well positioned
within the available dynamic range for this measurement.
is the amplitude of the horizontal channel signal. This is a gain imbalance due
to the antenna and the receiver system. The digital data are well positioned
within the available dynamic range for this measurement.
For the Arecibo measurements, the
electric fields are not directly observed but are indicated by the digital
output of the LRO Mini-RF receiver. The relationship between the relative phase
of  and
and  components of the
radiated field at the antenna surface and at the digital output is
components of the
radiated field at the antenna surface and at the digital output is

where  is the relative
phase in the digital output,
is the relative
phase in the digital output,  is the relative phase at the antenna surface, and
  is the contribution
to the relative phase due to the complete receiver system. The minus sign in
the above equation accounts for a spectral inversion that takes place as a
result of the sign convention that is implemented in the LRO Mini-RF digital
receiver.
is the contribution
to the relative phase due to the complete receiver system. The minus sign in
the above equation accounts for a spectral inversion that takes place as a
result of the sign convention that is implemented in the LRO Mini-RF digital
receiver.
For the Arecibo uplink test,  (LHC in the forward
sense, see Figure 2). The measurement result is
(LHC in the forward
sense, see Figure 2). The measurement result is  . Therefore,
  . This represents the
contribution to the observed phase of the digital data from the antenna,
cables, and the receiver. The antenna dominates this result.
. This represents the
contribution to the observed phase of the digital data from the antenna,
cables, and the receiver. The antenna dominates this result.
End-to-end Prediction
Given the Green Bank measurements
( and
and  ) and the Arecibo
measurements (
) and the Arecibo
measurements ( and
and  ), the prediction of
the end-to-end power balance is
), the prediction of
the end-to-end power balance is  . The predicted phase
balance is a
. The predicted phase
balance is a  .
It is assumed in making these predictions that the nadir scattering is
completely specular. That is, it is assumed that the power received on the
horizontal channel is proportional to the power that is transmitted on the
horizontal channel. Similarly for the vertical channel. Diffuse scattering will
bring the power ratio closer to unity, but should not introduce a phase bias.
.
It is assumed in making these predictions that the nadir scattering is
completely specular. That is, it is assumed that the power received on the
horizontal channel is proportional to the power that is transmitted on the
horizontal channel. Similarly for the vertical channel. Diffuse scattering will
bring the power ratio closer to unity, but should not introduce a phase bias.
Nadir Observations
LRO was rotated so as to point the Mini-RF antenna toward the lunar surface on July 16, 2009. This was done to eliminate any imbalance in the channel-to-channel power that might be due to off-nadir scattering. The collection was only 25 seconds long. The power imbalance (V/H) was observed to be between -1.4 and -2.2 dB over the duration of the collection. The phase imbalance (V - H) was observed to be between 101.4˚ ± 3.4˚. These observations are summarized in Table 3.
Table 3. End-to-prediction and nadir collection observations for the channel-to-channel gain and phase balances.
|
|
end-to-end prediction |
nadir observation |
|
gain balance (V/H) |
-2.12 ± 0.25 dB |
-1.8 ± 0.4 dB |
|
phase balance (V – H) |
108.3˚ ± 0.1˚ |
101.4˚ |
The power imbalance agrees very well with the end-to-end prediction. The phase imbalance is less than the end-to-end prediction by 6.9˚ ± 0.1˚. Additional nadir data may be necessary to reduce this difference, but the available nadir data are generally in line with the end-to-end prediction.
The antenna temperature may have had a significant impact on the nadir measurements. During the Green Bank and Arecibo tests, the four temperature sensors were within about 5˚ C of each other. The average of these four temperatures varied from test-to-test (-10˚C to 8˚C) but the spread remained small. During the nadir calibration, the four temperatures were higher than the other tests (25˚C to 40˚C) and, perhaps more significantly, one of the temperatures was 10˚C higher than any of the others. These temperatures are shown in Figure 9. This temperature difference across the antenna surface may have affected the results.
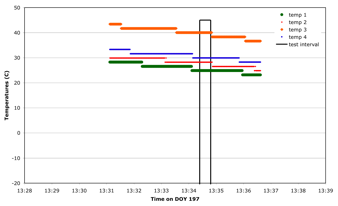
Figure 9. Antenna temperatures during the nadir collection.
Summary
The result of the Green Bank data analysis is a LRO Mini-RF transmit polarization of

where the sense of the phase difference is as shown in Figure 2. The phase of the field along the Mini-RF vertical axis is 105.2˚ behind of the phase of the field along the horizontal axis.
The results of the Arecibo uplink test are a receiver chain gain and phase imbalance of

These factors include the entire receiver chain of the antenna, cables, the analog receiver, and the digital elements.
Care must be exercised in applying these phase imbalances because of the phase-sense implemented by the digital receiver. As written, both phase terms are implicitly applied before a phase inversion. The end-to-end phase difference in the digital output is defined by

and so the V-H phase difference in the digital data is predicted to be -108.4˚ combining the Green Bank and Arecibo calibration results. The end-to-end measurement from the nadir collection shows reasonable agreement with the predictions that are based on the separate Arecibo uplink and Green Bank downlink tests, but may have been affected by the antenna temperatures during the nadir collection.
The transmitted field from LRO Mini-RF is not circular, but is elliptical. The axial ratio of 2.35 dB corresponds to a field in which the LHC-to-RHC ratio of 17.4 dB. This is a small enough ratio that the RHC contribution cannot be ignored in the polarimetric analysis of the Mini-RF SAR images.