3/13/2017
MASCS/VIRS Lamp-Based Flat Field Report
Prepared by: Rachel Klima, Greg Holsclaw & the MASCS team
1. Overview
This report describes the results of an investigation to derive a flat-field correction for the MASCS VIRS surface observations. VIRS contains internal stimulus lamps that illuminate both detector channels. During the orbital mission, calibration sequences were conducted to monitor any time- or temperature-dependent changes in the pixel-to-pixel sensitivity in both the Si and InGaAs detectors. Due to high temperatures and corresponding high dark current, the InGaAs detector was saturated during almost all lamp observations. The Si detector, however, was unsaturated for most temperatures. We have examined these data in an effort to derive a flat-field correction from the lamp data. However, efforts to normalize the variable lamp signal and model changes in the flat-field as a function of temperature were found not to improve the data beyond the existing lab-based calibration, and thus we have not made changes to the PDS data.
2. Calibration Data Overview and Analysis
Two “grain-of-wheat” incandescent stimulus lamps are included in the instrument and located on either side of the optical fiber input to the spectrograph. One lamp is optimized for the Si detector (the visible or VIS lamp) and the other optimized for the InGaAs detector (the near-infrared or NIR lamp). Each detector was read out 20 times for each lamp measurement, with an integration time of 2 sec for the NIR lamp and 1 sec for the VIS lamp. Two sets of dark measurements were collected during the calibration sequences as well, each with 20 observations and at the two integration periods; these provide a measure of the baseline dark current at nearly the same temperature as the visible and infrared lamp measurements. The averaged background is subtracted from the lamp measurements before evaluation of any multiplicative (gain) differences in the flat field as a function of temperature.
2.1. NIR lamp data
Shown in Fig. 1 are spectra collected by the Si and InGaAs detectors during a NIR lamp measurement. Although the file metadata (field name “NIR_LAMP_ON”) indicate that the lamp was activated for all 20 observations in a NIR lamp sequence, the data show that this was only the case for the first 13-14 observations [spectra 0-12 or 13]. All pixels of the InGaAs detector were found to be saturated for nearly all observations when the NIR lamp was used. There are two saturation effects in the detector electronics, caused by: 1) the analog-to-digital converter (ADC) and 2) finite pixel charge. The ADC encodes the analog signal from each pixel to 16 bit digital numbers (DN) in a range from -215 (-32768) to 215-1 (32767). A small offset (bias) is added to each channel to ensure that output values are always greater than the minimum. Each pixel can only record a finite amount of charge, and for the NIR detector this is 1.87x10⁸ electrons (e-). The charge conversion (a.k.a. “gain”) for both detectors is 1190 e-/DN; therefore, the maximum hypothetical value for the NIR channel would be 157143 DN (assuming a minimum output value of 0). This value exceeds the ADC saturation by a factor of ~2.4. For a signal greater than the ADC saturation level (215-1) but lower than the pixel saturation charge, the encoded value will “rollover” to the minimum encoded value. For example, adding 1 DN to the maximum level (215-1) will result in an encoded value of -215. This partially explains the disjointed structure seen in the NIR channel of Fig. 1, though it is unclear why saturated pixels sometimes assume a constant value of 0 DN and other times 32767 DN. We hypothesize that the non-saturated data seen in spectrum 13-16 in some NIR measurements is due to residual glow from the cooling lamp filament after power is removed. Because of the limited non-saturated data available for the InGaAs detector, we have not attempted to derive a flat-field correction at this time.


2.2. VIS lamp data
Shown in Fig. 2 are spectra collected by the Si and InGaAs detectors during a VIS lamp measurement. In this case, file metadata indicate that the VIS lamp was on for the first 14 observations (spectra 0-13) and then off. An average spectrum was created for each lamp measurement by averaging spectra 1-12, thereby excluding the first and last illuminated lamp observations to avoid any small intensity differences caused by lag between the command and the lamp response.
The dark-corrected signal from all lamp data for a single pixel as a function of detector temperature is shown in Figure 3. Depending on the position of the spacecraft, lamp observations were sometimes acquired while the instrument was warming, and other times when it was stable (no measured temperature change over the 20 second lamp measurement) or cooling. We have separated these data in Figure 3 to investigate whether these instrument states might result in a different detector response or even lamp brightness. All data show a fairly linear relationship between 10 and 30°C, above which the signal becomes nonlinear though generally monotonically increasing with temperature. We have identified a point in time after which the signal is generally stable, but before which was systematically lower (though increasing with time). To investigate this distribution further, we examined a single 1°C temperature bin, centered on 25°C (Fig. 4). The change in signal appears to have occurred between the primary and extended missions, in early 2012.
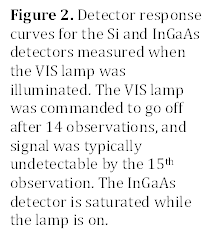


Figure 3. Lamp signal in pixel 100 over the full orbital mission and for all detector temperatures experienced. Blue and cyan points represent lamp measurements obtained when instrument was cooling; red and orange represent lamp measurements when the instrument was heating up. Lamp measurements colored orange and cyan were obtained during the primary mission; those colored red and blue were obtained during the extended missions.
![]()
![]()
![]()


Figure 4. Dark-corrected signal measured in a 1°C temperature bin, centered at 25°C. (A) Signal measured as a function of temperature. (B) Temperature as a function of time of observation. (C) Dark-corrected signal as a function of time of observation. Signal in the 25°C bin generally center around 3500, but occasionally drop to around 3200 across the whole temperature range. All mission phases experience the full range of temperatures within this bin, but the majority of the observations with signal well below 3500 occur during the primary mission.
3. Lamp-Based Flat Field Analysis
The distribution in Si signal seen in Figures 1 and 2 is characterized by the blackbody spectrum of the lamps modified by the spectral reflectance of the grating and beamsplitter and also by the detector sensitivity. Furthermore, the spectrum is displaced from the nominal wavelength scale due to the relative position of the lamps with respect to the input fiber. Additional structure in the spectrum is thought to be caused by uncharacterized scatter paths due to emission by the lamps across a much larger angular field than the f/5 beam from the fiber. The total output of the lamp varies over the course of the mission and so we have explored normalizing each lamp spectrum to its total, as well as normalizing to the coolest lamp spectrum. Both approaches effectively removed the offset in measured lamp signal between the nominal and extended missions described above (Fig. 5); however, neither were able to fully account for the scatter in the data at higher temperatures.


Figure 5. Normalized VIS lamp signal over the full orbital mission for three detector elements for all detector temperatures experienced.
The final radiometric sensitivity of the instrument was measured on the ground at a temperature of approximately 25°C, and so we choose flat-field spectra obtained at this temperature in flight as a reference. To derive a single spectrum, the 13 VIS lamp observations collected between 24.95°C and 25.05°C were averaged (Fig. 6a). Normalized counts, divided by the 25°C reference spectrum, for three pixels are presented in Figure 6B.
![]()
![]()


Figure 6. (A) Normalized lamp signal at 25°C. Average lamp signal (red) is plotted over all spectra obtained between 24.95°C and 25.05°C. Even in this small temperature bin, there are some small residual differences in the lamp spectrum. (B) Normalized lamp signal over the full orbital mission for three detector elements for all detector temperatures experienced divided by the average 25°C signal. For well-illuminated pixels, data follow a roughly linear trend through or beyond 40°C. The temperature at which the normalized signal diverges from linear depends on the total signal at that wavelength. For example, the normalized signal measured by pixel 300, which is at least 4x less light than measured by pixel 80, diverges from linear at 40°C, while the normalized counts measured by pixels 80 and 200 remain linear through temperatures greater than 50°C.
The flat-field correction for each pixel (normalized spectrum, divided by the 25°C reference spectrum) was examined as a function of temperature in order to derive an algorithm to model a flat-field correction factor at any given temperature. Several fitting algorithms were tested, the most successful of which were an exponential function that accounted for the curvature at high temperatures, and a simple linear function. Testing of the exponential algorithm using orbital data revealed that it introduced several clear artifacts into the spectra. Linear fits were conducted using only data below 40°C to avoid the curvature at high temperatures (Fig. 7).
Linear model results at five temperatures are presented in Figure 8. For the key wavelength range of the detector, the modeled correction for cooler temperatures is near unity. Shortwards of 400 nm, the model produces several high frequency spikes, which invert between lower and higher temperature. These spikes occur at wavelengths where current VIRS data have residual artifacts of unknown origin. As illustrated in Figure 9, the magnitude of these variations are relatively stable at low temperatures, but not at high temperatures. At 50°C, the model slightly underestimates the long and short wavelength correction and the explicit magnitude of the high-frequency features near pixel 50.


Figure 7. Examples of linear fits to the flat-field corrections as a function of temperature. Pixel 20 and 361 are the first and last pixels for which spectral data are delivered in the PDS (channels before and after these are delivered as zeros in the CDRs and DDRs. As can be seen from the data, the scatter at higher temperatures still heavily influences the linear fits to these data clouds. Pixels 80 and 200 are well-illuminated by the lamp spectrum, and are also very well-fit by a linear function.
![]()
![]()


Figure 8. Example flat-field correction curves constructed from the modeled fits at five temperatures. (A) Flat-field correction for the whole detector array as a function of pixel. (B) Flat-field correction as a function of wavelength for the spectral range typically used for VIRS data analysis. The key regions at which the Flat-field factor affects the data are below 380 nm and beyond 800 nm.
![]()
![]()
![]()


Figure 9. Example of the modeled flat-field factor at 10°C and 50°C compared to the measured flat-field correction for (A) lamps obtained between 9.99°C -10.01°C and (B) lamps obtained between 49.99°C-50.01°C. For most wavelengths, the 10°C modeled spectrum very closely reproduces the data. The modeled 50°C spectrum is, for most wavelengths, closer to 1 than the measured data, because the scatter in the measured data diverges in most cases toward higher and lower signal at high temperatures. Although this fit would slightly under-correct the shortest and longest wavelengths, it also leaves the high-signal region of the spectrum largely untouched, avoiding introducing spectral artifacts.
To test the correction, we identified two sets of spectra that overlap one another, each with one overlapping spectrum collected at a moderately low temperature, and the other overlapping spectrum collected at a high temperature. As illustrated in Figure 10, no obvious artifacts are introduced to the data, but there is very little change in the data from that already present in the DDRs. Thus, we have elected not to deliver a lamp-derived flat-field correction at this time. We note that further analysis of this dataset may lead to improvements in the quality of VIRS surface reflectance spectra.
![]()

![]()


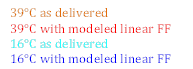
Figure 10. (A) Overlapping spectral observations ORB_11267_005226, measured at 39°C, and OB2_13030_080326, measured at 16°C, with and without flat-field correction. (B) Overlapping spectral observations ORB_11265_014759, measured at 42°C, and OB3_14016_015602, measured at 18°C, with and without flat-field correction. Flat-field corrections do not introduce any obvious artifacts, and provide a marginal improvement to the data beyond 850 nm for high temperatures. Note that the two sharp features present in the cool data in both examples occur at longer wavelengths (371 and 380 nm) than the high-frequency features in the flat-field correction (332-360 nm).