CRISM PERFORMANCE REPORT
Kevin J. Heffernan
Last Updated: December 9, 2005
Table of Contents
1.0 CRISM Analog Voltage Performance and Trending Analysis. 6
1.1 CRISM Voltages and Currents: 9
1.1.3 IR FPU +12/+7v current: 15
1.1.5 VNIR FPU +12/+7v current: 19
1.1.6 VNIR FPU +12 voltage: 19
1.1.9.1 Cooler +15v Loading Equation. 21
1.1.11 Heater 1 and 2 current: 25
1.1.12 Heater 3 and 4 current: 26
1.1.13 HOP 1 and 2 heater current: 27
1.1.14 Shutter motor current: 28
1.2 CRISM Thermal Control System.. 29
1.2.1.1 DPU, IR, VNIR, and Cooler LVPS temperatures 32
1.2.1.2 DPU Survive Temperature Sensors 1 and 2 Comparison. 33
1.2.2.1 Survive Temperature Sensors 1 and 2 Comparison. 35
1.2.3 Cryogenic Thermal Zone. 36
1.2.4 VNIR Detector Thermal Zone. 38
1.2.4.1 Comparison of VNIR Detector Temperature Sensor #1 and #2. 39
1.2.4.2 VNIR Detector Temperature and VNIR Heater Duty Cycle vs. Spectrometer Housing Temperature 40
1.2.5.1 Maximum Delta T among the six Optical Bench Thermal Zone Temperature Sensors 43
1.2.5.2 Comparison of the Integrating Sphere and Optical Bench. 44
1.2.6 Spectral Cavity Thermal Zone. 45
1.2.7 Cooler Radiator Thermal Zone. 49
1.2.7.1 Cooler Radiator Decontamination Heater Transient Response / Performance 51
1.2.8.1 Use of Baffle Temperature Sensor as Contingency for HOP Temperature Sensor Failure 54
1.2.9 Focal Plane Electronics / Cold Shield Zone. 54
1.2.9.1 Cold Shield Trim Heater Duty Cycle vs. FPE and Spectrometer Housing Temperatures 56
1.3 Flood and Sphere Lamps: 58
1.3.1.1 IR Flood Lamp #1 Level vs. IR FPE current at frame rate = 1 Hz: 58
1.3.1.2 IR Flood Lamp #1 Level vs. IR FPE current at frame rate = 3.75 Hz: 59
1.3.1.3 IR Flood Lamp #1 Level vs. IR FPE current at frame rate = 15 Hz: 60
1.3.1.4 IR Flood Lamp #1 Level vs. IR FPE current at frame rate = 30 Hz: 61
1.3.2.1 IR Flood Lamp #2 Level vs. IR FPE current at frame rate = 1 Hz: 62
1.3.2.2 IR Flood Lamp #2 Level vs. IR FPE current at frame rate = 3.75 Hz: 63
1.3.2.3 IR Flood Lamp #2 Level vs. IR FPE current at frame rate = 15 Hz: 64
1.3.2.4 IR Flood Lamp #2 Level vs. IR FPE current at frame rate = 30 Hz: 65
1.3.3.1 VNIR Flood Lamp #1 Level vs. VNIR FPE current at frame rate = 1 Hz: 66
1.3.3.2 VNIR Flood Lamp #1 Level vs. VNIR FPE current at frame rate = 3.75 Hz: 69
1.3.3.3 VNIR Flood Lamp #1 Level vs. VNIR FPE current at frame rate = 15 Hz: 70
1.3.3.4 VNIR Flood Lamp #1 Level vs. VNIR FPE current at frame rate = 30 Hz: 71
1.3.4.1 VNIR Flood Lamp #2 Level vs. VNIR FPE current at frame rate = 1 Hz: 72
1.3.4.2 VNIR Flood Lamp #2 Level vs. VNIR FPE current at frame rate = 3.75 Hz: 73
1.3.4.3 VNIR Flood Lamp #2 Level vs. VNIR FPE current at frame rate = 15 Hz: 74
1.3.4.4 VNIR Flood Lamp #2 Level vs. VNIR FPE current at frame rate = 30 Hz: 75
2.1 Cryo System Performance. 82
2.2.1 HOP Heater Powered On Times vs. Temperature. 87
2.3 Flood Lamp Constant Current Circuit. 89
Table of Figures
Figure 1.1.2-1: DPU +5v Current vs. VNIR Spectra Count 12
Figure 1.1.2-2: DPU +5v Current vs. IR Spectra Count and IR Binning. 13
Figure 1.1.2-3: DPU +5v Current vs. IR Filter, IR Binning, and IR Lossy, 15 Hz. 14
Figure 1.1.2-4: DPU +5v Current vs. IR Filter, IR Binning, and IR Lossy, 30 Hz. 14
Figure 1.1.4-1: Timeline of Shutter Motion vs. HK Conversion times. 16
Figure 1.1.4-2: IR +12v Voltage vs. Current including Five Shutter Motions. 18
Figure 1.1.9: Cooler +15v Voltage vs. Current, Cooler 3, 08-02-04. 21
Figure 1.1.9.1-1: Cooler +15v Voltage Monitor vs. Current – Initial CRISM Power-on. 22
Figure 1.1.10-1: Typical Home Sequence. 24
Figure 1.1.10-2: Torque Test, Cold Mapping, MRO TB Test 25
Figure 1.1.11-1: Heater 1 and 2 Current at Various Bus Voltages. 26
Figure 1.1.12-1: Heater 3 and 4 Current at Various Bus Voltages. 27
Figure 1.1.13-1: HOP Heater Current; One and Two Hop Heaters Powered; 28v. 28
Figure 1.2-1 CRISM Survive / Decontamination Heater Duty Cycle Flight Data. 31
Figure 1.2.1.1-1: Comparison of DPU Board Temperatures. 33
Figure 1.2.1.2-1 DPU Survive Temperature Comparison. 34
Figure 1.2.1.2-2 DPU Survive Temperature Sensor Comparison Survive Mode. 34
Figure 1.2.2.1-1 Comparison of the GME Survive Temperature Sensors. 35
Figure 1.2.2.1-2 Comparison of GME Survive Temperature Sensors – Survive Mode. 36
Figure 1.2.3-1: Comparison of IR Detector #1 and #2 Outputs. 37
Figure 1.2.4-1: VNIR Detector Temperature during the MRO TB Test 38
Figure 1.2.4.1-1: Comparison of the VNIR Detector Temperature Sensor #1 and #2. 39
Figure 1.2.4.2-1: VNIR Detector vs. Spectrometer Housing Temperature. 41
Figure 1.2.4.2-2 VNIR Duty Cycle vs. Spectrometer Housing Temperature. 42
Figure 1.2.5.2-1 Comparison of the Integrating Sphere and Optical Bench Temperatures. 45
Figure 1.2.6-1 Comparison of the IR and VNIR Spectral Cavity Temperatures from the MRO TB Test 46
Figure 1.2.6-2 CRISM Spect Housing S/C Monitored PRT during MRO TB Test 46
Figure 1.2.7-1 CRISM Monitored Cooler Radiator Temperature Sensor During the MRO TB Test 50
Figure 1.2.7-2 S/C Monitored Cooler Radiator Temperature Sensors During the MRO TB Test 51
Figure 1.2.7.1-1 Transient Response of the Cooler Radiator From Survive to Decontamination Mode 52
Figure 1.2.8-1 Comparison of Baffle and HOP Temperatures During MRO TB Test 53
Figure 1.2.8-2 Baffle Test Thermocouples During the MRO TB Test 53
Figure 1.2.8.1-1 Delta T Hop – Baffle Temperature, MRO TB Test 54
Figure 1.2.9-1: Focal Plane Electronics / Cold Shield Temperatures, MRO TB Test 56
Figure 2.1.1: Cooler Proportional - Integral Control Loop. 85
Figure 2.1.1-1: Cover Open Times vs. Temperature. 88
Figure 2.3-1: IR Flood Lamp Constant Current and Current Limit Circuit 90
Figure 2.3-2: VNIR Flood Lamp Current Drive Circuit 90
Table of Tables
1.0 CRISM Analog Voltage Performance and Trending Analysis
There are three types of analog voltages produced by CRISM: voltages, current, and temperatures. Voltages and currents are a function of load and will be trended at the various loads. Maximums, minimums, and the variation of the voltages and currents vs. load will be examined. Temperatures are a function of environment and test setup. The temperature excursions during the MRO Thermal balance test which is the closest approximation to what will be seen in flight are presented. In addition, the following is presented:
1) The readings of redundant CRISM monitored temperature sensors are compared,
2) The readings of CRISM monitored temperature sensors that read nearly the same temperature (e.g. the 4 DPU LVPS board temperatures) are compared,
a) In some cases, the relationship between two temperature sensors is determined to be used for contingency purposes (e.g. integrating sphere and optical bench)
3) The readings of redundant S/C monitored (survive) temperature sensors are compared,
a) The temperature sensor that controls the survive heater is determined
4) The readings of collocated S/C and CRISM monitored temperature sensors are compared.
5) Subassembly thermal time constants are determined
This data supplements the spreadsheet put together by Melissa Wirzburger that has the temperature predicts for each of the various mission phases for many of the temperature channels.
The CRISM status telemetry files have been downloaded into a database called Utopia. This database has been used to analyze the status data for trending purposes.
There are four discrete periods of time in the database, Pre-environmental (Time £ 8/14/04), Environmental (8/15/05 £ Time £ 9/08/04), Post-environmental (9/13/04 £ Time £ 9/24/04), nd Post rework (12/27/04 £ Time £ 12/31/04). All of these data was taken on GSEOS at while the instrument was at APL. CRISM was delivered to LMA in late September, 2004 and returned in early November, 2004 to replace all of its ACTEL FPGAs. CRISM was redelivered to LMA on January 10th, 2005.
Data is available from the testing performed at LMA as well. The data set that was used for the specific trending products will be defined in the memo.
During the testing at APL, there were some tests that included just the flight DPU or just the EM DPU with the test set. These data are included in the database as well. Every attempt has been made to understand the configuration of the test for the data used in this trending analysis using the log books.
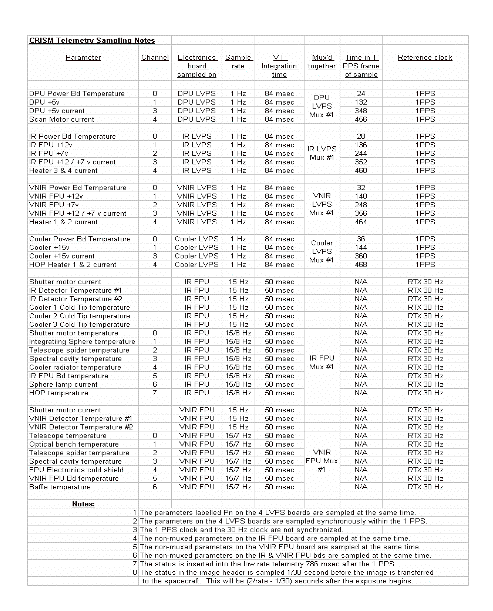
The analog voltages are sampled on 6 different electronics boards in the CRISM instrument. Each is sampled using voltage to frequency converters. The relevant information regarding the sample rates, integration times, which channels are multiplexed together, where the sample occurs within the 1 PPS, etc. are summarized in Table 1.0-1. The currents and voltages that are sampled on the LVPS boards are sampled synchronously to the 1 PPS clock provided by the S/C. The parameters sampled in the Focal Plane Electronics boards are not synchronous to the 1 PPS clock. The effect of this is that one parameter may reflect the previous instrument state while other parameters may reflect the current instrument state. Examples of this are given below.
· Change in a flood lamp setting vs. FPE current
· Moving the shutter (depending on the move may not see the current at all)
· Powering the VNIR heater
· Changing the frame rate effects the DPU +5v current reading
The initial frame of status telemetry often contains erroneous values and should be disregarded. By the second status telemetry frame, the data is accurate.
Finally, there are effects due to the frame rate on various Housekeeping (HK) parameters. This effect has been studied and the effects are for the most part removed in the database. Most of the data presented in this report use the corrected values in the data base.
Table 1.0-1: CRISM Telemetry Sampling Table
1.1 CRISM Voltages and Currents:
There are a total of 6 voltages and 11 currents monitored in CRISM telemetry. The 6 voltages are the secondary outputs of the four low voltage power supplies (LVPS) in the DPU. The four secondary side LVPS currents are also monitored. In addition to providing the secondary voltages, each of these supplies has two solid state switches which are used to switch in heaters and the GME. The currents through the two switches on each supply are summed and monitored as well. The remaining three currents are monitored in the Focal Plane Electronics (FPEs), 2 in the IR FPE and 1 in the VNIR FPE. The Shutter motor can be controlled by either the IR or the VNIR FPE (or both). The shutter motor current is monitored by both FPEs. The 11th current monitor is the IR Sphere lamp current.
Table 1.1-1 below details the voltage outputs and the switchable loads that are telemetered for each of the LVPSs and the currents monitored in the FPEs.
Table 1.1-1: Voltages and currents monitored and location of the monitor
|
Board |
LVPS Voltages Monitored |
LVPS Currents monitored |
FPE Currents monitored |
|||
|
|
|
|
|
|
|
|
|
DPU LVPS |
+5v |
|
+5v current |
GME current |
|
|
|
IR LVPS |
+12v |
+7v |
+12/+7v current |
Heater 3 & 4 current |
|
|
|
VNIR LVPS |
+12v |
+7v |
+12/+7v current |
Heater 1 & 2 current |
|
|
|
Cooler LVPS |
+15v |
|
+15v current |
HOP Heater 1 & 2 current |
|
|
|
IR FPE |
|
|
|
|
Shutter motor current |
IR Sphere Lamp current |
|
VNIR FPE |
|
|
|
|
Shutter motor current |
|
The six voltage monitors are each loaded down by the current being drawn. This is a consequence of the grounding path for the monitor, a problem that was found too late to fix.
Table 1.1-2 below gives the minimum and maximums seen prior to delivery for each of the six voltages. Table 1.1-3 gives the minimum and maximums seen prior to delivery for each of the 11 currents.
Table 1.1-2: Minimum and maximum recorded voltages levels
|
Voltage |
Min |
Max |
Comments |
|
|
|
|
|
|
DPU +5v |
4.81 (08-23-04) |
5.06 (08-19-04) |
|
|
IR +12v (uncorrected) |
7.145 (08-09-04) |
12.36 (08-22-04) |
|
|
IR +7 v (uncorrected) |
6.78 (09-05-04) |
7.14 (08-22-04) |
|
|
VNIR +12v (uncorrected) |
7.47 (07-30-04) |
12.13 (08-21-04) |
|
|
VNIR +7 v (uncorrected) |
6.75 (07-30-04) |
6.98 (08-12-04) |
|
|
Cooler +15v (uncorrected) |
10.04 (08-02-04) |
15.68 (07-31-04) |
Occurred during CRISM TB test when Cooler 3 level was set to “0” due to overflow in cooler loop. |
Table 1.1-3: Minimum and Maximum recorded current levels
|
Current |
Minimum |
Maximum |
Comments |
|
|
|
|
|
|
DPU +5v |
0.800 |
1.60 |
|
|
IR FPE +12v / +7v |
0 |
1.04 |
|
|
VNIR FPE +12v / +7v |
0 |
1.20 |
|
|
Cooler +15v |
0 |
0.71 |
Cooler 3 on 8/2/04. |
|
Scan System |
0 |
1.15 |
|
|
Heater 1 & 2 (VNIR) |
0 |
0.571 |
|
|
Heater 3 & 4 (IR) |
0 |
0.556 |
|
|
HOP Heater 1 & 2 |
0 |
0.213 / 0.426 |
33 v; one / two heaters powered |
|
Shutter Motor (IR) |
0 |
???? |
|
|
Shutter Motor (VNIR) |
0 |
???? |
|
|
IR Sphere Lamp |
0 |
0.152 |
|
1.1.1 DPU +5v voltage:
Data from all four periods of time at APL and the TB test at LMA were looked at for this analysis. The DPU +5v ranged from a minimum of 4.81 volts to a maximum of 5.06 volts as shown in Table 1.1.1-1 below. Data from both the engineering model and the flight DPUs are included in the database and thus in the table. These data include before and after the ACTELs were changed out and data on the S/C bus which runs at a higher voltage than we normally tested.
Table 1.1.1-1: DPU +5v Minimum and maximum voltages
|
Time frame |
Min voltage |
Max voltage |
|
|
|
|
|
7/24/04 to 8/15/04 |
4.81 |
5.04 |
|
8/15/04 to 9/8/04 |
4.81 |
5.06 |
|
9/13/04 to 9/24/04 |
4.83 |
5.00 |
|
12/27/04 to 12/30/04 |
4.84 |
4.95 |
|
2/8/05 to 2/19/05 |
4.83 |
4.99 |
|
|
|
|
1.1.2 DPU +5 volt current:
Data from all four periods of time at APL were looked at for this analysis. The current on the flight unit varied from 800 mA (just after DPU is booted at cold temperature) to 1.6 amps (taking data at 30 Hz) over the time period. Data included both flight and EM tests at different temperatures in different configurations. Currents from 0.6 to 0.8 amps were recorded on 8/12 and from 8/19 through 8/22. Both the flight and EM DPUs were being used during these days. Data from the final DPU functional test in December after the ACTELs were replaced showed minimum +5v currents of 800 mA, 825 mA, and 850 mA at cold, room, and hot temperature respectively. These data were selected as the minimum current draw. The +5v current runs lower in the EM due to the non-flight ACTELs.
The DPU +5v current is sampled synchronously relative to the 1 PPS spacecraft clock. The current varies over the detector frame sampling period due to the processing in the pipeline ACTEL. The DPU +5v current changes levels anytime the frame rate, filter, binning, or lossy parameters are changed and some of the time when the spectral count is restarted. The detector frame rate can be 1 Hz, 3.75 Hz, 15 Hz, or 30 Hz. The detector frame is not synchronous to the 1 PPS period. The command to change frame rates or start a new collection of spectra is sent from the DPU to the FPUs on the next 30 Hz clock pulse. As a result, the DPU +5v current can seem to vary rather substantially from second to second.
The range of the DPU +5v current for each of the frame rates is given in the Table 1.1.2-1.
Table 1.1.2-1: Range of DPU +5v current vs. frame rate
|
Frame Rate |
1 Hz |
3.75 Hz |
15 Hz |
30 Hz |
|
|
|
|
|
|
|
Minimum |
0.99 |
1.00 |
1.13 |
1.28 |
|
Maximum |
1.44 |
1.47 |
1.52 |
1.60 |
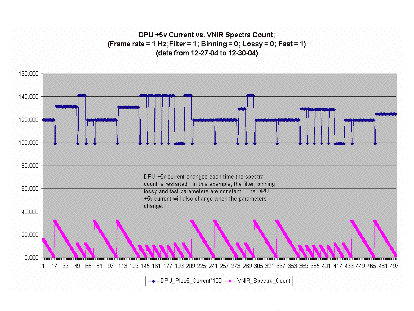
Figure 1.1.2-1 below shows how the DPU +5v current changes some of the time when the spectra count is restarted. These data were taken at 1 Hz.
Figure 1.1.2-1: DPU +5v Current vs. VNIR Spectra Count
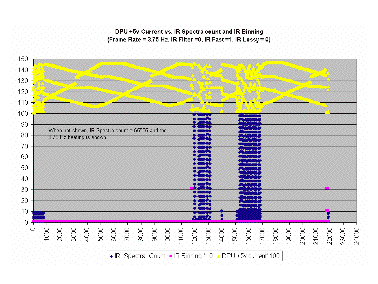
At 3.75 Hz, the DPU +5v current repeats every 4 seconds assuming that the spectra and the parameters are not reset. Figure 1.1.2-2 illustrates that effect.
Figure 1.1.2-2: DPU +5v Current vs. IR Spectra Count and IR Binning
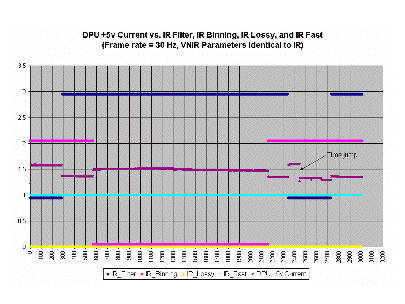
The two graphs below shows the DPU +5v current vs. IR Filter, IR Binning, and IR Lossy for Frame rates of 15 and 30 Hz. The graphs show how the current changes with the parameters.
Figure 1.1.2-3: DPU +5v Current vs. IR Filter, IR Binning, and IR Lossy, 15 Hz
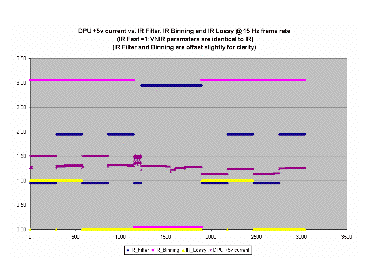
Figure 1.1.2-4: DPU +5v Current vs. IR Filter, IR Binning, and IR Lossy, 30 Hz
1.1.3 IR FPU +12/+7v current:
The IR FPU +12/+7v current is on the secondary side of the IR LVPS and thus does not vary as a function of bus voltage. It does vary with which loads are powered and varies to a small degree with frame rate. It does not vary as a function of binning, wave table, or compression mode as that computation is performed on the Focal Plane interface board in the DPU.
Table 1.1.3-1 below gives the delta current as a function of load and frame rate.
Table 1.1.3-1: IR FPU +12/+7v current vs. load
|
|
Total current (amps) |
Delta current (amps) |
Comment |
|
Initial pwr on (no loads) |
0.240 ± 0.015 |
|
|
|
IR Detector on 1 Hz |
0.375 ± 0.015 |
|
|
|
IR Detector on 3.75 Hz |
0.375 ± 0.015 |
|
|
|
IR Detector on 15 Hz |
0.385 ± 0.015 |
|
|
|
IR Detector on 30 Hz |
0.395 ± 0.015 |
|
|
|
Shutter motor LED on |
|
0.010 |
|
|
Shutter motor on |
|
0 to 0.580 |
May or may not see current draw. See shutter current discussion for details. Peak delta current seen is 0.570 amps. |
|
Flood lamp on |
|
(0.77*Level) / 32764 |
|
|
Sphere lamp on |
|
0.102 / 0.107 |
Peak = 0.152 amps for 1 frame. Nominal current = 0.102 (goal = 1400) or 0.107 amps (goal = 4000). |
|
TOTAL CURRENT |
Pick one from above |
Sum all that apply |
|
1.1.4 IR FPU +12 voltage:
The IR FPU +12v voltage has very good load regulation however the +12v voltage monitor tends to sag with the load current. A correction to negate the sag has been put in place. The correction at this time is shown in equation 1 below. Check the CRISM CM website for the latest equation.
IR +12v = -4.0117 * (IR +12v current) + 12.193 (1)
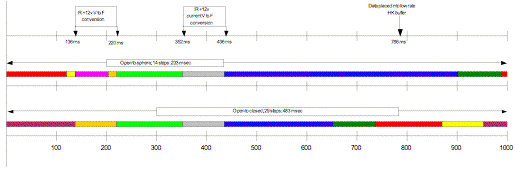
This correction works well for the steady state loads (detector, lamps, shutter LED). It does not work as well, however, with the transient shutter motor load due to the asynchronous sampling scheme on CRISM. While the +12v voltage and current are sampled at deterministic times in the 1 Hz S/C frame, the shutter motor commands can occur randomly within the 1 Hz S/C frame. The shutter stepper motor is operated at 60Hz and thus will take 0.233 to 0.483 seconds to move the 14 or 29 steps between the open, sphere, and closed positions. The timeline in Figure 1.1.4-1 below gives the V to F conversion times for the IR +12v voltage and IR +12v current and the time when the HK data is frozen in the low rate telemetry buffer. It also shows the movement time for open to sphere and open to closed movements which can start anytime within the second. The result is that the motion can occur during the full V to F conversion window, during part of the window or fully outside of the window and it can be different for the +12v voltage and current windows. The only time when the conversion is correct is when the motion occurs during the full V to F conversion for both the +12v voltage and current conversions which does not occur at all for the 14 step motion and only 18.3% of the time (brown color) for the 29 step motion. Table 1.1.4-1 below gives the times, the effect, and the color codes.
Figure 1.1.4-1: Timeline of Shutter Motion vs. HK Conversion times
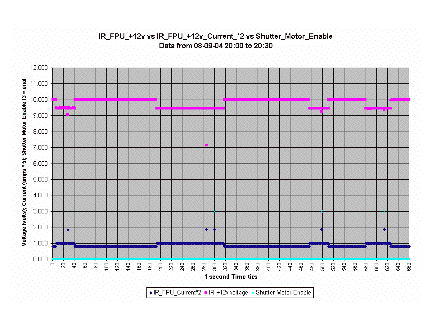
A good example of this is in the plot below. This data was taken from 8/9/04 during the peak current test. The shutter was at Position 0 and was being commanded to the “Home” position which forces it to move 32 steps for ~ 0.5 seconds. This was done to have a better chance to capture the current. Figure 1.1.4-2 below shows 5 such movements. Three parameters are plotted, IR FPU +12v current (x2), IR FPU +12v voltage, and shutter motor enable which reads “3” while it is moving. On all 5 movements, the current was recorded at a consistent 0.92 amps (current is doubled on the graph for clarity). On four of the movements, the shutter enable read “3” and the IR FPU +12v voltage read 5 different values. What is happening is that the 483 msec shutter motion starts just before, during, or after the IR FPU +12v voltage V to F conversion. The IR +12v voltage sags while the shutter is moving and is the lowest when the motion starts before the V to F integration time, is not as low when the motion starts during the V to F integration time, and has no effect when the motion starts after the V to F integration time. During the motion in which the +12v sags the most (motion starts the earliest), the motion is completed before the data is frozen in the HK buffer at 786 msec and the shutter motor enable reads “0”.
The maximum and minimum voltages recorded prior to delivery are listed in Table 1.1-2.
Table 1.1.4-1: Times, Effect, and Color Code Definition for Shutter Motion in Figure 1.1.4-1
|
14 step move starts between (msec) |
Motion occurs during entire, part of, or none of V to F conversion window |
29 step move starts between (msec) |
|||||||
|
+12v voltage |
+12v current |
||||||||
|
T1 |
T2 |
Entire |
Partial |
None |
Entire |
Partial |
None |
T1 |
T2 |
|
987 |
119 |
X |
|
|
|
|
X |
737 |
869 |
|
119 |
136 |
X |
|
|
|
X |
|
869 |
953 |
|
136 |
203 |
|
X |
|
|
X |
|
|
|
|
|
|
X |
|
|
X |
|
|
953 |
136 |
|
203 |
220 |
|
X |
|
X |
|
|
136 |
220 |
|
220 |
352 |
|
|
X |
X |
|
|
220 |
352 |
|
352 |
436 |
|
|
X |
|
X |
|
352 |
436 |
|
436 |
903 |
|
|
X |
|
|
X |
436 |
653 |
|
903 |
987 |
|
X |
|
|
|
X |
653 |
737 |
Figure 1.1.4-2: IR +12v Voltage vs. Current including Five Shutter Motions
1.1.4 IR FPU +7 voltage:
The IR FPU +7v voltage also has very good load regulation and the +7v voltage monitor does not tend to sag as much with the load current. A correction to negate the sag has been put in place. The correction at this time is shown in equation 2 below. Check the CRISM CM website for the latest equation.
IR +7v = -0.1776 * (IR +7v current) + 6.9828 (2)
The maximum and minimum voltages recorded prior to delivery are listed in Table 3.
1.1.5 VNIR FPU +12/+7v current:
The VNIR FPU +12/+7v current is on the secondary side of the VNIR LVPS and thus does not vary as a function of bus voltage. It does vary with which loads are powered and varies to a small degree with frame rate. It does not vary as a function of binning, wave table, or compression mode as that computation is performed on the Focal Plane interface board in the DPU.
Table 1.1.5-1 gives the delta current as a function of load and frame rate.
Table 1.1.5-1: VNIR +12v / +7 volt current draw vs. load
|
|
Total current (amps) |
Delta current (amps) |
Comment |
|
Initial power on (no loads) |
0.225 ± 0.015 |
|
|
|
VNIR Detector on at 1 Hz |
0.350 ± 0.015 |
|
|
|
VNIR Detector on at 3.75 Hz |
0.350 ± 0.015 |
|
|
|
VNIR Detector on at 15 Hz |
0.360 ± 0.015 |
|
|
|
VNIR Detector on at 30 Hz |
0.370 ± 0.015 |
|
|
|
VNIR Heater on |
|
0.120 ± 0.10 |
|
|
Shutter motor LED on |
|
0.010 |
|
|
Shutter motor on |
|
0 to 0.xxx |
May or may not see current draw. See shutter current discussion for details. Peak delta current seen is 0.xxx amps. |
|
Flood Lamp #1 |
|
0.992 * (Level) / 32764 |
|
|
Flood Lamp #2 |
|
0.976 * (Level) / 32764 |
|
|
Sphere lamp |
|
??????
|
|
|
Total current |
Pick one from above |
Sum all that apply |
|
1.1.6 VNIR FPU +12 voltage:
The VNIR FPU +12v voltage has very good load regulation however the +12v voltage monitor tends to sag with the load current. A correction to negate the sag has been put in place. The correction at this time is shown in equation 3 below. Check the CRISM CM website for the latest equation.
VNIR +12v = -4.1258 * (IR +12v current) + 12.223 (3)
This correction works well for the steady state loads (detector, lamps, shutter LED). It does not work as well, however, with the transient shutter motor load due to the asynchronous sampling scheme on CRISM. See the description in the IR +12v section for details as to why this occurs.
1.1.7 VNIR FPU +7 voltage:
The VNIR FPU +7v voltage also has very good load regulation and the +7v voltage monitor does not tend to sag as much with the load current. A correction to negate the sag has been put in place. The correction at this time is shown in equation 2 below. Check the CRISM CM website for the latest equation.
VNIR +7v = -0.1795 * (VNIR +7v current) + 6.9713 (4)
The maximum and minimum voltages recorded prior to delivery are listed in Table 3.
1.1.8 Cooler +15v current:
The maximum Cooler +15v current recorded was 0.71 amps (Cooler 3 in the OCF on 8/2/04). The minimum cooler current recorded was 0.2 amps (Cooler 3, CRISM TB Test, 9/5/04, cooler level = 1620 due to overflow problem in cooler loop). This was not a realistic situation. The current profile for a cooler cool down is given in Section 2.1.
1.1.9 Cooler +15 voltage:
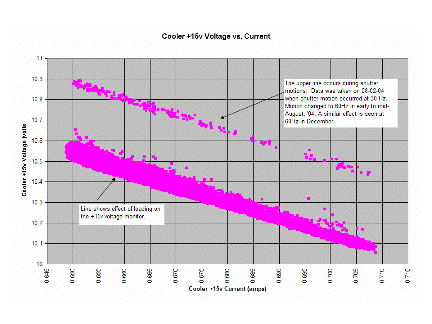
The +15v voltage is on the secondary side of the Cooler LVPS and thus does not vary as a function of bus voltage. The +15v voltage monitor also is loaded down by the current draw. The actual +15v voltage has very good load regulation and is affected very little by the current draw. The lowest voltage value that was seen on the voltage monitor was 10.04 volts on 8/02/04.
Figure 1.1.9-1 shows the effect of the loading of the voltage monitor. It also shows double parallel lines on the Cooler +15v monitor. The second line occurs when the shutter moves.
Figure 1.1.9: Cooler +15v Voltage vs. Current, Cooler 3, 08-02-04
Due to the large surge current in the cooler electronics, the order of powering up a cooler is to close the switch for the selected cooler (switch is located on the secondary side of the Cooler LVPS) and then power on the Cooler LVPS. Data early in the integration of CRISM before this change was made will show the +15v high with no current draw. The change was made to the source code on 08/20/04. It was loaded into the DPU on 08/29/04.
1.1.9.1 Cooler +15v Loading Equation
Figure 1.1.9.1-1 shows the Cooler +15v voltage vs. current for the first flight power-on on 08-30-05. A linear fit to the data is also shown in the figure. A series of these plots have been made for different coolers and times. The slopes and offsets for each of these are listed in Table 1.1.9.1-1.
Figure 1.1.9.1-1: Cooler +15v Voltage Monitor vs. Current – Initial CRISM Power-on
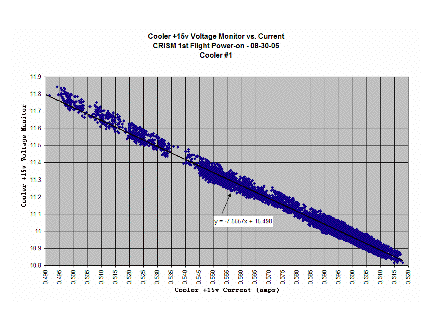
Table 1.1.9.1-1: Cooler Voltage vs. Current Loading Transfer Function for Various Tests
|
Date |
Cooler # |
Slope |
Offset |
Comment |
|
08/02/04 |
3 |
-7.8041 |
15.602 |
|
|
9/xx/04 |
1, 2, 3 |
-6.6493 |
15.263 |
3 data points; equation used in Utopia; data taken to correct voltage sag |
|
09/05/04 |
3 |
-7.34389 |
15.40462 |
|
|
12/27/04 |
|
|
|
|
|
2/xx/05 |
|
|
|
|
|
08/30/05 |
1 |
-7.5557 |
15.49833 |
|
1.1.10 Scan Motor current:
The scan motor or GME input current is limited by software to 1.23 amps in all modes when autonomy is in place. This limit can be raised significantly if necessary.
Data from all four periods plus the S/C TB test were reviewed for the peak current draw. Peak currents occur when the gimbal is “Homed”, reaches the stop and temporarily stalls. Currents from the peak current test at 22 volts, the ACTEL floating point failure tests, and DPU only tests were thrown out. The maximum real current draw was 1.15 amps on 8/10/04. The peak current in the OCF in December, 2004 was 0.92 amps. The peak currents during the Functional test in the TV chamber prior to the S/C TB test were 1.05 amps. During the cold and hot mapping part of the S/C TB Test, the maximum current during the Home was 0.945 and 0.95 amps respectively which are more representative of flight conditions.
The maximum current draw overall was 1.64 amps with the monitor response disabled on 8/9/04 during the peak current test in the OCF at 22 volts. Again, in this test, the scan motor was stalled on purpose to measure the stall current. Since this current is on the primary side of the DC/DC converter, that would equate to 1.29 amps at 28v and 1.13 amps at 32 volts. These currents are similar to what we have been seeing at those bus voltages. The Table 1.1.10-1 below has the peak currents and the conditions that they were taken under.
Table 1.1.10-1: Peak Scan Motor Currents
|
Peak Scan Motor current |
Date |
Time to complete (seconds) |
Tests (all during Gimbal “Home” maneuvers) |
Comments
|
|
|
Valid |
Invalid |
|
|
|
|
|
|
1.62 |
8/9/04 |
|
Peak current |
@ 22 volts |
|
1.15 |
|
8/10/04 |
38 |
Pre-env Cal |
Used ±90° stops |
|
|
1.33 |
8/17/04 |
37 |
EMI test |
On non-flat plate. Had to modify drive gains and balance weights. |
|
|
1.47 |
8/23/04 |
|
Peak current |
@ 22 volts |
|
|
1.26 |
9/16/04 |
38 |
Post-env test |
Floating Point ACTEL issue |
|
1.14 |
|
9/23/04 |
|
Post FP ACTEL replacement |
Used ±90° stops |
|
1.05 |
|
2/12/05 |
35 |
Pre-S/C TB functional |
Most representative data. Bus voltage at 32 volts or higher. |
|
0.945 |
|
2/19/05 |
43 |
Cold mapping functional |
|
|
0.95 |
|
2/22/05 |
43 |
Hot mapping functional |
|
|
1.03 |
|
5/12/05 |
27 |
|
|
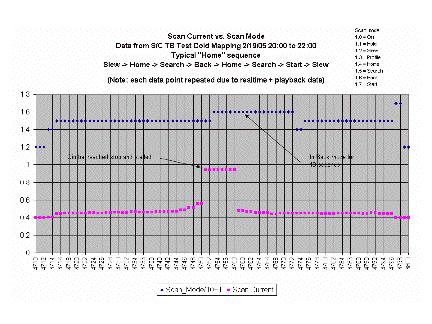
Figure 1.1.10-1 below shows a typical Home sequence with the Scan mode changing from Slew -> Home -> Search -> Back -> Home -> Search -> Start -> Slew. The scan system starts in the Slew mode and then receives the Home command and switches to the Home mode briefly. It then changes to “Search” mode and moves toward the stop. The gimbal reaches the stop and stalls and the mode changes to “Back” for 10 seconds (20 seconds in the graph due to combined realtime and playback data). The peak current occurs at the stall when the gimbal reaches the stop. The gimbal starts back toward Nadir. After the 10 seconds is complete, the mode switches briefly to “Home” and then to “Search”. When the fiducial is found, the mode switches to “Start” and finally back to “Slew”. The peak current in this case was 0.945 amps. The total time to complete the motion was 43 seconds.
Figure 1.1.10-1: Typical Home Sequence
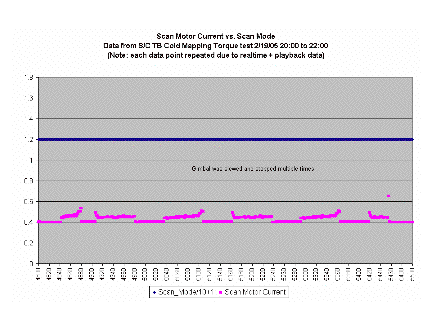
Two torque tests were run during the S/C TB Test, one during cold mapping and one during warm mapping. The cold mapping response is shown in Figure 1.1.10-2. The gimbal is slewed multiple times and from this motion, the torque is determined. Note that the currents are generally between 0.4 and 0.6 amp. The warm mapping torque test which occurred on 2/22/05, have nearly identical currents.
Figure 1.1.10-2: Torque Test, Cold Mapping, MRO TB Test
1.1.11 Heater 1 and 2 current:
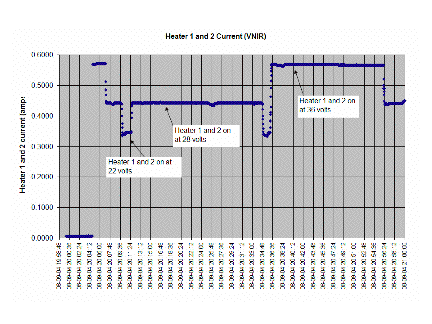
There are 4 trim heaters in the CRISM instrument each of which is ~125W. Heaters 1 and 2 which are located on the cold shield of the Gimbal Electronics Housing are switched in the VNIR LVPS board. The current from these two heaters is summed together and reported in the VNIR Heater 1 and 2 current channel. The nominal current draw per heater at 28v is ~0.124 amps. Figure 1.1.11-1 shows the results from a test in which both heaters were powered on at 22 volts, 28 volts, and 36 volts.
Figure 1.1.11-1: Heater 1 and 2 Current at Various Bus Voltages
1.1.12 Heater 3 and 4 current:
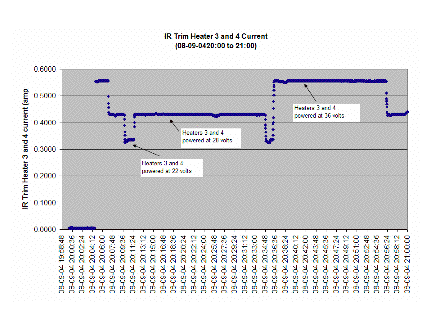
Trim heaters 3 and 4 which are located on the Cooler Radiator and the Spectrometer Housing respectively, are switched on the IR LVPS board. The current from these two heaters is summed together and reported in the IR Heater 3 and 4 current channel. The nominal current draw per heater at 28v is ~0.124 amps. The graph below shows the results from a test in which both heaters were powered on at 22 volts, 28 volts, and 36 volts.
Figure 1.1.12-1: Heater 3 and 4 Current at Various Bus Voltages
1.1.13 HOP 1 and 2 heater current:
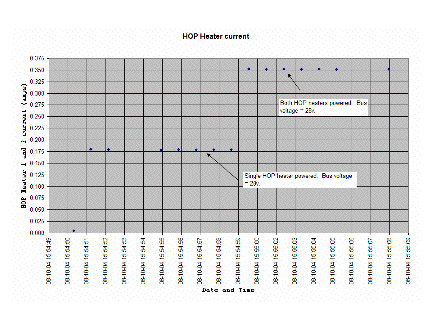
The HOP has two redundant heaters each of which are ~ 155W. CRISM has the capability to power both HOPs simultaneously however, Starsys, the HOP manufacturer, recommends not doing that. Both HOP heaters would be powered as a last resort if the cover does not open powering one HOP Heater at a time. The data in the graph below is from the CRISM functional test when the HOP was powered for a few seconds to verify the current. A single HOP heater should draw ~ 28 / 155 = 0.180 amps. As seen below, both HOP heaters were powered together for a few seconds to prove that simultaneous powering of the heaters would work. Simultaneous powering of both HOP heaters for a few seconds does not damage the HOP.
Figure 1.1.13-1: HOP Heater Current; One and Two Hop Heaters Powered; 28v
1.1.14 Shutter motor current:
The shutter motor was clocked at 30 Hz up to some time in early August, 2004. At that time the clock rate was changed to 60 Hz. The largest number of steps that the shutter can take is 32. Normally the shutter is commanded to move between four different positions, Home (Position 0), Open (Position 3), Sphere (Position 17), and Closed (Position 32). These motions normally take between 0.25 and 0.5 seconds at 60 Hz.
The shutter motor current is sampled at 15 Hz on both the IR and the VNIR sides. The data from the most recent sample is inserted into the low rate housekeeping at 786 msec into the 1 second frame. Although an exhaustive search has not yet been conducted, there has been no evidence of shutter motor current being detected in the low rate housekeeping while the shutter motor is moving. If the shutter begins its motion at the frame boundary, the motion will have been completed prior to the 786 msec mark and no current would be detected.
1.2 CRISM Thermal Control System
There are a total of nine thermal zones on the CRISM instrument. To monitor the temperature in these zones, 32 temperature sensors are included, 25 of which are monitored in CRISM telemetry and seven monitored in S/C telemetry. In addition, there are a total of 13 heaters on the CRISM instrument and three mechanical coolers. The location of each temperature sensor and heater is in a file on the CRISM CM website (reference file name here).
Table 1.2-1 below has a list of heaters, whether each is controlled by CRISM or the S/C, the heater resistance, and the type (survive, decontamination, trim, VNIR, or HOP).
Table 1.2-2 below has a list of temperature sensors, whether each is monitored by CRISM (DPU, IR, or VNIR) or the S/C, whether it is part of a thermal control loop, or a monitor only, and finally, whether it triggers an autonomy response if a temperature threshold is exceeded. Those temperatures that will be used in control loops and will trigger autonomy rule action are examined more closely. The table is shaded to show the nine heater zones.
Each thermal zone is discussed. A plot of each temperature vs. time taken during the S/C TB test in February, 2005 is presented. The temperature excursions for each represent nominally the excursions that will be seen in flight.
Table 1.2-1: Heater locations, resistance, types, S/C or CRISM controlled
|
Heater location |
Resistance |
Type |
Controlled By |
|
|
S/C |
CRISM |
|||
|
DPU side |
40.4 |
S/C Survive |
X |
|
|
DPU side |
40.4 |
S/C Survive |
X |
|
|
GME top |
48.4 |
S/C Survive |
X |
|
|
GME top |
48.4 |
S/C Survive |
X |
|
|
Cooler radiator |
18.3 |
S/C Survive / Decontamination |
X |
|
|
Cooler radiator |
125 |
Trim |
|
X |
|
Spectrometer housing |
24.2 |
S/C Survive / Decontamination |
X |
|
|
Spectrometer housing |
125 |
Trim |
|
X |
|
Cold plate |
125 |
Trim |
|
X |
|
Cold plate |
125 |
Trim |
|
X |
|
VNIR detector |
95 |
CRISM Survive |
|
X |
|
HOP |
155 |
Actuator |
|
X |
|
HOP |
155 |
Actuator |
|
X |
Table 1.2-2: Temperature sensors on CRISM
|
Temperature sensor location |
Sensor type |
Monitored By |
Control loop |
Monitor only |
Autonomy rule action |
|
|
CRISM |
S/C |
|||||
|
DPU LVPS Bd. |
AD590 |
DPU |
|
|
X |
|
|
IR LVPS Bd. |
AD590 |
DPU |
|
|
X |
X |
|
VNIR LVPS Bd. |
AD590 |
DPU |
|
|
X |
X |
|
Cooler LVPS Bd. |
AD590 |
DPU |
|
|
X |
X |
|
DPU Survive #1 |
AD590 |
|
X |
X |
|
|
|
DPU Survive #2 |
AD590 |
|
X |
X |
|
|
|
GME Survive #1 |
AD590 |
|
X |
X |
|
|
|
GME Survive #2 |
AD590 |
|
X |
X |
|
|
|
IR Detector #1 |
2N2222 |
IR |
|
|
X |
X |
|
IR Detector #2 |
2N2222 |
IR |
|
|
X |
X |
|
Cooler #1 |
DT670 |
IR |
|
X |
|
X |
|
Cooler #2 |
DT670 |
IR |
|
X |
|
X |
|
Cooler #3 |
DT670 |
IR |
|
X |
|
X |
|
VNIR Detector #1 |
2N2222 |
VNIR |
|
X |
|
X |
|
VNIR Detector #2 |
2N2222 |
VNIR |
|
|
X |
X |
|
Shutter motor |
1K PRT |
IR |
|
|
X |
|
|
Integrating Sphere |
1K PRT |
IR |
|
|
X |
|
|
Telescope spider |
1K PRT |
IR |
|
|
X |
|
|
Telescope |
1K PRT |
VNIR |
|
|
X |
|
|
Optical Bench |
1K PRT |
VNIR |
|
|
X |
|
|
Telescope spider |
1K PRT |
VNIR |
|
|
X |
|
|
Spectral cavity |
DT670 |
IR |
|
X |
|
|
|
Spectral cavity |
DT670 |
VNIR |
|
|
X |
|
|
Spectral cavity survive |
2.5K PRT |
|
X |
X |
|
|
|
Cooler radiator |
1K PRT |
IR |
|
X |
|
|
|
OSU Survive #1 |
AD590 |
|
X |
X |
|
|
|
OSU Survive #2 |
AD590 |
|
X |
X |
|
|
|
HOP |
1K PRT |
IR |
|
|
X |
X |
|
Baffle |
1K PRT |
VNIR |
|
|
X |
|
|
Cold plate |
1K PRT |
VNIR |
|
X |
|
|
|
IR FPU |
DT670 |
IR |
|
|
X |
X |
|
VNIR FPU |
DT670 |
VNIR |
|
|
X |
X |
Table 1.2-3 shows the duty cycles for the heaters in cruise and during the initial CRISM Power up on 8/30/05. Figure 1.2-1 shows a graph of the S/C controlled heater duty cycles for the first 107 days of the mission.
Table 1.2-3: Heater Duty Cycles Post Launch
|
Heater |
Cruise Survive |
Cruise Decontamination |
Operational 08/30/05 |
|
DPU Survive |
20% |
|
|
|
GME Survive |
0 to 9% |
|
|
|
Cooler Radiator |
64% |
|
|
|
|
100% |
||
|
Spectrometer Housing |
7.5% |
|
|
|
|
33% |
||
|
VNIR Heater |
|
|
X |
|
Cold Shield |
|
|
X |
Figure 1.2-1 CRISM Survive / Decontamination Heater Duty
Cycle Flight Data 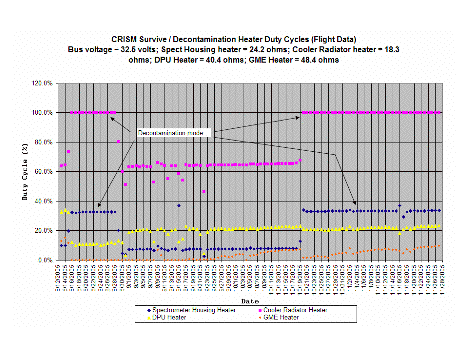
1.2.1 DPU Thermal Zone:
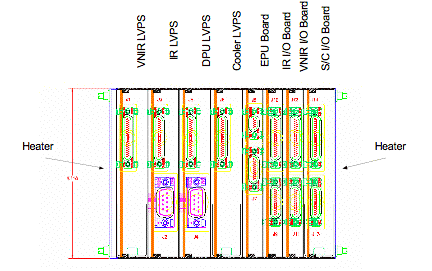
There are a total of six temperature sensors in the DPU, one on each of the four DPU low voltage power supply (LVPS) boards that are monitored internally and two survive temperature sensors on the IR LVPS board monitored by the S/C. A layout of the DPU showing the order of the boards is shown in Figure 1.2.1-1. The two survive heaters are located on the side panels of the assembly. The four internally monitored temperature sensors track each other very closely and are discussed as a group.
1.2.1.1 DPU, IR, VNIR, and Cooler LVPS temperatures
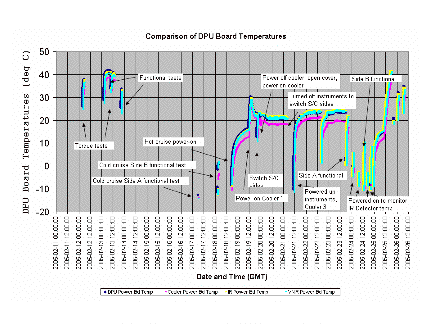
Each of these four DPU temperature sensors is located on their respective LVPS board on the back side of the board under the RT1020 ACTEL gate array. Figure 1.2.1.1-1 below shows the temperatures as a function of time during the MRO TB test, the most representative sample of the expected temperatures in orbit. These temperatures represent only the times when the DPU was powered. The events that occurred during the S/C TB test are annotated on the graph for reference.
The survive heater threshold of -13C is apparent in the graph. Also note that the cooler LVPS is slightly lower in temperature that the other three boards particularly when the cooler is not powered.
Figure 1.2.1.1-1: Comparison of DPU Board Temperatures
1.2.1.2 DPU Survive Temperature Sensors 1 and 2 Comparison
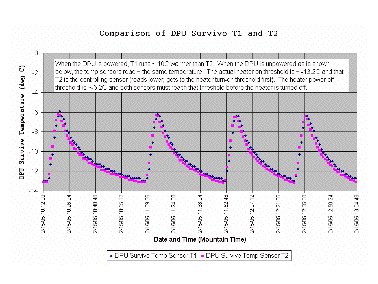
There are two redundant survive temperature sensors monitored by the S/C on the DPU. They are both located on the IR LVPS board. DPU Survive Temp Sensor #1 is located on the DC/DC Converter and DPU Survive Temp Sensor #2 is located on the EMI filter. The DC/DC Converter runs warmer which explains why DPU Survive Temp Sensor #1 runs about 10C warmer when the DPU is powered. Figure 1.2.1.2-1 below shows the two DPU survive temperatures during the MRO TB test. These data can be compared to the CRISM monitored data on the previous page, the difference being that this data is recorded all of the time while the data on the previous page is only while CRISM is powered. Figure m shows a comparison of the two survive temperature sensors. T2 reads lower than T1 and is the controlling sensor for the DPU survive heater.
Figure 1.2.1.2-1 DPU Survive Temperature Comparison
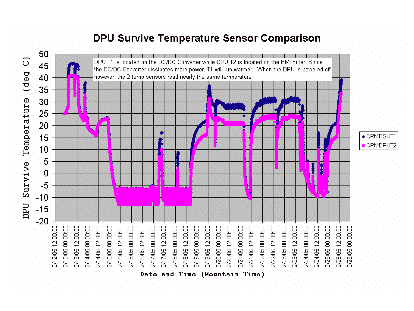
Figure 1.2.1.2-2 DPU Survive Temperature Sensor Comparison Survive Mode
1.2.2 GME Thermal Zone
1.2.2.1 Survive Temperature Sensors 1 and 2 Comparison
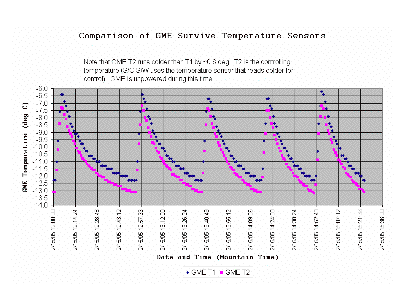
There are two redundant survive temperature sensors monitored by the S/C on the GME. They are both located on the GME board. GME Survive Temp Sensor #1 is located next to the DC/DC Converter and GME Survive Temp Sensor #2 is located next to the motor controller. The DC/DC Converter runs warmer which explains why GME Survive Temp Sensor #1 runs about 3C warmer when the GME is powered. When the GME is unpowered, the two temperature sensors read ~ the same temperature. The heater turn-on threshold is -13C as shown in Figure 1.2.2.1-1. Figure 1.2.2.1-2 compares the two temperature sensors in survive mode and shows that T2 controls the GME survive heater.
Figure 1.2.2.1-1 Comparison of the GME Survive Temperature Sensors
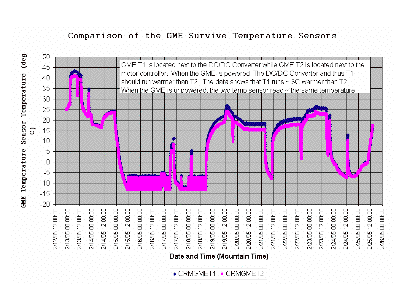
Figure 1.2.2.1-2 Comparison of GME Survive Temperature Sensors – Survive Mode
1.2.3 Cryogenic Thermal Zone
The Cryogenic thermal zone consists of the 5 temperatures sensors, 3 coolers, 3 heat pipes, and the associated thermal blankets, flex links, low e coatings, low thermal conductivity mounts, etc. There are no heaters in this thermal zone.
There are temperature sensors on each of the three cooler cold tips, and redundant sensors on the IR Detector. The temperature sensors on the IR Detector have had a history of readout problems mainly due to the location of the PC tracks on the IR FPE board. The tracks run close by the ACTEL FPGA and picked up noise which caused the response to differ from the idealized response. A two point fit was done in the OCF to each detector at +20C and +40C and a linear fit was applied to the transfer function. This fit worked well for IR Detector Temperature #2 but not for #1. Sensor #1 was also more susceptible to changes in the readout with frame rate.
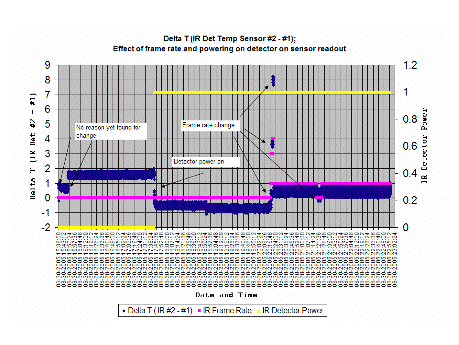
In November, 2004, a fix was made to the Sensor #1 which greatly reduced the sensitivity to frame rate and allowed it to be calibrated against Sensor #2. The calibration was performed using the data from the December OCF test. Figure 1.2.3-1 shows the IR Detector #1 plotted against IR Detector #2 from the initial turn-on on 08/30/05. Figure 1.2.3-2 shows the effect of frame rate and powering on the detector on the temperature sensor readouts.
Details about how the cryo system performs are included in the Cryo System Performance Section, in the User’s Manual portion of this document, Section 2.1.
Figure 1.2.3-1: Comparison of IR Detector #1 and #2 Outputs
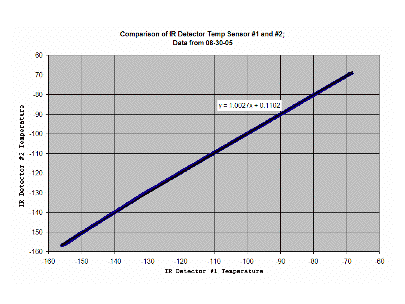
Figure 1.2.3-2: Effect of Frame Rate and Powering on detector on IR Detector Temperature Sensor Readouts
1.2.4 VNIR Detector Thermal Zone
The VNIR detector assembly is structurally mounted to, but thermally isolated from, the Spectrometer Housing. The assembly has a 95W heater to provide 1.5W (12V) of heat to the detector to maintain its temperature at -60C while operating. The S/C controlled Spectrometer Housing heater is set to -60C in survive mode to keep the VNIR detector (which radiatively couples to the Spectrometer Housing) from getting too cold in cruise. The VNIR detector will also follow the temperature of the when the Spectrometer Housing heater is set to Decontamination mode (set point = +20C). This is the only cycling that the VNIR Detector should experience in flight. There are a total of three Decontamination periods currently planned.
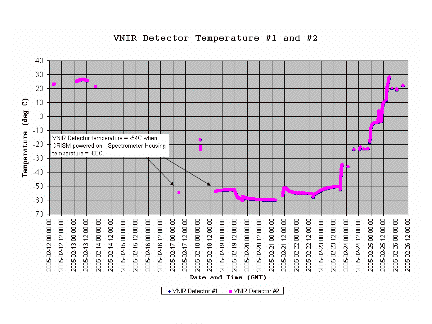
The VNIR detector has redundant 2N2222 temperature sensors. VNIR Detector temperature sensor #1 is used to control the heater. A plot of the two VNIR temperature sensors during the MRO TB Test is given in Figure 1.2.4-1.
Figure 1.2.4-1: VNIR Detector Temperature during the MRO TB Test
1.2.4.1 Comparison of VNIR Detector Temperature Sensor #1 and #2
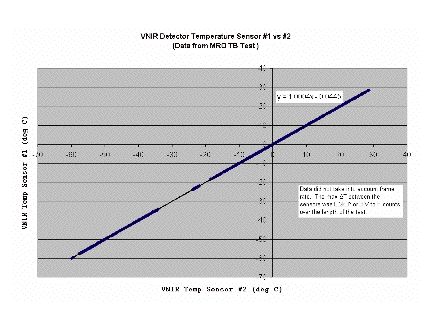
The two VNIR Detector temperature sensors read nearly the same temperature. In fact, the maximum difference between the two sensors during the entire TB test was 0.260 °C or 3 V to F counts. A comparison of the readings of the two VNIR Detector temperature sensors along with a linear fit to the data is given in Figure 1.2.4.1-1.
Figure 1.2.4.1-1: Comparison of the VNIR Detector Temperature Sensor #1 and #2
1.2.4.2 VNIR Detector Temperature and VNIR Heater Duty Cycle vs. Spectrometer Housing Temperature
The Spectrometer Housing is passively cooled using the Anti-sunward radiator and is expected to get as low as -115C in cruise. A plot of the VNIR Detector temperature #1 vs. Spectrometer Housing temperature is given in Figure 1.2.4.2-1. A plot of the VNIR Heater duty cycle vs. Spectrometer Housing temperature from the initial flight power on is given in Figure 1.2.4.2-2.
Figure 1.2.4.2-1: VNIR Detector vs. Spectrometer Housing Temperature
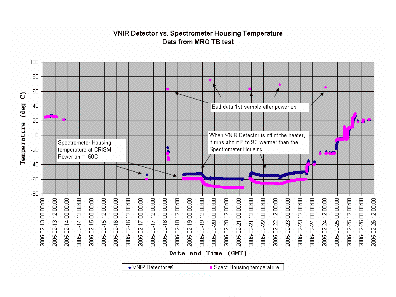
Figure 1.2.4.2-2 VNIR Duty Cycle vs. Spectrometer Housing Temperature
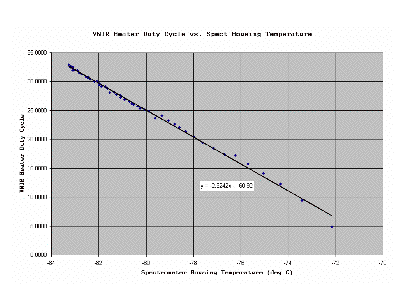
If the duty cycle remains linear with temperature, it will reach 100% duty cycle when the Spectrometer Housing temperature reaches -112.26°C. The VNIR detector generally runs about 6 to 9C warmer than the Spectrometer Housing when the VNIR heater is not cycling on (including in cruise). The Spectrometer Housing was -69C when the VNIR heater first powered on. The duty cycle increases by about 10% for each 4.3C decrease in Spectrometer Housing temperature.
1.2.5 Optical Bench Zone
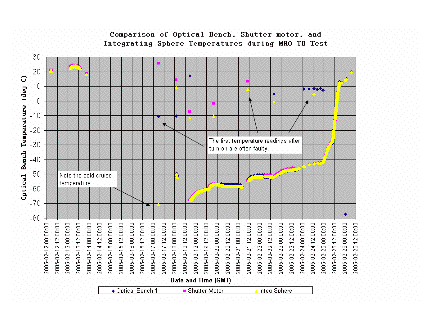
There are six temperature sensors in this zone that are generally within a few degrees of each other. This zone is purely passive; the temperatures are driven by the optical bench thermal radiator. The temperature sensors in this zone are the optical bench, the shutter motor, the integrating sphere, and three telescope temperatures. Figure 1.2.5-1 below compares the temperatures of the optical bench, shutter motor, and the integrating sphere during the MRO TB test for reference. There number of points on the graph that fall well off of the rest of the curve. These are all the first temperature readings after power up and these are often faulty.
Note that the initial turn-on temperature for these temperatures in cold cruise was -72C. The shutter motor uses Braycoat lubricant which freezes at -80C. The Allowable Flight Temperature for the motor is -58C although a request has been made to modify it to -63C.
Figure 1.2.5-1 Comparison of the Optical Bench, Shutter Motor, and Integrating Sphere Temperatures During the MRO Thermal Balance Test
1.2.5.1 Maximum Delta T among the six Optical Bench Thermal Zone Temperature Sensors
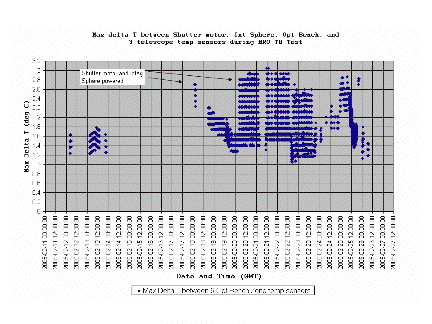
Figure 1.2.5.1-1 gives the maximum delta T between the optical bench, shutter motor, and the integrating sphere. The largest delta T of 3C occurs when the shutter or integrating sphere is powered. The largest delta T between the optical bench and the three telescope temperatures is <2C.
Figure 1.2.5.1-1 Maximum Delta T Between the Shutter Motor, Integrating Sphere, Optical Bench, and the three Telescope Temperatures During the MRO TB Test
1.2.5.2 Comparison of the Integrating Sphere and Optical Bench
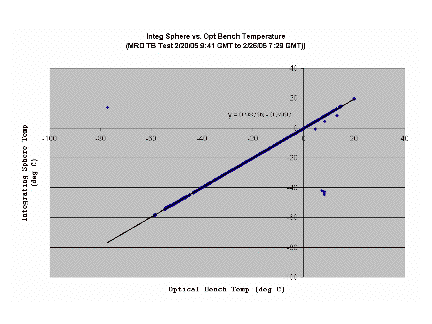
The temperature of the integrating sphere is important in calibrating the CRISM Instrument. The photodiode used to close the loop around the sphere lamp current is sensitive to temperature. If the Integrating Sphere temperature sensor fails, the contingency is to use the Optical Bench temperature sensor. The relationship between the Integrating sphere temperature and the optical bench temperature is shown below. The bad data points were not taken out of the data (9 points out of 32000) and frame rate was not considered in this transfer function.
Figure 1.2.5.2-1 Comparison of the Integrating Sphere and Optical Bench Temperatures
1.2.6 Spectral Cavity Thermal Zone
There are three temperature sensors on the Spectrometer Housing, 2 redundant Spectrometer Cavity temperature sensors which are sampled by CRISM (one on the IR FPE and one on the VNIR FPE), and one survive temperature sensor sampled by the S/C all of the time.
The spectral cavity also has two heaters, one 24.2 W heater controlled by the S/C and one 125 W trim heater controlled internally by CRISM. The spacecraft controlled heater acts as both a survive heater and a decontamination heater.
Figure 1.2.6-1 gives the temperature of the two CRISM monitored temperature sensors during the MRO TB test. The temperature of the Spectrometer Housing dropped to -72C during this test. Figure 1.2.6-2 gives the S/C monitored temperature sensor response over the MRO TB Test.
Figure 1.2.6-1 Comparison of the IR and VNIR Spectral Cavity Temperatures from the MRO TB Test
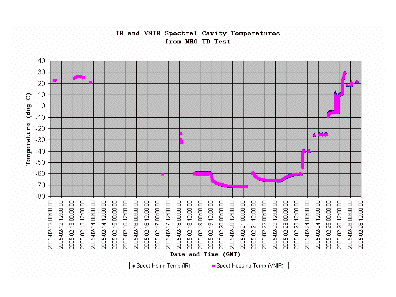
Figure 1.2.6-2 CRISM Spect Housing
S/C Monitored PRT during MRO TB Test 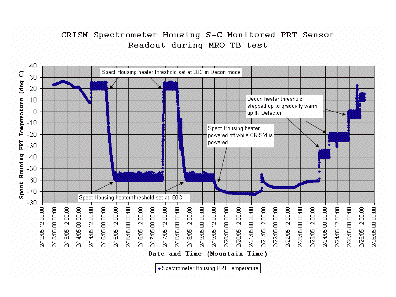
1.2.6.1 Spectrometer Housing Temperature Transition Time From Survive to the Decontamination Set Points
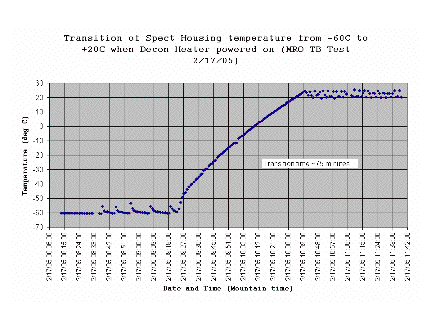
The time that it takes to increase the Spectrometer Housing temperature from the survive setting of -60C to the Decontamination setting of +20C is on the order of 75 minutes as shown in Figure 1.2.6.1-1 below.
Figure 1.2.6.1-1 Transition of Spect Housing Temperature from -60C to +20C When Decontamination Heater Powered On During MRO TB Test
1.2.6.2 Temperature Sensor Response Comparison While Spectrometer Housing Heater Cycling On and Off
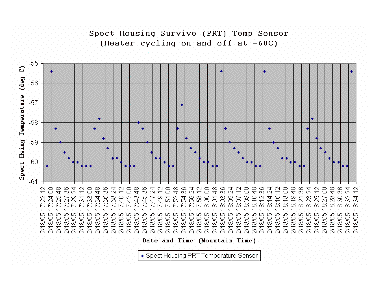
The data in the two graphs below are taken over the same period of time as the Spectrometer Housing Survive / Decontamination heater cycles on and off at its set point of -60C. Note that the IR FPE monitored sensor has a larger excursion than the VNIR FPE monitored sensor even though it is located further from the Decontamination heater. Also note that the S/C survive temperature sensor has the largest excursion (5C). It is located next to the Spectrometer Housing heater.
Figure 1.2.6.2-1 Comparison of Spectral Cavity Temperature Sensors as Spectrometer Housing Heater Cycles On and Off at -60C
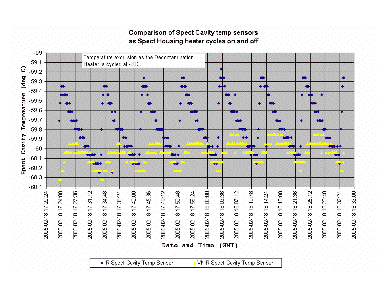
Figure 1.2.6.2-2 Spectrometer Housing PRT (S/C Monitored) Sensor as Spectrometer Housing Heater Cycles On and Off at -60C
1.2.7 Cooler Radiator Thermal Zone
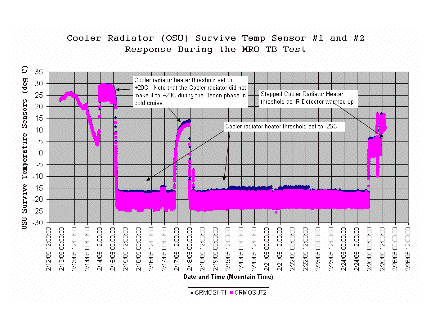
The cooler radiator thermal zone has 3 temperature sensors and two heaters associated with it. The S/C monitors redundant temperature sensors to control the 18.3W survive heater while CRISM has a single temperature sensor (OSU Cavity VNIR) to control the 125W trim heater. The S/C heater is used in both survive mode (set point = -23C) and in Decontamination mode (set point = +20C). The set point in survive mode is set to keep the coolers warm. The coolers will tend to leak helium at temperatures approaching -40C. The Cooler Radiator survive heater is left operating when CRISM is powered. In the thermal balance test, it operated at about a 30% duty cycle while CRISM was powered. Figures 1.2.7-1 and 1.2.7-2 show the response of the temperature sensors during the MRO TB test.
Figure 1.2.7-1 CRISM Monitored Cooler Radiator Temperature Sensor During the MRO TB Test
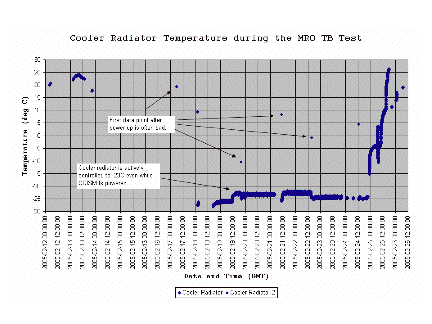
Figure 1.2.7-2 S/C Monitored Cooler Radiator Temperature Sensors During the MRO TB Test
1.2.7.1 Cooler Radiator Decontamination Heater Transient Response / Performance
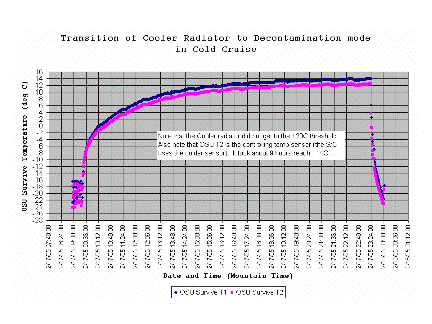
The cooler radiator survive heater is set to +20C when commanded to Decontamination mode. As shown in Figure 1.2.7-2 above, the cooler radiator does not reach +20C but instead flattens out at +14C. The transition time to go from -23C to +14C as shown in Figure 1.2.7.1-1, is about nine hours.
Figure 1.2.7.1-1 Transient Response of the Cooler Radiator From Survive to Decontamination Mode
1.2.8 HOP / Baffle Zone
The HOP / baffle thermal zone is only other purely passive thermal zone on CRISM. As its name implies, this zone consists of two thermal sensors, the HOP and the baffle. The HOP temperature sensor is actually located on the shield over the HOP. It does not reflect the actual HOP temperature but closely reflects the baffle temperature. It can however be used to set the timeout for the HOP when the door is opened.
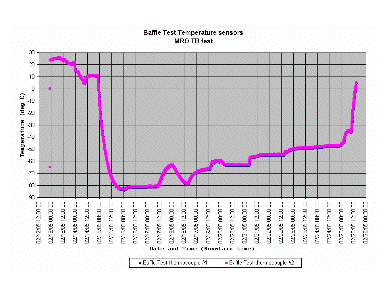
Figure 1.2.8-1 is a graph of the two temperatures over the length of the MRO TB test. This graph shows the minimum temperature of ~ -81C. For comparison, the two LMA test temperature sensors (powered during entire test), plotted in Figure 1.2.8-2 show a minimum temperature of -84C. The cold temperature limit on the HOP is -120C. The graph also shows how much the HOP temperature sensor increases while the HOP heater is powered.
Figure 1.2.8-1 Comparison of Baffle and HOP Temperatures During MRO TB Test
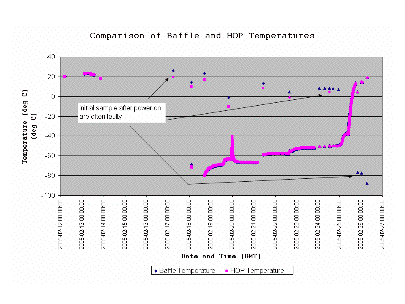
Figure 1.2.8-2 Baffle Test Thermocouples During the MRO TB Test
1.2.8.1 Use of Baffle Temperature Sensor as Contingency for HOP Temperature Sensor Failure
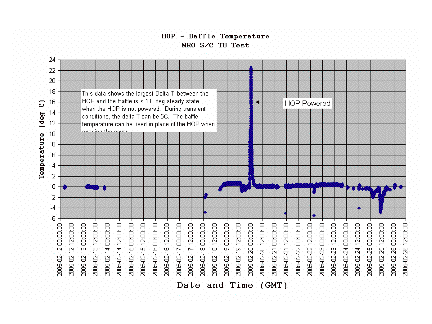
If the HOP Temperature sensor were to fail, the contingency approach is to use the baffle temperature sensor. Figure 1.2.8.1-1 gives the delta T between the two temperature sensors during the TB test. The delta T is < 1C steady state and <5C during chamber warm-up (transient). A 5C accuracy is accurate enough to predict the HOP power on time for the door opening.
Figure 1.2.8.1-1 Delta T Hop – Baffle Temperature, MRO TB Test
1.2.9 Focal Plane Electronics / Cold Shield Zone
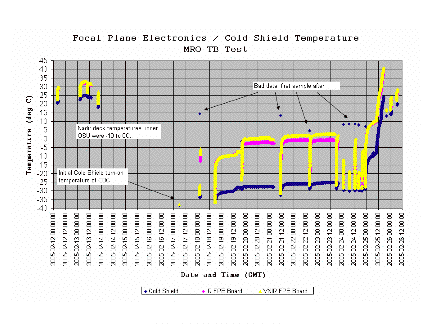
The Focal Plane Electronics / Cold Shield thermal zone have three temperature sensors and two 125W trim heaters. The three temperature sensors are located on the IR Focal Plane Electronics (FPE) board, the VNIR FPE board, and on the cold shield. The sensor on the IR FPE board is located toward the center of the populated side of the board ~ 1” from the ACTEL. The sensor on the VNIR FPE board is located toward the edge of the populated side of the board between two 2951 linear regulators and the multiplexer (not very high power dissipation devices). The temperature sensor on the cold shield has been at various times called the Gimbal Electronics Housing, the OSU Cavity (VNIR) and the Cold Shield. The two trim heaters are located on the cold shield. They are separately controlled by the temperature sensor on the cold shield.
This zone is located at the bottom of the rotating portion of the gimbal. Its temperature is influenced by a radiative coupling to the deck under the OSU. The expected deck temperatures were ~ -35C at the time of the CRISM TB test in Sept, 2004 and were subsequently raised to ~-5C to +5C prior to the MRO TB test in February, 2005. The three zone temperatures at power on were very similar for the three tests in spite of the deck temperature change. The reason is thought to be a small thermal leak between the cold shield and the Spectrometer Housing which occurred between the CRISM TB Test and the MRO TB test when the ACTEL were replaced in the FPE. Table 1.2.9-1 shows the temperatures of the various components in these two tests and during the first on-orbit power up. A thermal model with the actual deck temperatures, 24 in2 the sun on the back of the Anti-sunward radiator and a 0.02C/W thermal leak very closely matches the results for the Spectrometer Housing and the Cold shield temperatures. The CRISM test in December will provide data that should allow us to confirm these assumptions. Figure 1.2.9-1 shows the FPE and the cold shield temperatures during the MRO TB Test.
Table 1.2.9-1: Nadir Deck and the FPE/Cold Shield thermal zone Power On temperatures
|
Location |
CRISM TB Test Cruise results |
S/C TB Test Cruise Results |
Flight Cruise Results |
|
IR Focal Plane Electronics |
-39.5C |
-33.3C |
-37C |
|
VNIR Focal Plane Electronics |
-42.6C |
-37.8C |
-37C |
|
Cold Shield |
-43.8C |
-38.3C |
-40C |
|
Deck Temperature |
-35C |
0 to -10C |
+5 to -5C |
|
Thermal leak |
No |
Small |
Small |
Figure 1.2.9-1: Focal Plane Electronics / Cold Shield Temperatures, MRO TB Test
1.2.9.1 Cold Shield Trim Heater Duty Cycle vs. FPE and Spectrometer Housing Temperatures
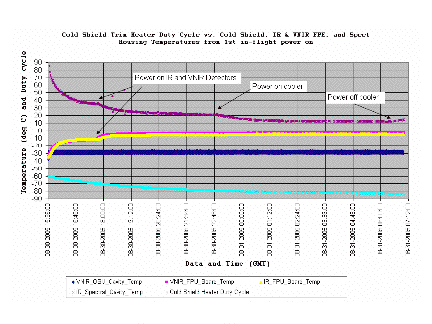
The cold shield trim heater came on unexpectedly during the first on-orbit power on of CRISM. Figure 1.2.9.1-1 gives a plot of the duty cycle of the cold shield heater vs. the IR & VNIR FPE and the Spectrometer Housing temperatures. The duty cycle inversely follows the temperature of the two FPEs when the cooler is not powered and then drops further when the cooler is powered.
Figure 1.2.9.1-1 Cold Shield Trim Heater Duty Cycle vs. Cold Shield, IR & VNIR FPE, and Spect Housing Temperatures from 1st In-flight Power On
1.3 Flood and Sphere Lamps:
There are 4 flood lamps in the CRISM instrument, 2 on the IR side and 2 on the VNIR side. None of the flood lamp currents are telemetered.
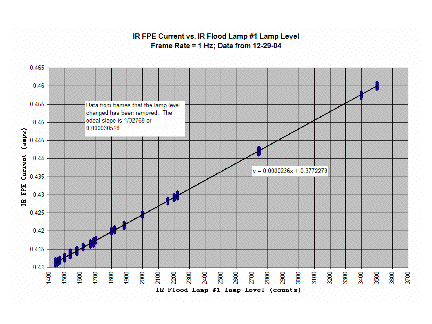
The flood lamp drive circuits consist of a D/A converter, a reference voltage, and constant current drive circuit. The current source also has a current limit of ~ 0.100 to 0.110 amps. The circuit is slightly different between the VNIR Flood lamps and the IR Flood lamps. The two circuits are described in detail in the CRISM User’s Guide section of this document.
An analysis of the VNIR Flood lamp circuit indicates that the lamp current is equal to the Lamp Level / 32768 in amps. This current is reflected in the VNIR FPE current as well. The VNIR Flood lamp circuit current limit represents a lamp level of between 3277 and 3604 counts.
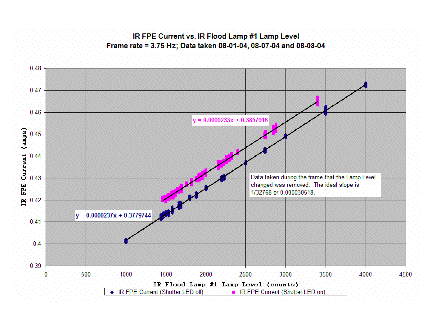
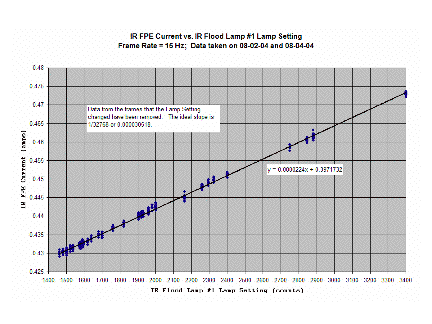
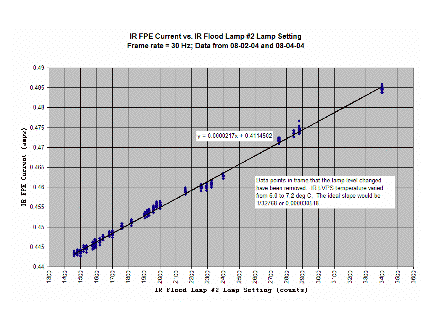
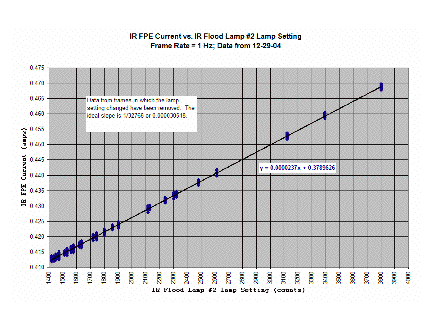
The IR Flood lamp circuit should have the same response but the data shows that the IR FPE current is ~ 0.78 * Lamp Level / 32768. The reason for this is understood and is explained in the User’s Guide. A full scale Lamp Setting of 4095 for an IR Flood Lamp is not enough to reach the current limit of 0.100 amps.
The plots below are intended to look for the relationship between lamp level and FPE current to check for repeatability. Since there is an effect of Focal Plane current with frame rate, plots are presented for each frame rate.
1.3.1 IR Flood Lamp #1
1.3.1.1 IR Flood Lamp #1 Level vs. IR FPE current at frame rate = 1 Hz:
1.3.1.2 IR Flood Lamp #1 Level vs. IR FPE current at frame rate = 3.75 Hz:
1.3.1.3 IR Flood Lamp #1 Level vs. IR FPE current at frame rate = 15 Hz:
1.3.1.4 IR Flood Lamp #1 Level vs. IR FPE current at frame rate = 30 Hz:
1.3.2 IR Flood Lamp #2
1.3.2.1 IR Flood Lamp #2 Level vs. IR FPE current at frame rate = 1 Hz:
1.3.2.2 IR Flood Lamp #2 Level vs. IR FPE current at frame rate = 3.75 Hz:
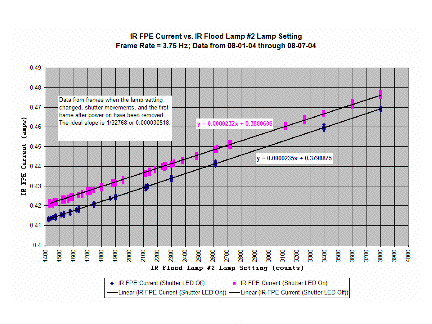
1.3.2.3 IR Flood Lamp #2 Level vs. IR FPE current at frame rate = 15 Hz:
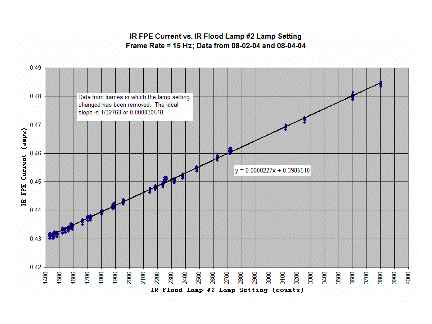
1.3.2.4 IR Flood Lamp #2 Level vs. IR FPE current at frame rate = 30 Hz:
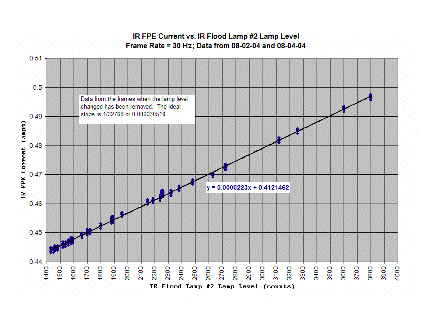
1.3.3 VNIR Flood Lamp #1
1.3.3.1 VNIR Flood Lamp #1 Level vs. VNIR FPE current at frame rate = 1 Hz:
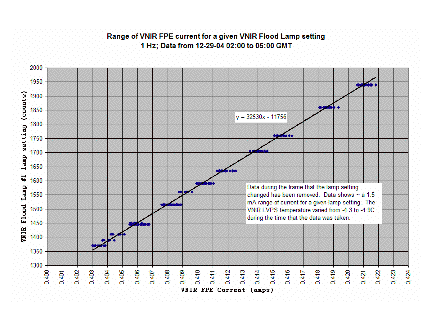
The graph below shows VNIR FPE current vs. VNIR Flood Lamp #1 current. The slope shows a 1:1 correspondence of flood lamp current with the change in FPE current which makes sense. The offset of 0.360 amps corresponds well with the known VNIR FPE current with the detector but no lamps powered.
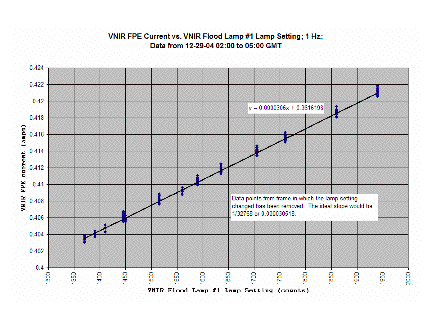
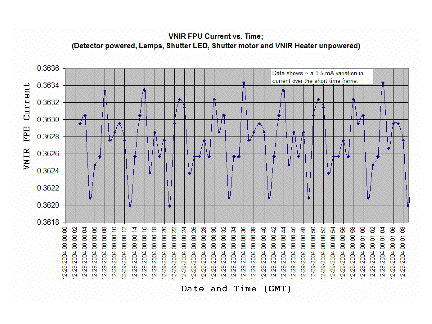
The graph below shows the range of VNIR FPE currents for a given VNIR Flood Lamp #1 Level. The variation ranges from ~ 1.0 to 1.5 mA for a given lamp level. The graph below that shows the nominal variation in VNIR FPE current with the detector powered and the lamps unpowered (Frame rate = 3.75 Hz and Spectra = 0). It too shows a variation of up to 1.5 mA.
1.3.3.2 VNIR Flood Lamp #1 Level vs. VNIR FPE current at frame rate = 3.75 Hz:
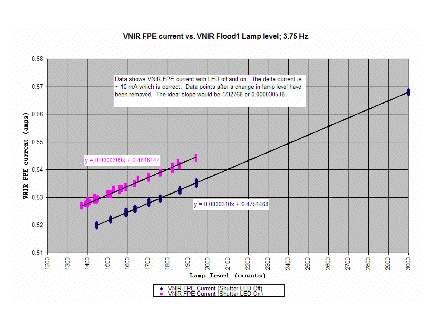
The data from the VNIR Flood Lamp #1 at 3.75 Hz had two parallel lines (lamp level vs. FPE current) due to powering on and off of the shutter LED.
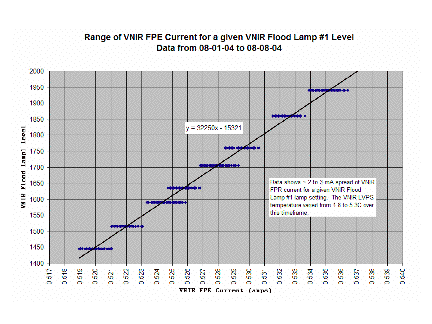
The 2nd graph below depicts the range of VNIR FPE currents for a VNIR Flood Lamp #1 level. At 3.75 Hz, the range is 2.5 to 3.0 mA which is higher than the 1.0 to 1.5 mA at 1 Hz.
1.3.3.3 VNIR Flood Lamp #1 Level vs. VNIR FPE current at frame rate = 15 Hz:
The data from the VNIR Flood Lamp #1 at 15 Hz
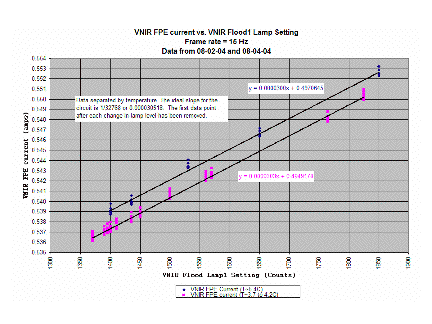
1.3.3.4 VNIR Flood Lamp #1 Level vs. VNIR FPE current at frame rate = 30 Hz:
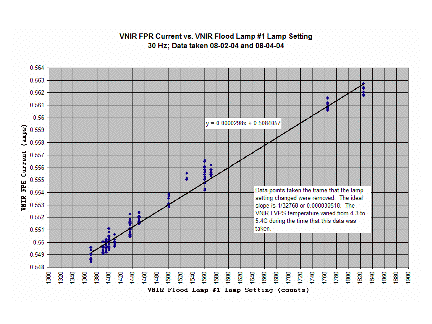
1.3.4 VNIR Flood Lamp #2
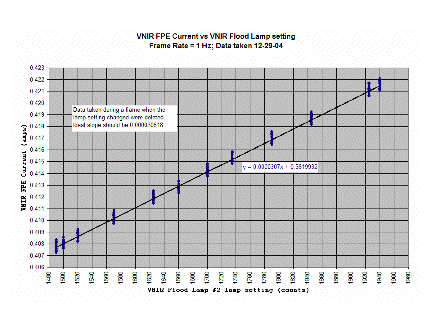
1.3.4.1 VNIR Flood Lamp #2 Level vs. VNIR FPE current at frame rate = 1 Hz:
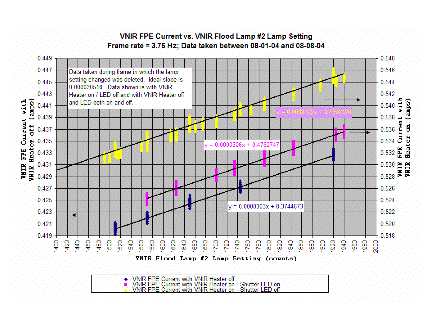
1.3.4.2 VNIR Flood Lamp #2 Level vs. VNIR FPE current at frame rate = 3.75 Hz:
1.3.4.3 VNIR Flood Lamp #2 Level vs. VNIR FPE current at frame rate = 15 Hz:
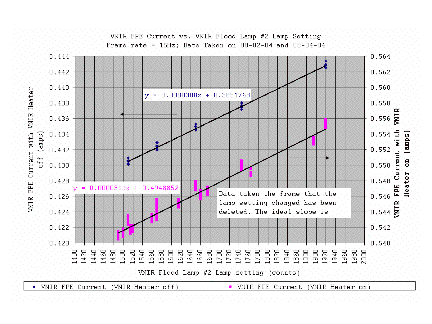
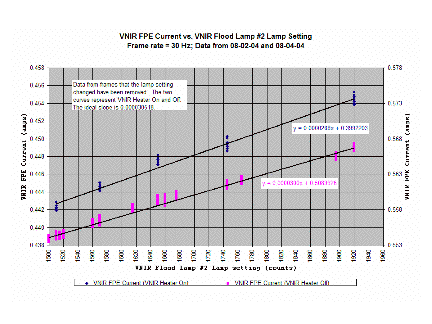
1.3.4.4 VNIR Flood Lamp #2 Level vs. VNIR FPE current at frame rate = 30 Hz:
1.3.5 IR Sphere Lamp
The IR Sphere Lamp radiance (and thus current) is controlled either an open loop or closed loop mode. In general, CRISM uses only the closed loop mode. The loop is closed around a photodiode in the integrating sphere. The response of the circuit is relatively slow (time constant in the hundreds of milliseconds).
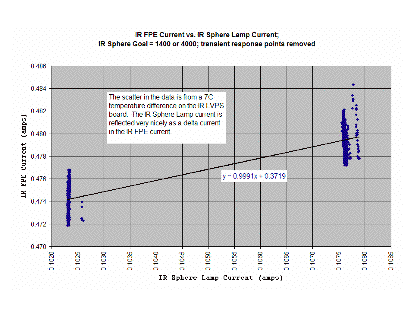
The IR Sphere Lamp current is sampled on the IR Focal Plane Electronics board. The IR FPE current is sampled on the IR LVPS Board. Any change in the IR Sphere Lamp current should be reflected as a change in the IR FPE current. However, due to the asynchronous sampling between the two boards the transient response of the Sphere lamp may be captured by both, either, or neither channel. Figure n below shows the effect.
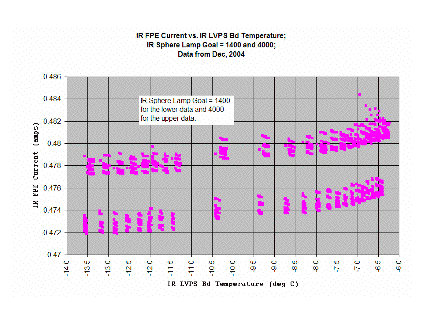
The figure shows the underdamped response of the IR Sphere lamp. The bottom (pink) graph is the IR Sphere lamp current and the top graph (blue) is the IR FPE current. The IR Sphere goal is commanded from 1400 to 4000 and back resulting in the small square wave seen on both currents. The Sphere lamp current routinely overshot to 0.150 amps and undershot to 0 to 0.020 amps. The transients are captured more often on the IR FPE current channel than on the IR Sphere lamp channel.
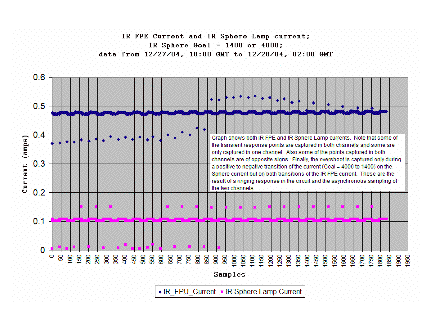
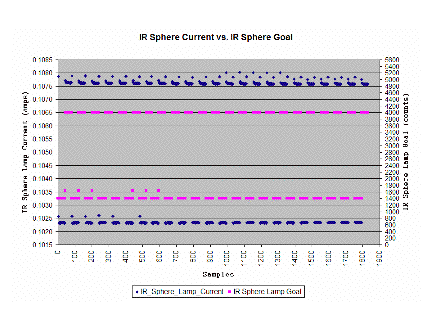
Figure n shows the IR Sphere lamp current vs. the IR Sphere goal. The IR Sphere current oscillates between 0.1023 and 0.1076 amps for goal values of 1400 and 4000 respectively. When the goal is commanded from 1400 to 4000, there is an intermediate commanded level of 1638 which shows up on some of the transitions. The Sphere level for all of these is 2048.
The IR FPE current reading tends to be affected by the temperature of the IR LVPS board. This is shown in the graph in Figure n. The current changes ~ 4 mA over a 7.0C temperature difference in the IR LVPS board. This is the source of the scatter in the following figure.
Figure n shows the relationship between the IR FPE current and the IR Sphere lamp current. The scatter in the IR FPE current of ~ 4 mA is shown. The IR Sphere Lamp current is reflected as a delta current in the IR FPE very nicely however.
1.3.5.1 IR Sphere Lamp Current vs. IR Integrating Sphere Temperature
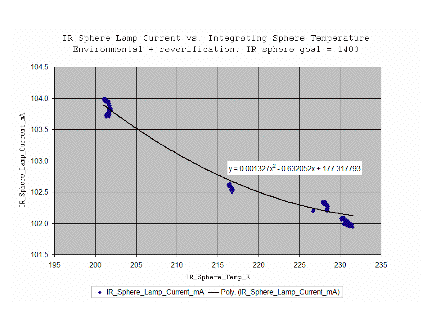
The closed loop control of the IR Sphere lamp involves detecting the light output of the bulb using a photodiode. The photodiode response however is a function of temperature. It is mounted and thermally coupled to the integrating sphere so the temperature of the integrating sphere and the photodiode are equivalent. Figure n gives the relationship between the IR Sphere Lamp current and the Integrating Sphere temperature.
1.3.6 VNIR Sphere Lamp
2.0 CRISM User’s Manual
2.1 Cryo System Performance
The cryo system consists of the IR Detector, the 3 coolers, 3 diode heat pipes, and all of the associated flex links, thermal blanketing, low conduction mounts, etc. The mean time between failures (MTBF) for the coolers is quoted at 8000 hours so three of them were used to provide the two year mission lifetime. The diode heat pipes are used to minimize the heat load from the unpowered coolers on the powered cooler.
The coolers are designed to control the temperature of the cooler cold tip. The IR detector temperature follows the cooler cold tip temperature. The cooler motor drive is controlled using a proportional – integral control loop which is described in detail in the following section. The loop is closed around the commanded vs. the actual cooler cold tip temperature.
The cryo system performance could only be measured at the integrated instrument level since it is dramatically affected by remainder of the thermal environment in the OSU, the workmanship of the thermal blanket installation, clearances, etc. The parameters of the control loop could therefore not be set until that time as well. The cooler – IR detector has been taken together from their nominal operating temperature to cryo temperatures only four times since the instrument was integrated, CRISM instrument thermal balance in Sept, 2004, the OCF test in Dec, 2004, the MRO TB test in Feb, 2005, and the first flight turn-on in Aug, 2005.
|
Date |
Cooler # |
Cooler Cold Tip Temperatures |
IR Detector Temperatures |
Time from Cooler Turn-on To |
||||||||||||||
|
Turn-on |
1st plateau |
Start of second drop |
When integral loop is active |
Final |
Overshoot |
Start temp |
Start of second drop |
When integral loop is active |
Final |
Overshoot |
Stability |
1st plateau |
IR Detector starts to drop in temp |
Start of second drop |
When integral loop is active |
Final |
||
|
9/04 |
1 |
-52.2 |
-152.9 |
|
N/A |
N/A |
N/A |
|
|
|
N/A |
N/A |
N/A |
19m 8s |
|
|
N/A |
N/A |
|
12/04 |
2 |
-41.0 |
-142.4 |
|
|
N/A |
N/A |
|
|
|
N/A |
N/A |
N/A |
25m 8s |
|
|
N/A |
N/A |
|
2/05 |
1 |
-42.0 |
-140.7 |
-143.2 |
|
N/A |
N/A |
|
-121.1 |
|
N/A |
N/A |
N/A |
22m 23s |
24m 49s |
5h 44m 27s |
N/A |
N/A |
|
8/05 |
1 |
-38.5 |
-146.6 |
-150.1 |
|
N/A |
N/A |
|
|
|
N/A |
N/A |
N/A |
20m 53s |
20m 31s |
|
|
N/A |
|
|
|
|
|
|
|
|
|
|
|
|
|
|
|
|
|
|
|
|
|
|
|
|
|
|
|
|
|
|
|
|
|
|
|
|
|
|
|
|
|
|
|
|
|
|
|
|
|
|
|
|
|
|
|
|
|
|
|
|
2.1.1 Cooler Control Loop
CRISM has three coolers each with a diode heat pipe between the cooler and the IR Detector. The diode heat pipe is to minimize the heat load from the unpowered coolers on the powered cooler. Three coolers are necessary to meet the lifetime requirements.
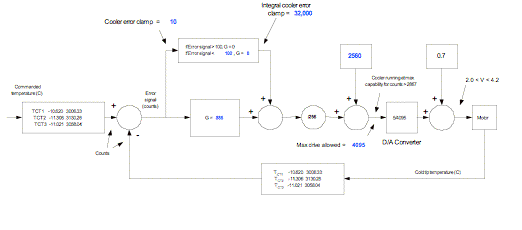
The temperature of the cooler cold tip is controlled using a proportional – integral (PI) control loop. The IR detector temperature follows the cold tip temperature. The PI loop is shown in Figure n. Those parameters in blue are in a look up table and can be changed without modifying flight software. The cooler motor operates at full capacity at control voltages greater than 4.2 volts. The loop gains were set to keep the cooler running at full capability until the cold tip temperature falls within integral loop band (~ 10C of the set point). Note that the cooler set point (input to the D/A converter) can drop as low as 2867 (assuming 0.7 volts for the diode; 2948 if diode drop = 0.6 volts) and the cooler will still be operating at full cooling capacity.
Figure 2.1.1: Cooler Proportional - Integral Control Loop
2.2 Cover Open Mechanism
The CRISM baffle has a thin titanium cover over the aperture to prevent contamination of the optics. The cover will be opened in Sept, 2006 when the mapping orbit has been reached.
The CRISM Cover open system consists of a spring-loaded hinge on one side of the cover and a latch and latch release mechanism on the opposite side. On the latch side the cover has a flange with a knob. The knob is captured by a spring-loaded five fingered latch. The five fingers are expanded using a high output paraffin (HOP) actuator which acts as a pin pusher. The pin pushed against the latch spring, expanding the five fingers, which releases the knob on the cover flange and allows the cover to open via the hinge spring. A photo of the latch release is given in Figure n.
The HOP is a model number EH-3525 from Starsys. The data sheet is located at http://www.starsys.com/products/paraffinactuators/product.asp?ID=eh3525. The HOP works by heating the wax causing it to expand which pushes the pin. There are two, redundant, 155 W heaters in the HOP. The heater draws ~ 5W at 28 volts. Only one heater is to be powered at a time. The pin will start to move when the wax reaches ~ 80C. The HOP actuator has a non-operating temperature range of ~ +70C to -120C and an operating temperature range of +80 to -60C.
A list of specifications regarding the HOP is given in the table below.
Table n: HOP Specification Table
|
Parameter |
Specification |
|
HOP Model No. |
EH3525 |
|
HOP Manufacturer |
Starsys |
|
Serial # of flight unit |
SN008 |
|
Heater resistance |
155 W |
|
# of heaters |
2 (redundant) |
|
# of heaters to be powered at one time |
1 (may try 2 if nothing else works) |
|
Power draw at 28v |
5 watts |
|
Operating temperature range |
+70C to -60C |
|
Non-operating temperature range |
+60C to -120C |
|
Total usable linear motion |
0.250” |
|
Linear motion at cover release |
0.140” |
|
Linear motion to hit hard stop |
0.280” to 0.305” |
|
Force operating against |
11 lbf |
|
Internal pressure when shear disk releases |
75 lbf |
|
Time to failure after internal pressure reaches 75 lbf |
1 to 2 seconds (from Starsys technical support) |
|
Time to reach full extension on flight unit (room temp, 28 volts) |
128 seconds |
|
Measured powered time of HOP after reaching full extension after which HOP worked properly at room temp, 28 volts |
20 seconds |
The HOP has a specified linear motion of 0.25”. The CRISM door opens when the HOP extension reaches 0.140”. It hits an internal hard stop between 0.28” and 0.305”. When the unit hits the hard stop the internal pressure builds up until it exceeds ~ 75 psi. At that time an internal burst disk gives way after which the unit will no longer operate. The HOP is designed such that no wax will be released in this situation.
The time that it takes the HOP to actuate is a function of temperature and bus voltage. The flight HOP has been actuated over a range of temperatures and voltages to quantify this time vs. temperature vs. voltage function.
Four HOPs were delivered for CRISM, 2 flight units and 2 engineering model units. SN008 was used in the flight mechanism.
2.2.1 HOP Heater Powered On Times vs. Temperature
The time for the cover to open was carefully measured during the cover mechanism development. The parameters that can affect the measurement are bus voltage, vacuum vs. air, flight vs. EM HOP, and flight vs. EM Baffle / cover. All of the measurements presented unless otherwise stated are in vacuum and with the flight HOP. The early measurements are made with the EM baffle / cover and it is assumed that its performance is similar to the flight unit. Temperature is the parameter that is varied.
A graph of the CRISM cover open time vs. temperature is given in Figure 2.2.1-1. Also included in Figure n are the CRISP cover open times using a different mechanism design but the same model number HOP.
Figure 2.1.1-1: Cover Open Times vs. Temperature
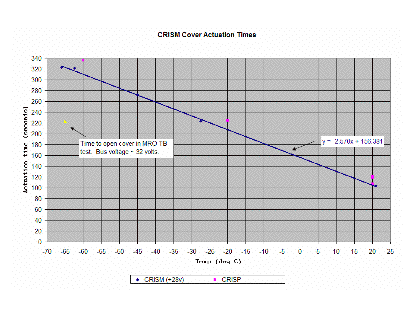
Unfortunately, the bus voltage for MRO has been running between 32.0 to 32.5 volts which will alter the cover open times. The one time that the flight cover was opened in a vacuum on the MRO S/C was during the MRO TB test. This data point is included for comparison.
2.3 Flood Lamp Constant Current Circuit
The VNIR and IR flood lamp currents are controlled by constant current circuits which also provide a current limit capability. Both the IR and VNIR Flood lamp circuits were designed such that the lamp current (and thus the FPE current) would be the lamp setting/32768 in amps. There are, however, a couple of differences in the way the IR and VNIR Lamp circuits were implemented that result in the IR Flood lamp current response being 0.78 * Lamp setting/32768 while the VNIR response remains Lamp setting/32768.
Both circuits consist of a 2.5v reference voltage which acts as the reference for a quad 12-bit D/A. The output of the D/A drives an op amp that has as its other input the voltage across a 10 ohm resistor in the constant current drive circuit. The D/A has an option to use the reference voltage as is or multiply it by a factor of 2 and use that as the reference voltage. The IR circuit has a resistor divider implemented with a pair of 100Kohm resistors (divide by 2) between the reference voltage and the D/A and the D/A does not use the multiply by 2 feature making the reference voltage 1.25 volts. The VNIR circuit does not have a resistor divider between the reference voltage and the D/A, does use the multiply by 2, and has a resistor divider (divide by 4) after the D/A. The VNIR therefore also effectively has a 1.25v reference voltage. The difference between the 2 circuits is critical to this problem. Figure 2.3-1 is the schematic of the IR circuit. Figure 2.3-2 has the VNIR circuit.
A second option for the D/A is to have the inputs buffered or unbuffered. In the former, the input impedance is > 10Mohm. In the latter, the input impedance is 180 Kohm. There are 4 reference voltage inputs, one for each of the quad D/As. The four inputs are tied together in both circuits. The IR board uses 3 of the D/As and all three are set to operate in the buffered mode. The fourth D/A which is not used, however is not set to buffered mode and the default state is unbuffered. The resistor on the bottom leg of the resistor divider therefore instead of being a 100Kohm is now 100K in parallel with 180K which produces a reference voltage of 0.98 volts. This coincidentally is 78% of the expected 1.25v reference.
The VNIR implementation has the resistor divider after the D/A and therefore the unbuffered impedance does not affect the reference voltage. In addition, all four DACs are used on the VNIR implementation and are all set to buffered. [The four inputs on the VNIR are the 2 flood lamps and 2 for the sphere lamp. The IR DAC uses 3 inputs, the 2 flood lamps and 1 for the sphere lamp. The second sphere lamp input is taken off of the quad DAC that has the 3 cooler settings.]
This is not an issue that needs to be fixed. The IR Lamp flood current should remain stable and all of the calibration data was taken in this configuration. If we ever wanted to fix the problem, John Hayes has found a 1 byte patch that would make all 4 reference inputs buffered. This analysis has been confirmed via testing on the EM which has the same performance. The fix has also been successfully tested on the EM.
The circuit also limits the current to between 0.100 and 0.110 amps. For the VNIR, any lamp setting greater than between 3277 and 3604 will be above the current limit and will not result in any additional current draw. The IR circuit does not reach saturation.
Figure 2.3-1: IR Flood Lamp Constant Current and Current Limit Circuit
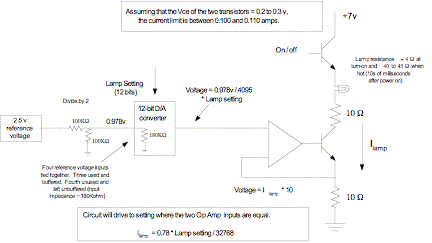
Figure 2.3-2: VNIR Flood Lamp Current Drive Circuit
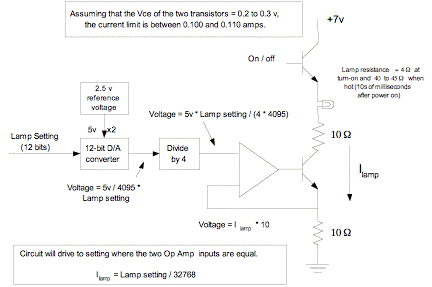
2.4 Gimbal control loop