Table 2-11. Processing Levels for Science Data Sets
|
NASA
|
CODMAC
|
Description
|
|
Packet data
|
Raw - Level 1
|
Telemetry data stream as received at the ground station,
with science and engineering data embedded.
|
|
Level-0
|
Edited - Level 2
|
Instrument science data (e.g., raw voltages, counts) at
full resolution, time ordered, with duplicates and transmission errors
removed.
|
|
Level 1-A
|
Calibrated - Level 3
|
Level 0 data that have been located in space and may have
been transformed (e.g., calibrated, rearranged) in a reversible manner and
packaged with needed ancillary and auxiliary data (e.g., radiances with the
calibration equations applied).
|
|
Level 1-B
|
Resampled - Level 4
|
Irreversibly transformed (e.g., resampled, remapped,
calibrated) values of the instrument measurements (e.g., radiances, magnetic
field strength).
|
|
Level 1-C
|
Derived - Level 5
|
Level 1A or 1B data that have been resampled and mapped
onto uniform space-time grids. The data are calibrated (i.e., radiometrically
corrected) and may have additional corrections applied (e.g., terrain
correction).
|
|
Level 2
|
Derived - Level 5
|
Geophysical parameters, generally derived from Level 1
data, and located in space and time commensurate with instrument location,
pointing, and sampling.
|
|
Level 3
|
Derived - Level 5
|
Geophysical parameters mapped onto uniform space-time
grids.
|
|
|
Ancillary – Level 6
|
Data needed to generate calibrated or resampled data sets.
|
The high-level observation plan in Table 2-4 has been
translated into a preliminary timeline for a number of types of targets. This
has involved internal planning of CRISM observations as described above, as
well as coordination with MRO Project objectives and spacecraft resource
constraints.
·
First, based on the data expected from the sequence of macros
executed for each type of observations, a predicted data volume for each type
of observation is calculated. This is summarized in Table 2-12 for different
configurations of VNIR ± IR data and structure of component images as gimbal
angle range became constricted and cryocooler usage became segmented in ttime..
·
Second, the MRO project has allocated CRISM and other instruments
a fraction of spacecraft resources, downlink and spacecraft pointing.
·
Third, based on coverage goals summarized in Table 2-4, observing
opportunities are identified that both address the science objectives and fit
within allocated downlink.
During the first 6 months of the mission, approximately
half of the orbits were devoted to nadir pointing for multispectral survey
observations, with off-nadir observations requiring spacecraft pointing mostly
on remaining orbits. After that 6-month period, multispectral survey and other
types of mapping data were collected between off-nadir observations requiring
spacecraft pointing. The off-nadir opportunities are of 3 types: (a) Mars
Exploration Program (MEP)-selected targets, the highest priority, for which all
instruments observe the same target at high spatial resolution; (b) coordinated
targets, observed in the same way, of which each instrument chooses a fraction;
and (c) single-instrument targets for which other instruments may or may not
operate at high spatial resolution. Remaining downlink allocation is filled
with targets that are observed at high spatial resolution but without off-nadir
pointing. In addition, some non-coordinated HiRISE or CTX observations are be
accompanied by a short, reduced-resolution CRISM observation (a ridealong,
typically and MSW or MSP strip).
Table 2-12. Contents of each type of CRISM observation
|
Class of observation
|
Frame rate, Hz
|
Activity
|
Pixel binning
|
#
|
Wave-lengths
|
Frames (typical)
|
|
Full resolution targeted (FRT) or
along-track oversampled (ATO)
|
3.75
|
central scan
|
1
|
1
|
107 or 545
|
390
|
|
3.75
|
EPF scans
|
10
|
0,5 or 10
|
107 or 545
|
15
|
|
3.75
|
dark sets
|
1
|
3 or 4
|
107 or 545
|
12
|
|
Half resolution short or long targeted (HRS,
HRL)
|
3.75
|
central scan
|
2
|
1
|
107 or 545
|
243, 320
|
|
3.75
|
EPF scans
|
10
|
0, 5 or 10
|
107 or 545
|
15
|
|
3.75
|
dark sets
|
2
|
4
|
107 or 545
|
12
|
|
Full resolution short or along track
undersampled targeted (FRS, ATU)
|
3.75
|
central scan
|
1
|
1
|
107 or 545
|
174
|
|
3.75
|
dark sets
|
1
|
2
|
107 or 545
|
12
|
|
EPF
|
3.75
|
EPF scans
|
10
|
8, 11 or 13
|
545
|
15
|
|
3.75
|
dark sets
|
10
|
3 or 4
|
545
|
12
|
|
Limb scan (LMB)
|
3.75
|
Individual scans
|
10
|
variable
|
545
|
540
|
|
3.75
|
dark sets
|
10
|
same
|
545
|
12
|
|
TOD
|
3.75
|
3-second segments
|
10
|
12
|
545
|
12
|
|
3.75
|
dark sets
|
10
|
4
|
545
|
12
|
|
Multispectral survey (MSP)
|
15
|
3-minute segments
|
10
|
8
|
73/74 or 94/95
|
2700
|
|
15
|
dark sets
|
10
|
9
|
73/74 or 94/95
|
12
|
|
Hyperspectral survey (HSP)
|
15
|
3-minute segments
|
10
|
8
|
262
|
2700
|
|
15
|
dark sets
|
10
|
9
|
262
|
12
|
|
Multispectral window (MSW)
|
30
|
1 3-minute segment
|
5
|
1
|
73/74 or 94/95
|
5400
|
|
30
|
dark sets
|
5
|
2
|
73/74 or 94/95
|
12
|
|
VNIR hyperspectral map-ping, 180 m/pixel
(HSV)
|
15
|
3-minute segments
|
10
|
8
|
107
|
2700
|
|
15
|
dark sets
|
10
|
9
|
107
|
12
|
|
VNIR hyperspectral map-ping, 90 m/pixel (MSV)
|
30
|
3-minute segments
|
5
|
8
|
90
|
5400
|
|
30
|
dark sets
|
5
|
9
|
90
|
12
|
|
Radiometric calibration
|
1 (VNIR), 1 (IR)
|
sphere background
|
1
|
2
|
545
|
12
|
|
1 (VNIR), 1 (IR)
|
sphere frames
|
1
|
1
|
545
|
32
|
|
1 (VNIR), 3.75 (IR)
|
sphere background
|
1
|
2
|
545
|
12
|
|
1 (VNIR), 3.75 (IR)
|
sphere frames
|
1
|
1
|
545
|
32
|
|
1 (VNIR), 15 (IR)
|
sphere background
|
10
|
2
|
73
|
12
|
|
1 (VNIR), 15 (IR)
|
sphere frames
|
10
|
1
|
73
|
32
|
|
1 (VNIR), 30 (IR)
|
sphere background
|
5
|
2
|
73
|
12
|
|
1 (VNIR), 30 (IR)
|
sphere frames
|
5
|
1
|
73
|
32
|
|
Bias calibration (IR only)
|
1
|
dark frames, several integration times
|
1
|
4
|
438
|
10
|
|
3.75
|
dark frames, several integration times
|
1
|
5
|
438
|
10
|
|
15
|
dark frames, several integration times
|
10
|
4
|
55/56 or 155
|
10
|
|
30
|
dark frames, several integration times
|
5
|
4
|
55/56
|
10
|
|
Flat-field calibration (only 1 frame rate at
a time)
|
1
|
dark sets
|
1
|
2
|
545
|
12
|
|
1
|
3-minute segments
|
1
|
1
|
545
|
180
|
|
3.75
|
dark sets
|
1
|
2
|
545
|
12
|
|
3.75
|
3-minute segments
|
1
|
1
|
545
|
675
|
|
15
|
dark sets
|
10
|
2
|
73
|
12
|
|
15
|
3-minute segments
|
10
|
1
|
73
|
2700
|
|
30
|
dark sets
|
5
|
2
|
73
|
12
|
|
30
|
3-minute segments
|
5
|
1
|
73
|
5400
|
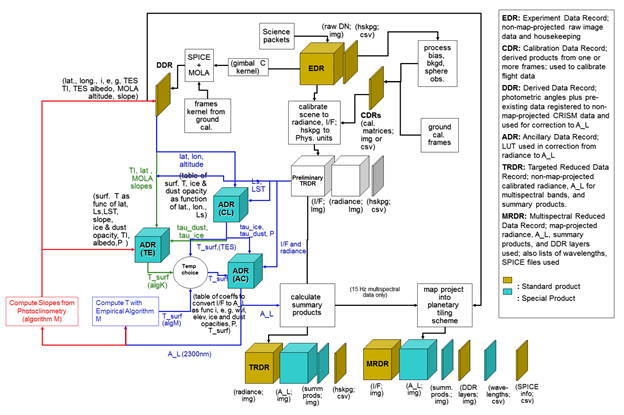
Data processing to standard
products for delivery to the PDS (EDRs, CDRs, TRDRs, DDRs) occurs in the CRISM Science
Operations Center (SOC). ADRs are created by the science team and delivered to
the SOC for application to the data. Additional processing to special products
(LDRs, MRDRs, VRDRs, TERs, MTRDRs) also occurs in the SOC.
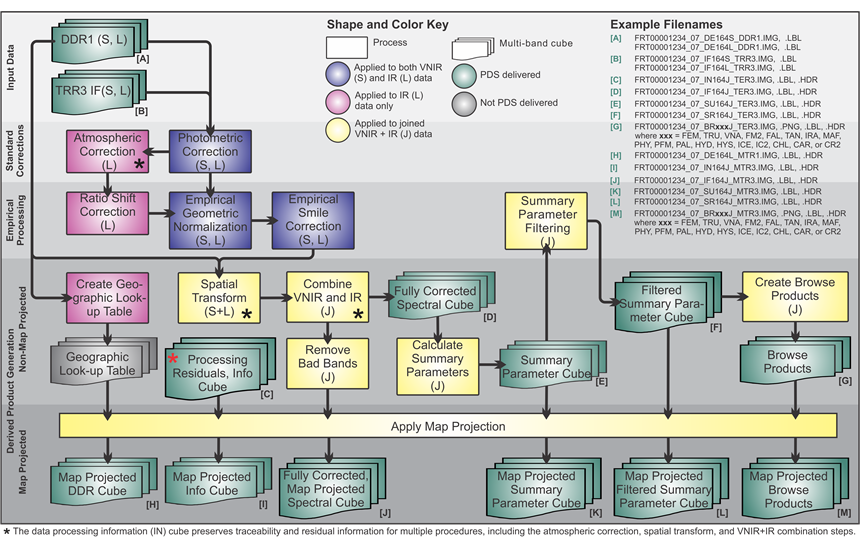
The sequence of processing used
to create deliverable data products is discussed in section 2.2 and shown
graphically in Figures 2-9, 2-9a, and 2-9b. Appendix L provides detailed
mathematical formations of CDRs, and of the derivation of radiance in TRDRs
using the CDRs. Appendix P provides a detailed description of the TER/MTRDR,
MRDR, and VRDR data processing pipelines.
Downlinked CRISM data were forwarded with spacecraft
housekeeping and pointing information from JPL to the CRISM Science Operations
Center (SOC) at The Johns Hopkins University Applied Physics Laboratory (APL),
where they were processed to EDRs in near-real time. DDRs and LDRs were generated
at the SOC using SPacecraft, Instrument, Camera, and Events (SPICE)
and other data sources. TRDRs were also generated at the SOC from EDR products.
MRDRs and VRDRs were generated from TRDR mapping strips, their companion DDRs,
and a variety of ancillary data as described in Appendices P3 and P4. TERs and
MTRDRs were generated from TRDRs and their companion DDRs. After validation
CRISM data products weree transferred to the PDS Geosciences Node for archiving
and distribution.
CRISM data archiving was overseen by Co-I Arvidson and
then his successor Paul Byrne, managers of the PDS Geosciences Node. The
approach outlined above is consistent with the MRO Data Archive Plan (R.
Arvidson, author). Ground data including calibration files and the spectral
library were delivered at various times through Mars orbit insertion. For
flight data, delivery of EDRs, DDRs, LDRs, TRDRs, and CDRs occurred at 3-month
intervals following 6 months (later, 3 months) of validation. Additionally, at
selected delivery times MRDRs and VRDRs covering selected tiles of the global
maps and TERs and MTRDRs derived from selected targeted observations were delivered.
When upgrades occurred to data calibration, TRDRs, MRDRs and/or
TERs and MTRDRs were redelivered with an increment to version numbers. The
current v3 radiometric calibration was implemented in February, 2010.
EDRs, DDRs, LDRs, and TRDRs are CRISM products
representing raw and calibrated data with geometric and timing information
necessary for map projection and various post-processing correction. In
summary:
a) EDRs
represent raw data and TRDRs represent calibrated data. Both are in units of
sensor space. They contain the optical and spatial distortions present at the
sensor.
b) DDRs
represent geometric information for observations pointed at Mars' surface,
indexed to the wavelength bands of EDRs and TRDRs that are closest to 610 nm
(VNIR) and 2300 nm (IR).
c) LDRs
represent geometric information for observations pointed at Mars' limb, indexed
to the wavelength bands of EDRs and TRDRs that are closest to 610 nm (VNIR) and
2300 nm (IR).
The file naming
convention for EDR, DDR,
LDR, and TRDR products is as follows.
(ClassType)(ObsID)_(Counter)_
(Activity)(SensorID)_(Filetype)(version).(Ext)
where:
ClassType =
FRT (Full Resolution
Targeted Observation; discontinued 2012)
HRL (Half Resolution
Long Targeted Observation; discontinued 2012)
HRS (Half Resolution
Short Targeted Observation; discontinued 2012)
FRS (Full Resolution
Short Targeted Observation; initiated 2012)
ATO (Along-Track
Oversampled Targeted Observation; initiated 2011)
ATU (Along-Track
Oversampled Targeted Observation; initiated 2012)
EPF (Atmospheric
Survey EPF; discontinued 2012)
LMB (Limb Scan
Observation; initiated 2009, discontinued 2017)
TOD (Tracking
Optical Depth Observation; initiated 2007, discontinued 2017)
MSP (Multispectral
Survey; discontinued 2018)
HSP (Hyperspectral
Survey; initiated 2010, discontinued 2018)
HSV (Hyperspectral
Survey - VNIR only, pixels 10x-binned; initiated 2010)
MSV (Hyperspectral
Survey - VNIR only, pixels 5x-binned; initiated 2012)
MSW (Multispectral
Window; discontinued 2008)
FFC (Flat Field
Calibration)
CAL (Radiometric
Calibration)
ICL (Calibration
source intercalibration)
FUN (Functional
test)
UNK (no valid EDRs
within observation that indicate class type)
ObsID = nnnnnnnn, Observation
ID, unique for the whole CRISM mission, expressed as a hexadecimal number
Counter= nn, a monotonically
increasing ordinal counter of EDRs from one Observation ID, expressed as a
hexadecimal number
Activity = for an EDR, type of observation, e.g.
BI### – Bias measurements / Macro#
DF### – Dark field
measurements / Macro#
LP### – Lamp
measurements / Macro #
SP### – Sphere
measurements / Macro #
SC### – Scene
measurements / Macro #
T1### – Focal plane
electronics test pattern 1 / Macro #
T2### – Focal plane
electronics test pattern 2 / Macro #
T3### – Focal plane
electronics test pattern 3 / Macro #
T4### – Focal plane
electronics test pattern 4 / Macro #
T5### – Focal plane
electronics test pattern 5 / Macro #
T6### – Focal plane
electronics test pattern 6 / Macro #
T7### – Focal plane
electronics test pattern 7 / Macro #
UN### – Instrument
configuration does not match macro library / Macro #
for a TRDR, type of product, e.g.
RA### – Radiance / Macro#
IF### – I/F / Macro #
for a DDR or LDR, type of product, e.g.
DE### – Derived
product / Macro#
SensorID = S or L for VNIR or
IR
Filetype = EDR, DDR, LDR, or "TRR" for TRDR
version = 0, 1,...,9, a, ..., z
Ext = IMG, TAB, or LBL
Each CRISM data product of these types has a product ID
that is unique within its data set. The product ID scheme for CRISM EDR, DDR, and TRDR products is as follows (see file naming convention for
allowable values for each field):
CCCNNNNNNNN_XX_AAAAAS_TTTV
|
Where:
|
|
|
|
CCC
|
=
|
Class Type
|
|
NNNNNNNN
|
=
|
Observation ID as a hexadecimal number
|
|
XX
|
=
|
Counter within this observation
|
|
AAAAA
|
=
|
Activity Type
|
|
S
|
=
|
Sensor ID
|
|
TTT
|
=
|
Product Type (EDR, DDR, LDR, "TRR" for TRDR)
|
|
V
|
=
|
Product version number
|
The file naming
convention for EDR validation report is as follows.
(ClassType)(ObsID)_(SensorID)_VALIDATION.TXT
where:
ClassType =
FRT (Full Resolution
Targeted Observation; discontinued 2012)
HRL (Half Resolution
Long Targeted Observation; discontinued 2012)
HRS (Half Resolution
Short Targeted Observation; discontinued 2012)
FRS (Full Resolution
Short Targeted Observation; initiated 2012)
ATO (Along-Track
Oversampled Targeted Observation; initiated 2011)
ATU (Along-Track
Oversampled Targeted Observation; initiated 2012)
EPF (Atmospheric
Survey EPF; discontinued 2012)
LMB (Limb Scan
Observation; initiated 2009, discontinued 2017)
TOD (Tracking
Optical Depth Observation; initiated 2007, discontinued 2017)
MSP (Multispectral
Survey; discontinued 2018)
HSP (Hyperspectral
Survey; initiated 2010, discontinued 2018)
HSV (Hyperspectral
Survey - VNIR only, pixels 10x-binned; initiated 2010)
MSV (Hyperspectral
Survey - VNIR only, pixels 5x-binned; initiated 2012)
MSW (Multispectral
Window; discontinued 2008)
FFC (Flat Field
Calibration)
CAL (Radiometric
Calibration)
ICL (Calibration
source intercalibration)
FUN (Functional
test)
UNK (no valid EDRs
within observation that indicate class type)
ObsID = nnnnnnnn, Observation
ID, unique for the whole CRISM mission, expressed as a hexadecimal number
SensorID = S or L
Each validation report has a
product ID that is unique within its data set. The product ID scheme for CRISM
EDR validation reports is as follows (see file
naming convention for allowable values for each field):
CCCNNNNNNNN_S_VALIDATION
|
Where:
|
|
|
|
CCC
|
=
|
Class Type
|
|
NNNNNNNN
|
=
|
Observation ID as a hexadecimal number
|
|
S
|
=
|
Sensor ID
|
2.3.4.3
EDR Browse Products
The file naming
convention for the HTML browse products
for EDRs is as follows.
(ClassType)(ObsID)_BROWSE_EDR(version).(Ext) where:
ClassType =
FRT (Full Resolution
Targeted Observation; discontinued 2012)
HRL (Half Resolution
Long Targeted Observation; discontinued 2012)
HRS (Half Resolution
Short Targeted Observation; discontinued 2012)
FRS (Full Resolution
Short Targeted Observation; initiated 2012)
ATO (Along-Track
Oversampled Targeted Observation; initiated 2011)
ATU (Along-Track
Oversampled Targeted Observation; initiated 2012)
EPF (Atmospheric
Survey EPF; discontinued 2012)
LMB (Limb Scan
Observation; initiated 2009, discontinued 2017)
TOD (Tracking
Optical Depth Observation; initiated 2007, discontinued 2017)
MSP (Multispectral
Survey; discontinued 2018)
HSP (Hyperspectral
Survey; initiated 2010, discontinued 2018)
HSV (Hyperspectral
Survey - VNIR only, pixels 10x-binned; initiated 2010)
MSV (Hyperspectral
Survey - VNIR only, pixels 5x-binned; initiated 2012)
MSW (Multispectral
Window; discontinued 2008)
FFC (Flat Field
Calibration)
CAL (Radiometric
Calibration)
ICL (Calibration
source intercalibration)
FUN (Functional
test)
UNK (no valid EDRs
within observation that indicate class type)
ObsID= nnnnnnnn,
Observation ID, unique for the whole CRISM mission, expressed as a hexadecimal
number
version = 0, 1,...,9, a,
..., z
Ext = HTML
Each EDR HTML browse product has a product ID that is unique within its data
set. The product ID scheme for CRISM EDR HTML browse products is as follows:
CCCNNNNNNNN_BROWSE_EDRV
|
Where:
|
|
|
|
CCC
|
=
|
Class Type
|
|
NNNNNNNN
|
=
|
Observation ID as a hexadecimal number
|
|
TTT
|
=
|
Product Type (EDR)
|
|
V
|
=
|
Product version number
|
The file naming
convention for the PNG browse products
for EDRs is as follows.
(ClassType)(ObsID)_(Counter)_
(Activity)(SensorID)_RAW(version).(Ext)
where:
Counter = nn, a monotonically increasing ordinal counter of
EDRs from one Observation ID
Activity = for an EDR, type of observation, e.g.
BInnn – Bias
measurements / Macro#
DFnnn – Dark field
measurements / Macro#
LPnnn – Lamp
measurements / Macro #
SPnnn – Sphere
measurements / Macro #
SCnnn – Scene
measurements / Macro #
T1nnn – Focal plane
electronics test pattern 1 / Macro #
T2nnn – Focal plane
electronics test pattern 2 / Macro #
T3nnn – Focal plane
electronics test pattern 3 / Macro #
T4nnn – Focal plane
electronics test pattern 4 / Macro #
T5nnn – Focal plane
electronics test pattern 5 / Macro #
T6nnn – Focal plane
electronics test pattern 6 / Macro #
T7nnn – Focal plane
electronics test pattern 7 / Macro #
UNnnn – Instrument
configuration does not match macro library / Macro #
SensorID= S for VNIR, or L for
IR
version= 0, 1,...,9, a,
..., z
Ext= PNG
Each EDR PNG browse product will have a product ID that is unique within its
data set. The product ID scheme for CRISM EDR PNG browse products is as
follows:
CCCNNNNNNNN_XX_AAAAAS_RAWV
|
Where:
|
|
|
|
CCC
|
=
|
Class Type
|
|
NNNNNNNN
|
=
|
Observation ID as a hexadecimal number
|
|
XX
|
=
|
Counter within this observation
|
|
AAAAA
|
=
|
Activity Type
|
|
S
|
=
|
Sensor ID
|
|
V
|
=
|
Product version number
|
The file naming
convention for MRDR products is as follows.
(Tile)_(ProductType)(Subtype)_
(CLat)(Hemisphere) (CLon)_(Resolution)_version.(Ext)
where:
Tile
= Tnnnn, tile number with tile 0001 at the south pole, increasing spiraling east
northward
Product
Type = "MRR" for MRDR
Subtype
of product, e.g.
IF
– I/F
AL
– Lambert albedo
SU
– Summary Products
DE
– Derived Products for I/F
DL – Derived Products for
Lambert albedo
WV
– List of wavelengths and wavelength ranges of radiance and I/F images
CLat
= nn, Planetocentric latitude of tile center
Hemisphere
= #, N or S for north or south latitude
CLon
= nnn, East longitude of tile center (rounded)
Resolution
= nnnn, in map-projected pixels per degree, e.g. 0256 pixels per degree modified
in the final delivery to 0327 pixels per degree
version
= 0, 1,..., 9, a,..., z
Ext =
IMG, TAB, or LBL
The product ID scheme for the
CRISM MRDRs is as follows:
TNNNN_TTTSS_XXDYYY_RRRR_V
|
Where:
|
|
|
|
TNNNN
|
=
|
Tile number
|
|
TTT
|
=
|
Product Type ("MRR" for MRDR)
|
|
SS
|
=
|
Product subtype, i.e., IF, AL, SU, DE, DL, or WV
|
|
XX
|
=
|
Planetocentric latitude of tile center
|
|
D
|
=
|
N or S for north or south latitude
|
|
YYY
|
=
|
East longitude of tile center (rounded)
|
|
RRRR
|
=
|
Map resolution in pixels per degree, e.g. 0256 or 0327
|
|
V
|
=
|
Product version number
|
2.3.4.5
MRDR Browse Products
The browse product nomenclature
follows that of MRDRs except that browse products
type (following the browse product types for TRDRs) is substituted for the type
of image product:
(Tile)_(ProductType)(BrowseProductType)_ (CLat)(Hemisphere)
(CLon)_(Resolution)_ version.(Ext)
where:
Tile
= Tnnnn, tile number with tile 0001 at the south pole, increasing spiraling
northward
Product
Type = MRR
BrowseProductType
= TRU, VNA, FEM, FM2, FAL, IRA, MAF, HYD, PHY, PFM, PAL, HYS, ICE, IC2, CAR,
CR2, CHL, or TAN. The full list of products is described in section 3.11.3.
CLat
= nn, Planetocentric latitude of tile center
Hemisphere
= #, N or S for north or south latitude
CLon
= nnn, East longitude of tile center (rounded)
Resolution
= nnnn, in map-projected pixels per degree, e.g. 0256 pixels per degree
modified in the final delivery to 0327 pixels per degree
version
= 0, 1,..., 9, a,..., z
Ext =
IMG – 3 band byte
scaled image cube
HDR – Associated
ENVI header
PNG – 3 band byte
scaled binary image cube with alpha transparency channel
LBL – Associated PDS
label
The product ID scheme for the
CRISM MRDR browse products is as follows:
TNNNN_TTTBBB_XXDYYY_RRRR_V
|
Where:
|
|
|
|
TNNNN
|
=
|
Tile number
|
|
TTT
|
=
|
Product Type ("MRR" for MRDR)
|
|
BBB
|
=
|
Browse Product Type, TRU, VNA, FEM, FM2, FAL, IRA, MAF,
HYD, PHY, PFM, PAL, HYS, ICE, IC2, CAR, CR2, CHL, or TAN
|
|
XX
|
=
|
Planetocentric latitude of tile center
|
|
D
|
=
|
N or S for north or south latitude
|
|
YYY
|
=
|
East longitude of tile center (rounded)
|
|
RRRR
|
=
|
Map resolution in pixels per degree, e.g. 0256 or 0327
|
|
V
|
=
|
Product version number
|
2.3.4.6
VRDRs
The file naming
convention for VRDR products is as follows.
(Tile)_(ProductType)(Subtype)_
(CLat)(Hemisphere) (CLon)_(Resolution)_version.(Ext)
where:
Tile
= Tnnnn, tile number with tile 0001 at the south pole, increasing spiraling
east northward
Product
Type = "VRR" for VRDR
Subtype
of product, e.g.
AL
– Lambert albedo
SU
– Summary Products
DE
– Derived Products
WV
– List of wavelengths and wavelength ranges of radiance and I/F images
CLat
= nn, Planetocentric latitude of tile center
Hemisphere
= #, N or S for north or south latitude
CLon
= nnn, East longitude of tile center (rounded)
Resolution
= nnnn, in map-projected pixels per degree, 0654 pixels per degree
version
= 0, 1,..., 9, a,..., z
Ext =
IMG, TAB, or LBL
The product ID scheme for the
CRISM VRDRs is as follows:
TNNNN_TTTSS_XXDYYY_RRRR_V
|
Where:
|
|
|
|
TNNNN
|
=
|
Tile number
|
|
TTT
|
=
|
Product Type ("VRR" for VRDR)
|
|
SS
|
=
|
Product subtype, i.e., AL, SU, DE, or WV
|
|
XX
|
=
|
Planetocentric latitude of tile center
|
|
D
|
=
|
N or S for north or south latitude
|
|
YYY
|
=
|
East longitude of tile center (rounded)
|
|
RRRR
|
=
|
Map resolution in pixels per degree, 0654
|
|
V
|
=
|
Product version number
|
2.3.4.7
VRDR Browse Products
The browse product nomenclature
follows that of VRDRs except that browse products
type (following the browse product types for TRDRs) is substituted for the type
of image product:
(Tile)_(ProductType)(BrowseProductType)_ (CLat)(Hemisphere)
(CLon)_(Resolution)_ version.(Ext)
where:
Tile
= Tnnnn, tile number with tile 0001 at the south pole, increasing spiraling
northward
Product
Type = VRR
BrowseProductType
= TRU, VNA, FEM, or FM2
CLat
= nn, Planetocentric latitude of tile center
Hemisphere
= #, N or S for north or south latitude
CLon
= nnn, East longitude of tile center (rounded)
Resolution
= nnnn, in map-projected pixels per degree, e.g. 0654 pixels per degree
version
= 0, 1,..., 9, a,..., z
Ext =
IMG – 3 band byte
scaled image cube
HDR – Associated
ENVI header
PNG – 3 band byte
scaled binary image cube with alpha transparency channel
LBL – Associated PDS
label
The product ID scheme for the
CRISM VRDR browse products is as follows:
TNNNN_TTTBBB_XXDYYY_RRRR_V
|
Where:
|
|
|
|
TNNNN
|
=
|
Tile number
|
|
TTT
|
=
|
Product Type ("VRR" for VRDR)
|
|
BBB
|
=
|
Browse Product Type, TRU, VNA, FEM, or FM2
|
|
XX
|
=
|
Planetocentric latitude of tile center
|
|
D
|
=
|
N or S for north or south latitude
|
|
YYY
|
=
|
East longitude of tile center (rounded)
|
|
RRRR
|
=
|
Map resolution in pixels per degree, e.g. 0256 or 0327
|
|
V
|
=
|
Product version number
|
2.3.4.8
TERs and MTRDRs
The file naming convention for TERs
and MTRDRs closely parallels that for TRDRs, with the caveat that only those
class types of hyperspectral targeted observations that are accompanied by 1-
or 2-sided EPF scans are processed to TERs or MTRDRs:
(ClassType)(ObsID)_(Counter)_
(Activity)(SensorID)_(Filetype)(version).(Ext)
where:
ClassType
=
FRT (Full Resolution
Targeted Observation)
HRL (Half Resolution
Long Targeted Observation)
HRS (Half Resolution
Short Targeted Observation)
ObsID =
nnnnnnnn, Observation ID, unique for the whole CRISM mission, expressed as a
hexadecimal number
Counter
= nn, the ordinal counter carried through from the source EDR, expressed as a
hexadecimal number
Activity
= for a TER/MTRDR, type of product, e.g.
IFnnn – Corrected I/F / Macro #
SUnnn – Spectral
summary parameters / Macro #
SRnnn – Refined
spectral summary parameters / Macro #
INnnn – Data
processing information maps / Macro #
DEnnn – Derived data
product / Macro # (MTRDR only)
WVnnn – Wavelength
information for the I/F image / Macro #
SensorID
= J (for joined S and L)
A prefix of “BR” in the Activity
portion of the filename identifies the file as a TER/MTRDR Browse Product, in
which case it follows the naming convention specified in section 2.3.4.7.
Filetype
=
TER
(Targeted Empirical Record)
MTR
(Map-projected Targeted Record – short for MTRDR)
version
= 0, 1,...,9, a, ..., z
Ext =
IMG
– Image cube
HDR
– Associated ENVI header
LBL
– PDS label
The product ID scheme for the
CRISM TERs and MTRDRs is as follows:
CCCNNNNNNNN_XX_AAAAAJ_TTTV
|
Where:
|
|
|
|
CCC
|
=
|
Class Type
|
|
NNNNNNNN
|
=
|
Observation ID as a hexadecimal number
|
|
XX
|
=
|
Counter within this observation
|
|
AAAAA
|
=
|
Activity Type
|
|
J
|
=
|
Sensor ID
|
|
TTT
|
=
|
Product Type (TER, MTR)
|
|
V
|
=
|
Radiometric calibration version number
|
Three data files and a single
PDS detached label file comprise a given TRDR, TER, or MTRDR browse product
file set. The file naming convention is the same across all four files and is
as follows.
(ClassType)(ObsID)_(Counter)_BR(BrowseProductType)(SensorID)_
(Filetype)(version).(Ext)
where:
ClassType
=
FRT (Full Resolution
Targeted Observation)
HRL (Half Resolution
Long Targeted Observation)
HRS (Half Resolution
Short Targeted Observation)
ObsID
= nnnnnnnn, Observation ID, unique for the whole CRISM mission, expressed as a
hexadecimal number
Counter
= nn, the ordinal counter carried through from the source EDR, expressed as a
hexadecimal number
BrowseProductType
= TRU, VNA, FEM, FM2, FAL, IRA, MAF, HYD, PHY, PFM, PAL, HYS, ICE, IC2, CAR,
CR2, CHL, or TAN. The full list of products is described in section 3.11.3.
SensorID
= S, L, J (for joined S and L)
Filetype
=
TRR (Targeted Reduced Data Record)
TER
(Targeted Empirical Record)
MTR
(Map-projected Targeted Record – short for MTRDR)
version
= 0, 1,...,9, a, ..., z
Ext =
IMG – 3 band byte
scaled image cube
HDR – Associated
ENVI header
PNG – 3 band byte
scaled binary image cube with alpha transparency channel
LBL – Associated PDS
label
Each TRDR/TER/MTRDR browse
product has a product ID that is unique within its data set. The product ID
scheme for CRISM TRDR/TER/MTRDR browse products is as follows:
CCCNNNNNNNN_XX_BRAAAJ_TTTV
Where:
CCC = Class Type
NNNNNNNN = Observation
ID as a hexadecimal number
XX = Counter
within this observation
AAA = Three character
browse product type
J = Sensor ID
TTT = Product Type
(TRR, TER, MTR)
V = Radiometric
calibration version number
2.3.4.10 CDRs
There are three formats for
CDRs:
§
tabulated ground or flight ancillary
data used during processing from an EDR to radiance (level-6 CDRs)
§
tables of scene and accompanying
calibration EDRs, to process EDRa to CDR4s or TRDRs (level-6 CDRs, with
distinct nomenclature to distinguish them from data-containing files)
§
derived, image-format ground or flight
data used during processing from an EDR to radiance or I/F (level-4 CDRs)
The file naming
convention for data-containing level-6 CDRs is as follows.
(ProductType)(Level)_(Partition)_(Time)_(Product)_(SensorID)_version.(Ext)
where:
ProductType
= CDR
Level
= 6
Partition
= n, partition of the spacecraft clock.
Time
= nnnnnnnnnn, spacecraft start time of applicability of data product; units are
spacecraft clock counts, in units of whole seconds.
Product
= nn, acronym describing data product from Table 3-5
SensorID
= S or L (or J=joint)
Version
= 0, 1,..., 9, a,..., z
Ext =
TAB or LBL
The product ID scheme for
data-containing CRISM level 6 CDRs is as follows:
CCCC_P_TTTTTTTTTT_AA_S_V
|
Where:
|
|
|
|
CCCC
|
=
|
Product Type (CDR6)
|
|
P
|
=
|
Partition number of sclk counts
|
|
TTTTTTTTTT
|
=
|
Start time of applicability, in units of sclk counts
|
|
AA
|
=
|
Acronym for contents of product
|
|
S
|
=
|
Sensor ID
|
|
V
|
=
|
Version
|
The file naming convention for EDR processing tables is as follows.
(Product)_(Sensor)_(YYYY)_(DOY)_version
where:
Product
Type = BTF for before-the-fact predicted, or ATF for after-the-fact actual
Sensor
= VN or IR
YYYY
= year
DOY =
day of year
Version
= nn
The product ID scheme for the
EDR processing tables is as follows:
CCCC_P_TTTTTTTTTT_AA_S_V
|
Where:
|
|
|
|
CCC
|
=
|
Product (BTF or ATF)
|
|
S
|
=
|
Sensor ID
|
|
P
|
=
|
Partition number of sclk counts
|
|
YYYY
|
=
|
Year covered by table
|
|
DOY
|
=
|
Day of year covered by table
|
|
V
|
=
|
Version
|
The file naming
convention for level-4 CDRs is as follows.
(ProductType)(Level)(Partition)(Time)_
(Product)(FrameRate)(Binning)(ExposureParameter)(WavelengthFilter)(Side)(SensorID)_
version.(Ext)
Product
Type = CDR
Level
= 4
Partition
= n, partition of sclk counts
Time
= nnnnnnnnnn, spacecraft start time of applicability of ground data product, or
spacecraft mean time of acquisition of source EDR of flight data product; units are spacecraft clock counts, in units
of whole seconds.
Product
= nn, acronym describing data product from Table 3-19
FrameRate
= n, rate in Hz at which data are taken (0=1 Hz, 1=3.75 Hz, 3=15 Hz, 4=30 Hz, 5
= N/A)
Binning
= n, number of spatial pixels binned (0 = unbinned, 1 = 2x binned, 2 = 5x
binned, 3 = 10x binned, 4 = N/A)
Exposure
parameter = nnn, an integer 1-480 indicating commanded exposure time in units
of (inverse frame rate)/480; 000 if inapplicable
Wavelength
filter = n, and integer 0-3 indicating which onboard menu of rows of the
detector are represented
Side
= #, 1 or 2 for focal plane or sphere bulbs; or 0 if N/A
Sensor
ID = S or L (or J=joint)
version
= 0, 1,..., 9, a,..., z
Ext
= IMG or LBL
The product ID scheme for CRISM
level 4 CDRs is as follows:
CCCCPTTTTTTTTTT_AARBEEEWCS_V
|
Where:
|
|
|
|
CCCC
|
=
|
Product Type (CDR4)
|
|
P
|
=
|
Partition number of sclk counts
|
|
TTTTTTTTTT
|
=
|
Start time of applicability, in units of sclk counts
|
|
AA
|
=
|
Acronym for contents of product
|
|
R
|
=
|
Frame rate
|
|
B
|
=
|
Binning
|
|
EEE
|
=
|
Exposure parameter
|
|
W
|
=
|
Wavelength filter
|
|
C
|
=
|
Side
|
|
S
|
=
|
Sensor ID
|
|
V
|
=
|
Version
|
ADRs (if archived, which is not
planned as of 2023) are hyperdimensional binary tables of derived values, where
the axes of the matrix represent values of a layer of a DDR (e.g., incidence angle, thermal inertia, etc.), and the element in
the matrix is a coefficient used either directly or as an input to correct I/F for predictived atmospheric, photometric, or thermal
effects.
The file naming
convention for ADRs is as follows.
(ProductType)_(ADR_Type)_(Wavelength)_(Partition)_(Time)_version.(Ext)
where:
Product Type = ADR
ADR_Type
= CL, AC, or TE as described in section 3.8
Wavelength = nnnn, in
nanometers; 0000 if not applicable
Partition = n, spacecraft clock
partition.
Time = nnnnnnnnnn, spacecraft
start time of applicability of data product; units are spacecraft clock counts,
in units of whole seconds.
version = 0, 1,..., 9, a,..., z
Ext = DAT or LBL
The product ID scheme for CRISM
ADRs is as follows:
CCC_AA_NNNN_P_TTTTTTTTTT_V
|
Where:
|
|
|
|
CCC
|
=
|
Product Type (ADR)
|
|
AA
|
=
|
Acronym for contents of product
|
|
NNNN
|
=
|
Wavelength in nearest whole nanometers
|
|
P
|
=
|
Partition number of sclk counts
|
|
TTTTTTTTTT
|
=
|
Start time of applicability, in units of sclk counts
|
|
V
|
=
|
Version
|
2.3.4.12 SPICE Files
The file naming convention
CRISM-generated SPICE kernels
is as follows.
MRO_CRISM_(KernelType)_(YYYY_DOY)_(Filetype)_(version).(Ext)
where:
Kernel Type =
FK (frames kernel)
IK (instrument kernel)
CK (gimbal C-kernel)
MK (metakernel)
YYYY_DOY is
the year and day of year of the start of a 2-week period covered in a single
gimbal C kernel or metakernel; or else these fields are filled with zeroes
filetype =
P for predicted
R for reconstructed
N for not applicable
version = 0, 1,...,9, a, ..., z
Ext =
TI (text-format, instrument kernel)
TF (text-format, frames kernel)
BC (binary-format, gimbal C kernel)
BO (binary-format, gimbal offset C kernel)
TM (text-format, metakernel)
2.3.4.13 Extra
Products
Files that document the history
of instrument software settings have a format and nomenclature like that of
level 6 CDRs, as described in section 2.3.4.8.
The file naming
convention for the macro dictionary is as follows.
MacroDict(YYYYMMDD).PY
where:
YYYYMMDD = year, month, and day
of the last onground revision of the macro dictionary
The file naming
convention for the description of the image data generated by each macro is as
follows.
MacroDict(YYYYMMDD)_BURSTS.CSV
The file naming
convention for the summary of each macro's function is as follows.
MacroDict(YYYYMMDD)_SUM.CSV
The nomenclature of tables that connect specific
observations with regions of interest on Mars, science objectives, and specific
observation conditions is described in Table 2-13. For the SITE_ID, ANCILLARY,
REQ_ID, and CORRESP tables may be one table for the mission, and the string
YYYY_MM_DD is the date of the last update. For the OBS_ID table, there are
multiple tables, as indicated by YYYY_MM_00 for the year and month included in
the table.
The file naming convention for the TER and MTR Extras
products is presented in Appendix P2.
Table
2-13. Nomenclature of Observation Tracking Tables
|
File Name
|
File Contents
|
|
SITE_ID_YYYY_MM_DD.TAB
|
OPTIONAL: Description of the locations and physical
features of sites of interest on Mars, compiled by the CRISM science team.
Date is last update.
|
|
SITE_ID_YYYY_MM_DD.HDR
|
OPTIONAL: Header record to site ID table.
|
|
SITE_ID_YYYY_MM_DD.LBL
|
OPTIONAL: Label to site ID table.
|
|
ANCILLARY_YYYY_MM_DD.TAB
|
OPTIONAL: Tabulated statistics
on physical properties of sites of interest on Mars, compiled by the CRISM
science team . Date is last update.
|
|
ANCILLARY_YYYYMMDD.HDR
|
OPTIONAL: Header record to
ancillary information table.
|
|
ANCILLARY_YYYYMMDD.LBL
|
OPTIONAL: Label to ancillary
information table.
|
|
REQ_ID_MC##-####_YYYY_MM_DD.TAB
|
OPTIONAL: A table of request IDs, with one or more
entries, specifying the desired observing conditions such as Ls. One table
per site ID (MC##-####).
|
|
REQ_ID_MC##-####_YYYY_MM_DD.HDR
|
OPTIONAL: Generic header record to request ID tables.
|
|
REQ_ID_MC##-####_YYYY_MM_DD.LBL
|
OPTIONAL: Label to request ID tables.
|
|
OBS_ID_YYYY_MM_DD.TAB
|
Table summarizing the date and characteristics of each
observation actually taken.
|
|
OBS_ID_YYYY_MM_DD.HDR
|
Header record to observation ID table.
|
|
OBS_ID_YYYY_MM_DD.LBL
|
Label to observation ID table.
|
|
CORRESP_YYYY_MM_DD.TAB
|
OPTIONAL: Correpondence table in which one line gives a
site ID, request ID, and target ID where there is geographic overlap.
|
|
CORRESP_YYYY_MM_DD.HDR
|
OPTIONAL: Header record to correspondence table.
|
|
CORRESP_YYYY_MM_DD.LBL
|
OPTIONAL: Label to correspondence table.
|
The CRISM data product complies with the PDS standards for
file formats and labels, specifically the PDS image and table data objects
[Applicable Documents 6 and 7].
Two time standards are used in
CRISM data products:
§
spacecraft time in seconds (PDS label
keywords SPACECRAFT_CLOCK_START_-COUNT and SPACECRAFT_CLOCK_STOP_COUNT)
§
UTC (PDS label keywords START_TIME,
STOP_TIME, and PRODUCT_CREA-TION_TIME)
One
additional time-related field is used in CRISM data products:
§
target ID, which is a unique identifier
associated with each MRO observation (PDS label keyword OBSERVATION_ID)
The cartographic coordinate
system used for the CRISM data products conforms to the IAU planetocentric
system with East longitudes being positive. The IAU2000 reference system [7]
for Mars cartographic coordinates and rotational elements was used for computing
latitude and longitude coordinates.
Data validation is an iterative
process throughout the history of processing the data set. Key steps in the
process are given below.
For each observation, every EDR is
compared against frame-by-frame predictions of commanded instrument state. The
results of the comparison are written as a data validation report that
accompanies the EDRs for that observation.
In the case of a hardware or configuration discrepancy
(shutter position, lamp status or level, pixel binning, frame rate, channel
selection, power status of detectors), processing of the image data to RDR
level does not occur in order to avoid introducing invalid results. Missing
frames or portions of frames are replaced with a value of 65535 (this cannot be
a valid data value) and only that portion of the EDR is
not further processed.
If an expected calibration data set (background, focal
plane lamp,
or sphere) is not successfully acquired and downloaded, the next closest in
time calibration can be used. In this case there is a discrepancy between the
predicted EDR processing table and the actual one, and this is recorded in the
data quality index upon processing of the scene EDR to the TRDR level.
A data quality keyword is used to encode Figures-of-Merit
into one parameter that is included in each line of the list file with the EDR and TRDR. This begins with the EDR and is modified in the TRDR. At the EDR
level, missing data, saturation, and basic hardware status are assessed.
At the TRDR level there is the additional option (not
currently implemented) to add further information: whether a target’s
latitude and longitude are within the boundaries of an observation, for the
central swath of a targeted observation; whether underexposure occurred; usage
of temporally non-adjacent calibration files (due to loss of data from a
background, bias, or sphere macro);
or high spectrometer housing or detector temperature is flagged. Once the
summary product backplanes
are derived, an excessive violet I/F can
be flagged as a possible indication of water ice clouds.
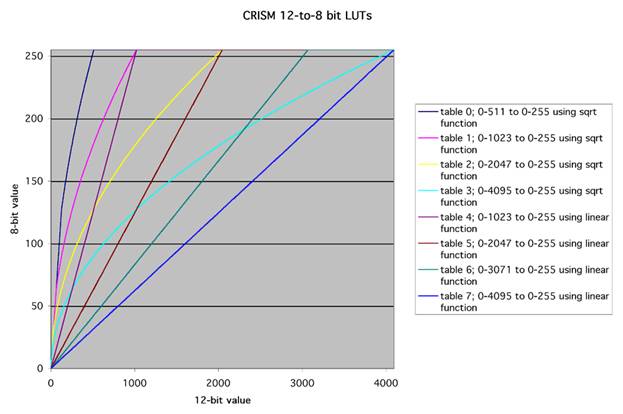
The 16-byte data quality field is interpreted as follows:
Byte 0: populated in EDR;
1 = focal planes not properly powered; 0 = focal planes properly powered;
Byte 1: populated in EDR;
updated in RDR; 1 = saturated data (8-bit 255; 12-bit 4095; or within 10% of
14-bit saturation) present outside of bad pixel mask; 0 = saturated data not
present;
Byte 2: populated in EDR;
1 = missing data (some pixels populated with 65535); 0 = no missing data;
Byte 3: populated in EDR:
1 = shutter out of commanded position; 0 = shutter in position;
Byte 4: populated in EDR;
1 = focal plane lamp setting
out of commanded range; 0 = focal plane
lamp setting in commanded range;
Byte 5: populated in EDR;
1 = sphere goal out of commanded range; 0 = sphere goal in commanded range;
Byte 6: populated in EDR;
1 = more lines or bands than expected; 0 = not more than expected;
Byte 7: populated in RDR; 1 = VNIR detector out of
calibrated temperature range; 0 = VNIR
detector within calibrated temperature range
(Byte 8: populated in RDR; 1 = IR detector out of
calibrated temperature range; 0 = IR detector
within calibrated temperature range)
(Byte 9: populated in RDR; 1 = sphere temperature
out of calibrated range; 0 = temperature sphere within calibrated range)
(Byte 10: populated in RDR; 1= spectrometer housing
temperature >-75C; 0 = spectrometer housing temperature ≤-75C)
(Byte 11: populated in RDR; 1 = target not covered; 0 =
target covered) (Note: not populated)
(Byte 12: populated in RDR; 1 = non-adjacent calibration
files used; 0 = temporally adjacent calibration files used) (Note: not
populated)
(Byte 13: populated in RDR; 1= violet I/F from
summary product backplane
suggests clouds or ice, value >0.1; 0 = low violet I/F) (Note: not populated)
Byte 14 through Byte 15 spare
Missing frames or portions of frames or saturated data are
indicated in an RDR with a value of 65535 (this cannot be a valid data value).
Note that for quality control purposes, IR data acquired
at a detector temperature >127.5K (127.7K effective Feb. 2011) are delivered
as EDRs but not as products processed further such as TRDRs.
Once data are calibrated to units of radiance, some of the
pixels that are present in an EDR cannot
have meaningful values. These include the regions at the edge of each detector
which contain background measurements that are used during application of the
calibration algorithm (see Appendix L). Those pixels are set to a value of
exactly 65535, which cannot have a meaningful significant in the units used for
radiance or I/F.
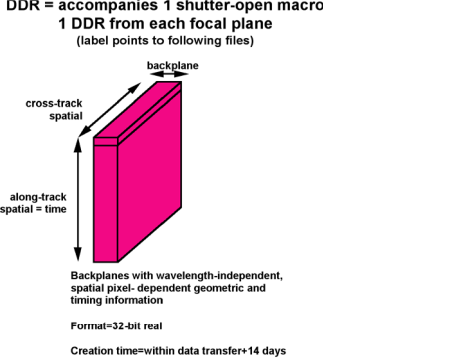
At the SOC, EDRs were constructed from each observation
with a distinct observation ID. An EDR consists
of a part or all of the output from one of the constituent command macros that
make up one observation tagged by a unique observation ID. The data in one EDR
represent a consistent instrument configuration (shutter position, frame rate,
pixel binning, compression,
exposure time, on/off status and setting of different lamps). This is shown
schematically in Figure 3-1. There is a single multiple-band image (suffix
*.IMG) stored in one file, plus a detached list file in which each record has
information specific to one frame of the multiple-band image (suffix *.TAB).
One label points to both files.
The multiple-band image has dimensions of sample, line,
and wavelength. The size of the multiple-band image varies according to the
observation mode but is deterministic given the macro ID. A typical
multiple-band image might have XX pixels in the sample (cross-track) dimension,
YY pixels in the line (along-track) dimension, and ZZ pixels in the wavelength
dimension, where
§
XX=640/binning, where 640 is the number of columns read off the
detector, and binning is 1, 2, 5, or 10,
§
YY=the number of frames of data with a consistent instrument
configuration , and
§
ZZ=the number of detector rows (wavelengths) that are retained by
the instrument.
Pixels are 16-bit unsigned integer values, most
significant bit first.
Appended to the multiple-band image is a binary table of
the detector rows that were used, as selected by the wavelength filter. This is a one-column table, with each row containing one detector row number
expressed as a 16-bit unsigned integer values, most significant bit first.
Data are not precisely registered in the spectral
direction. For one column, the projection onto Mars’ surface may vary by as
much as ±0.4 detector elements in the XX dimension depending on position in the
FOV (distortions are worst at the edges of the VNIR and IR FOVs). For a single
wavelength, its location in the ZZ direction may vary by as much as ±1 detector
element depending on wavelength (distortions are worst at the short- and
long-wavelength ends of the IR detector).
The detached comma-separated ASCII file is YY lines in
length, containing raw instrument housekeeping plus
other frame dependent information. Locations of the temperature sensors and
heaters whose states are reported in the housekeeping are shown in Appendix M.
Most of the contents of an EDR represent unmodified but rearranged values from the data stream. The data stream downlinked by
the spacecraft unpacks into a succession of image-like frames with binary
headers containing housekeeping (Table
3-2). For each focal plane, there are 220 housekeeping items that contain full
status of the instrument hardware, including data configuration, lamp and shutter status, gimbal position, a time stamp, and the target ID and macro
within which the frame of data was taken.
To convert to an EDR format,
the headers are stripped off and placed into the list file in text form, and
the frames are merged into a multiple-band image. The list file is based on the
220 housekeeping items.
5 of the items are composite in that each bit of a 32-bit word encodes
particular information on gimbal status or control. These separate items are
not broken out, except for the gimbal status at the beginning, middle, and end
of each exposure, from which gimbal position is broken out (3 additional
items). The housekeeping is pre-pended with spaces for 10 additional
frame-specific items useful in data validation, processing, and sorting, for a
total of 233 items per frame. Not all of the 10 additional items may be
populated:
§
A data quality parameter produced
during data validation, as discussed in section 2.5
§
Ls, degrees
§
Solar distance, km
§
Time of day at center of FOV, hhmm.ss
with 1 Mars solar day = 2400.00
§
Preliminary latitude at center of FOV,
degrees
§
Preliminary longitude at center of FOV,
degrees
§
Preliminary i (incidence angle)
at center of FOV, degrees
§
Preliminary e (emission angle)
at center of FOV, degrees
§
Preliminary g (phase angle) at
center of FOV, degrees
§
Predicted dust opacity, unitless
The pointing and geometric information is derived from
spacecraft positions and quaternions plus the gimbal position. Predicted dust
opacity is interpolated from an ADR .
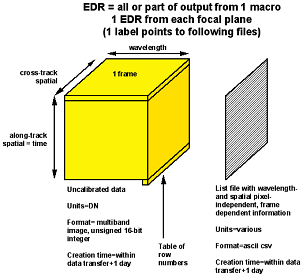
Figure 3-1. Contents of a CRISM Experiment Data Record
(EDR).
Table 3-2. Items in housekeeping list
file
|
Column
|
Mnemonic
|
Description
|
Source of
information
|
Length
(bytes)
|
Format (and range if
applicable)
|
Notes
|
|
1
|
DATA_QUALITY_CODE
|
Data quality
|
Added parameter
|
16
|
Integer
|
1,2
|
|
2
|
SOLAR_LONGITUDE
|
Ls
|
Added parameter
|
7
|
|
1,2
|
|
3
|
SOLAR_DISTANCE
|
Solar distance
|
Added parameter
|
12
|
Float
|
1,2
|
|
4
|
LOCAL_TIME
|
Local time (hh:mm:ss)
|
Added parameter
|
7
|
Character
|
1,2
|
|
5
|
CENTER_LATITUDE
|
Estimated latitude
|
Added parameter
|
7
|
Float
|
1,2
|
|
6
|
CENTER_LONGITUDE
|
Estimated longitude
|
Added parameter
|
7
|
Float
|
1,2
|
|
7
|
CENTER_INCIDENCE_ANGLE
|
Estimated incidence
angle
|
Added parameter
|
7
|
Float
|
1,2
|
|
8
|
CENTER_EMISSION_ANGLE
|
Estimated emission angle
|
Added parameter
|
7
|
Float
|
1,2
|
|
9
|
CENTER_PHASE_ANGLE
|
Estimated phase angle
|
Added parameter
|
7
|
Float
|
1,2
|
|
10
|
PREDICTED_DUST_OPACITY
|
Predicted dust opacity
|
Added parameter
|
5
|
Float
|
1,2
|
|
11
|
SYNCHRONIZATION_PATTERN
|
Synchronization pattern
|
Spectrometer Image
Header
|
10
|
Integer; valid value
4277809352
|
1,3
|
|
12
|
DATATYPE
|
Type of data (0 for
image data; 1 for encoder diagnostics)
|
Spectrometer Image
Header
|
5
|
Integer
|
1,3
|
|
13
|
NUMLINES
|
Amount of image data
sent (lines, 0 - 480)
|
Spectrometer Image
Header
|
3
|
Integer
|
1,3
|
|
14
|
EXPOSURE_MET
|
Spacecraft time of
exposure, in spacecraft clock units
|
Spectrometer Image
Header
|
10
|
Integer
|
1,3
|
|
15
|
EXPOSURE_SS
|
Time of exposure
fractional second (1/216 seconds)
|
Spectrometer Image
Header
|
5
|
Integer
|
1,3
|
|
16
|
SCAN_MOTOR_STATUS1
|
Scan motor status word 1
|
Spectrometer Image
Header
|
16
|
Character; see Table 3-3
for significance of each character
|
1,3
|
|
17
|
SCAN_MOTOR_STATUS2
|
Scan motor status word 2
|
Spectrometer Image
Header
|
16
|
Character; see Table 3-3
for significance of each character
|
1,3
|
|
18
|
SCAN_MOTOR_STATUS3
|
Scan motor status word 3
|
Spectrometer Image
Header
|
16
|
Character; see Table 3-3
for significance of each character
|
1,3
|
|
19
|
SCAN_MOTOR_ENCPOS1
|
Angular position of
gimbal, beginning of frame
|
Derived from scan motor
status word 1
|
8
|
Integer
|
1,3
|
|
20
|
SCAN_MOTOR_ENCPOS2
|
Angular position of
gimbal, middle of frame
|
Derived from scan motor
status word 2
|
8
|
Integer
|
1,3
|
|
21
|
SCAN_MOTOR_ENCPOS3
|
Angular position of
gimbal, end of frame
|
Derived from scan motor
status word 3ß
|
8
|
Integer
|
1,3
|
|
22
|
SPECT_ID
|
Spectrometer identifier
|
Spectrometer Image
Header
|
1
|
Integer; 0 = IR, 1 =
VNIR
|
1,3
|
|
23
|
TEMP_MON
|
Temperature monitoring enabled
or disabled
|
Spectrometer Image
Header
|
1
|
Integer; 0 = Off, 1 = On
|
1,3
|
|
24
|
EXPOSURE
|
Exposure time parameter;
number of 1/480ths of inverse frame rate; specified separately for each
detector
|
Spectrometer Image
Header
|
3
|
0 - 480
|
1,3
|
|
25
|
RATE
|
Rate of frame
acquisition; 0 = 1 Hz; 1 = 3.75 Hz; 2 = 5 Hz; 3 = 15 Hz; 4 = 30 Hz
|
Spectrometer Image
Header
|
1
|
Integer; 0-4
|
1,3
|
|
26
|
SOURCE
|
Data source, either
actual detector or a test pattern
|
Spectrometer Image
Header
|
1
|
Integer; 0 = Detector,
1 - 7 = Test pattern
|
1,3
|
|
27
|
FILTER
|
Wavelength filter; which
onboard table is used to define which detector rows are recorded
|
Spectrometer Image
Header
|
1
|
Integer; 0 – 3
|
1,3
|
|
28
|
BINNING
|
Pixel binning mode; 0 = 1:1, 1 = 2:1, 2 = 5:1, 3 = 10:1
|
Spectrometer Image
Header
|
1
|
Integer; 0 – 3
|
1,3
|
|
29
|
LOSSY
|
|
Spectrometer Image
Header
|
1
|
Integer; 0 = Disable, 1
= Enable
|
1,3
|
|
30
|
FAST
|
Enable/disable Fast
compression
|
Spectrometer Image
Header
|
1
|
Integer; 0 = Disable, 1
= Enable
|
1,3
|
|
31
|
DPU_BOARD_TEMP
|
DPU_PWR_0 (DPU power board
temperature)
|
Analog Status
|
5
|
Integer
|
1,4
|
|
32
|
DPU_P5_VOLTAGE
|
DPU_PWR_1 (DPU +5 voltage)
|
Analog Status
|
5
|
Integer
|
1,4
|
|
33
|
DPU_P5_CURRENT
|
DPU_PWR_3 (DPU +5 current)
|
Analog Status
|
5
|
Integer
|
1,4
|
|
34
|
SCAN_MOT_CURR
|
DPU_PWR_4 (Scan motor
current)
|
Analog Status
|
5
|
Integer
|
1,4
|
|
35
|
IR_BOARD_TEMP
|
IR_PWR_0 (IR power board temperature)
|
Analog Status
|
5
|
Integer
|
1,4
|
|
36
|
IR_FPU_P12_VOLTAGE
|
IR_PWR_1 (IR focal plane
unit [FPU] +12 voltage)
|
Analog Status
|
5
|
Integer
|
1,4
|
|
37
|
IR_FPU_P7_VOLTAGE
|
IR_PWR_2 (IR FPU +7
voltage)
|
Analog Status
|
5
|
Integer
|
1,4
|
|
38
|
IR_FPU_CURRENT
|
IR_PWR_3 (IR FPU current)
|
Analog Status
|
5
|
Integer
|
1,4
|
|
39
|
HEATER_34_CURRENT
|
IR_PWR_4 (Heater 3 & 4
current)
|
Analog Status
|
5
|
Integer
|
1,4
|
|
40
|
VNIR_BOARD_TEMP
|
VNIR_PWR_0 (VNIR power
board temperature)
|
Analog Status
|
5
|
Integer
|
1,4
|
|
41
|
VNIR_FPU_P12_VOLTAGE
|
VNIR_PWR_1 (VNIR FPU +12
voltage)
|
Analog Status
|
5
|
Integer
|
1,4
|
|
42
|
VNIR_FPU_P7_VOLTAGE
|
VNIR_PWR_2 (VNIR FPU +7
voltage)
|
Analog Status
|
5
|
Integer
|
1,4
|
|
43
|
VNIR_FPU_CURRENT
|
VNIR_PWR_3 (VNIR FPU
current)
|
Analog Status
|
5
|
Integer
|
1,4
|
|
44
|
HEATER_12_CURRENT
|
VNIR_PWR_4 (Header 1 &
2 current)
|
Analog Status
|
5
|
Integer
|
1,4
|
|
45
|
COOL_BOARD_TEMP
|
COOL_PWR_0 (Cooler power
board temperature)
|
Analog Status
|
5
|
Integer
|
1,4
|
|
46
|
COOL_P15_VOLTAGE
|
COOL_PWR_1 (Cooler +15
voltage)
|
Analog Status
|
5
|
Integer
|
1,4
|
|
47
|
COOL_CURRENT
|
COOL_PWR_3 (Cooler current)
|
Analog Status
|
5
|
Integer
|
1,4
|
|
48
|
HOP_HEATER_12_CURR
|
COOL_PWR_4 (High-output
paraffin actuator [HOP] heater 1 & 2 current)
|
Analog Status
|
5
|
Integer
|
1,4
|
|
49
|
SHUT_MOTOR_CURR_IR
|
IR_FP_0 (Shutter motor
current (IR))
|
Analog Status
|
5
|
Integer
|
1,4
|
|
50
|
IR_DETECTOR_TEMP1
|
IR_FP_1 (IR detector
temperature 1)
|
Analog Status
|
5
|
Integer
|
1,4
|
|
51
|
IR_DETECTOR_TEMP2
|
IR_FP_2 (IR detector
temperature 2)
|
Analog Status
|
5
|
Integer
|
1,4
|
|
52
|
COOLER_TEMP1
|
IR_FP_3 (Cooler temperature
1)
|
Analog Status
|
5
|
Integer
|
1,4
|
|
53
|
COOLER_TEMP2
|
IR_FP_4 (Cooler temperature
2)
|
Analog Status
|
5
|
Integer
|
1,4
|
|
54
|
COOLER_TEMP3
|
IR_FP_5 (Cooler temperature
3)
|
Analog Status
|
5
|
Integer
|
1,4
|
|
55
|
SHUT_MOTOR_TEMP_IR
|
IR_FP_6 (Shutter motor
temperature (IR))
|
Analog Status
|
5
|
Integer
|
1,4
|
|
56
|
SPHERE_TEMP_IR
|
IR_FP_7 (Integrating sphere temperature
(IR))
|
Analog Status
|
5
|
Integer
|
1,4
|
|
57
|
SPIDER_TEMP_IR
|
IR_FP_8 (Telescope spider
temperature (IR))
|
Analog Status
|
5
|
Integer
|
1,4
|
|
58
|
SPECT_CAVITY_TEMP_IR
|
IR_FP_9 (Spectral cavity
temperature (IR))
|
Analog Status
|
5
|
Integer
|
1,4
|
|
59
|
OSU_CAVITY_TEMP_IR
|
IR_FP_10 (OSU cavity
temperature (IR))
|
Analog Status
|
5
|
Integer
|
1,4
|
|
60
|
IR_FPU_BOARD_TEMP
|
IR_FP_11 (IR FPU board
temperature)
|
Analog Status
|
5
|
Integer
|
1,4
|
|
61
|
IR_SPHERE_CURR
|
IR_FP_12 (IR sphere lamp current)
|
Analog Status
|
5
|
Integer
|
1,4
|
|
62
|
HOP_TEMP_IR
|
IR_FP_13 (HOP temperature
(IR))
|
Analog Status
|
5
|
Integer
|
1,4
|
|
63
|
SHUT_MOTOR_CURR_VNIR
|
VNIR_FP_0 (Shutter motor
current (VNIR))
|
Analog Status
|
5
|
Integer
|
1,4
|
|
64
|
VNIR_DETECTOR_TEMP1
|
VNIR_FP_1 (VNIR detector
temperature 1)
|
Analog Status
|
5
|
Integer
|
1,4
|
|
65
|
VNIR_DETECTOR_TEMP2
|
VNIR_FP_2 (VNIR detector
temperature 2)
|
Analog Status
|
5
|
Integer
|
1,4
|
|
66
|
TELESCOPE_TEMP
|
VNIR_FP_3 (Telescope
temperature (VNIR))
|
Analog Status
|
5
|
Integer
|
1,4
|
|
67
|
OPTICAL_BENCH_TEMP
|
VNIR_FP_4 (Optical bench
temperature (VNIR))
|
Analog Status
|
5
|
Integer
|
1,4
|
|
68
|
SPIDER_TEMP_VNIR
|
VNIR_FP_5 (Telescope spider
temp. (VNIR))
|
Analog Status
|
5
|
Integer
|
1,4
|
|
69
|
SPECT_CAVITY_TEMP_VNIR
|
VNIR_FP_6 (Spectral cavity
temperature (VNIR))
|
Analog Status
|
5
|
Integer
|
1,4
|
|
70
|
OSU_CAVITY_TEMP_VNIR
|
VNIR_FP_7 (OSU cavity
temperature (VNIR))
|
Analog Status
|
5
|
Integer
|
1,4
|
|
71
|
VNIR_FPU_BOARD_TEMP
|
VNIR_FP_8 (VNIR FPU board temperature)
|
Analog Status
|
5
|
Integer
|
1,4
|
|
72
|
BAFFLETEMP
|
VNIR_FP_9 (Baffle
temperature (VNIR))
|
Analog Status
|
5
|
Integer
|
1,4
|
|
73
|
SCAN_PWR
|
Scan motor power
|
Digital Status
|
1
|
Integer; 0 = Off, 3 = On
|
1,5
|
|
74
|
IR_PRI_PWR
|
IR FPU primary power
|
Digital Status
|
1
|
Integer; 0 = Off, 1 = On
|
1,5
|
|
75
|
HTR3_PWR
|
Heater 3 (on cooler
radiator) power
|
Digital Status
|
1
|
Integer; 0 = Off, 1 = On
|
1,5
|
|
76
|
HTR4_PWR
|
Heater 4 (on
spectrometer housing) power
|
Digital Status
|
1
|
Integer; 0 = Off, 1 = On
|
1,5
|
|
77
|
VNIR_PRI_PWR
|
VNIR FPU primary power
|
Digital Status
|
1
|
Integer; 0 = Off, 1 = On
|
1,5
|
|
78
|
HTR1_PWR
|
Heater 1 (on gimbal
electronics housing) power
|
Digital Status
|
1
|
Integer; 0 = Off, 1 = On
|
1,5
|
|
79
|
HTR2_PWR
|
Heater 2 (on gimbal
electronics housing) power
|
Digital Status
|
1
|
Integer; 0 = Off, 1 = On
|
1,5
|
|
80
|
COOL_PRI_PWR
|
Cooler primary power
|
Digital Status
|
1
|
Integer; 0 = Off, 1 = On
|
1,5
|
|
81
|
HOP_HTR1_PWR
|
HOP heater 1 power
|
Digital Status
|
1
|
Integer; 0 = Off, 1 = On
|
1,5
|
|
82
|
HOP_HTR2_PWR
|
HOP heater 2 power
|
Digital Status
|
1
|
Integer; 0 = Off, 1 = On
|
1,5
|
|
83
|
COVER_TELLTALE_PWR
|
Imager cover telltale
power
|
Digital Status
|
1
|
Integer; 0 = Off, 1 = On
|
1,5
|
|
84
|
COVER_TELLTALE
|
Cover Telltale
|
Digital Status
|
1
|
Integer; 0 = Not closed,
1 = Closed
|
1,5
|
|
85
|
IR_COOL1_LEVEL
|
IR Cooler 1 level
|
Digital Status
|
4
|
Integer; 0 - 4095
|
1,5
|
|
86
|
IR_COOL2_LEVEL
|
IR Cooler 2 level
|
Digital Status
|
4
|
Integer; 0 - 4095
|
1,5
|
|
87
|
IR_COOL3_LEVEL
|
IR Cooler 3 level
|
Digital Status
|
4
|
Integer; 0 - 4095
|
1,5
|
|
88
|
IR_FLOOD1_LEVEL
|
IR flood lamp 1 level
|
Digital Status
|
4
|
Integer; 0 - 4095
|
1,5
|
|
89
|
IR_FLOOD2_LEVEL
|
IR flood lamp 2 level
|
Digital Status
|
4
|
Integer; 0 - 4095
|
1,5
|
|
90
|
IR_SPHERE_GOAL
|
Sphere lamp 1 closed-loop goal (IR)
|
Digital Status
|
4
|
Integer; 0 - 4095
|
1,5
|
|
91
|
IR_SPHERE_LEVEL
|
Sphere lamp 1 level (IR); relevant to open-loop operation only
|
Digital Status
|
4
|
Integer; 0 - 4095
|
1,5
|
|
92
|
IR_SOURCE
|
IR data source, either actual
detector or a test pattern
|
Digital Status
|
1
|
Integer; 0 = Detector, 1
- 7 = Test pattern
|
1,5
|
|
93
|
IR_SHUT_LED
|
Shutter fiducial light-emitting diode (LED) power (IR)
|
Digital Status
|
1
|
Integer; 0 = Off, 1 = On
|
1,5
|
|
94
|
IR_SPHERE_PWR
|
Sphere lamp 1 power (IR)
|
Digital Status
|
1
|
Integer; 0 = Off, 1 = On
|
1,5
|
|
95
|
IR_FLOOD1_PWR
|
IR flood lamp 1 power
|
Digital Status
|
1
|
Integer; 0 = Off, 1 = On
|
1,5
|
|
96
|
IR_FLOOD2_PWR
|
IR flood lamp 2 power
|
Digital Status
|
1
|
Integer; 0 = Off, 1 = On
|
1,5
|
|
97
|
IR_COOL1_PWR
|
IR cooler 1 power
|
Digital Status
|
1
|
Integer; 0 = Off, 1 = On
|
1,5
|
|
98
|
IR_COOL2_PWR
|
IR cooler 2 power
|
Digital Status
|
1
|
Integer; 0 = Off, 1 = On
|
1,5
|
|
99
|
IR_COOL3_PWR
|
IR cooler 3 power
|
Digital Status
|
1
|
Integer; 0 = Off, 1 = On
|
1,5
|
|
100
|
IR_LVDS_1
|
IR low-voltage
differential signal (LVDS) driver #1 enable
|
Digital Status
|
1
|
Integer; 0 = Disable, 1
= Enable
|
1,5
|
|
101
|
IR_LVDS_2
|
IR LVDS driver #2 enable
|
Digital Status
|
1
|
Integer; 0 = Disable, 1
= Enable
|
1,5
|
|
102
|
IR_DAC_POWER
|
IR digital-to-analog
converter (DAC) power (for coolers and lamps)
|
Digital Status
|
1
|
Integer; 0 = Off, 1 = On
|
1,5
|
|
103
|
IR_DAC_PD
|
IR DAC power down
|
Digital Status
|
1
|
Integer; 0 = Run, 1 =
Power down
|
1,5
|
|
104
|
IR_ANA_5V_PWR
|
IR analog 5V power
|
Digital Status
|
1
|
Integer; 0 = Off, 1 = On
|
1,5
|
|
105
|
IR_ADC_Q1_PWR
|
IR detector quadrant #1
analog-to-digital converter (ADC, or A/D) power
|
Digital Status
|
1
|
Integer; 0 = Off, 1 = On
|
1,5
|
|
106
|
IR_ADC_Q2_PWR
|
IR detector quadrant #2
A/D power
|
Digital Status
|
1
|
Integer; 0 = Off, 1 = On
|
1,5
|
|
107
|
IR_ADC_Q3_PWR
|
IR detector quadrant #3
A/D power
|
Digital Status
|
1
|
Integer; 0 = Off, 1 = On
|
1,5
|
|
108
|
IR_ADC_Q4_PWR
|
IR detector quadrant #4
A/D power
|
Digital Status
|
1
|
Integer; 0 = Off, 1 = On
|
1,5
|
|
109
|
IR_BIAS_PWR
|
IR detector bias power
|
Digital Status
|
1
|
Integer; 0 = Off, 1 = On
|
1,5
|
|
110
|
IR_AMP_HI_PWR
|
IR detector amp high
power
|
Digital Status
|
1
|
Integer; 0 = Off, 1 = On
|
1,5
|
|
111
|
IR_CLOCK_DRIVE
|
IR detector clock driver
|
Digital Status
|
1
|
Integer; 0 = Off, 1 = On
|
1,5
|
|
112
|
IR_COOLER_TEMP3_CONV
|
IR cooler temperature 3
conversion enable; disabling turns off power to temperature sensor in case of
introduced noise in detector
|
Digital Status
|
1
|
Integer; 0 = Disable, 1
= Enable
|
1,5
|
|
113
|
IR_COOLER_TEMP2_CONV
|
IR cooler temperature 2
conversion enable; disabling turns off power to temperature sensor in case of
introduced noise in detector
|
Digital Status
|
1
|
Integer; 0 = Disable, 1
= Enable
|
1,5
|
|
114
|
IR_COOLER_TEMP1_CONV
|
IR cooler temperature 1
conversion enable; disabling turns off power to temperature sensor in case of
introduced noise in detector
|
Digital Status
|
1
|
Integer; 0 = Disable, 1
= Enable
|
1,5
|
|
115
|
IR_TEMP2_CONV
|
IR detector temperature
2 conversion enable; disabling turns off power to temperature sensor in case
of introduced noise in detector
|
Digital Status
|
1
|
Integer; 0 = Disable, 1
= Enable
|
1,5
|
|
116
|
IR_TEMP1_CONV
|
IR detector temperature
1 conversion enable; disabling turns off power to temperature sensor in case
of introduced noise in detector
|
Digital Status
|
1
|
Integer; 0 = Disable, 1
= Enable
|
1,5
|
|
117
|
IR_SHUTTER_MOTOR_CURRENT_CONV
|
Shutter motor current conversion enable (IR); disabling turns
off power to current sensor in case of introduced noise in detector
|
Digital Status
|
1
|
Integer; 0 = Disable, 1
= Enable
|
1,5
|
|
118
|
IR_MUX_TEMP_CONV
|
IR multiplexed (MUX)
temperature conversion enable; disabling turns off power to temperature
sensor in case of introduced noise in detector
|
Digital Status
|
1
|
Integer; 0 = Disable, 1
= Enable
|
1,5
|
|
119
|
IR_SHUT_ENB
|
Shutter motor phase enabled (IR)
|
Digital Status
|
1
|
Integer; 0 - 3
|
1,5
|
|
120
|
IR_SHUT_PHASE
|
Shutter motor phase (IR)
|
Digital Status
|
1
|
Integer; 0 - 3
|
1,5
|
|
121
|
IR_DAC_STATE
|
IR DAC power state
|
Digital Status
|
1
|
Integer; 0 = Off, 1 = On
|
1,5
|
|
122
|
IR_SHUT_FID
|
Shutter fiducial LED (IR)
|
Digital Status
|
1
|
Integer; 0 = Off, 1 = On
(fiduciated)
|
1,5
|
|
123
|
IR_ADC_Q1_STATE
|
IR detector quadrant #1
A/D latch-up
|
Digital Status
|
1
|
Integer; 0 = Ok, 1 =
Latched
|
1,5
|
|
124
|
IR_ADC_Q2_STATE
|
IR detector quadrant #2
A/D latch-up
|
Digital Status
|
1
|
Integer; 0 = Ok, 1 = Latched
|
1,5
|
|
125
|
IR_ADC_Q3_STATE
|
IR detector quadrant #3
A/D latch-up
|
Digital Status
|
1
|
Integer; 0 = Ok, 1 =
Latched
|
1,5
|
|
126
|
IR_ADC_Q4_STATE
|
IR detector quadrant #4
A/D latch-up
|
Digital Status
|
1
|
Integer; 0 = Ok, 1 =
Latched
|
1,5
|
|
127
|
VNIR_FLOOD1_LEVEL
|
VNIR flood lamp 1 level
|
Digital Status
|
4
|
Integer; 0 - 4095
|
1,5
|
|
128
|
VNIR_FLOOD2_LEVEL
|
VNIR flood lamp 2 level
|
Digital Status
|
4
|
Integer; 0 - 4095
|
1,5
|
|
129
|
VNIR_SPHERE_GOAL
|
Sphere lamp 1 closed-loop goal (VNIR)
|
Digital Status
|
4
|
Integer; 0 - 4095
|
1,5
|
|
130
|
VNIR_SPHERE_LEVEL
|
Sphere lamp 1 level (VNIR); relevant to open-loop operation only
|
Digital Status
|
4
|
Integer; 0 - 4095
|
1,5
|
|
131
|
VNIR_HEATER
|
VNIR heater
|
Digital Status
|
1
|
0 = Off
1 = On
|
1,5
|
|
132
|
VNIR_SOURCE
|
VNIR data source, either
actual detector or a test pattern
|
Digital Status
|
1
|
0 = Detector
1 - 7 = Test pattern
|
1,5
|
|
133
|
VNIR_SHUT_LED
|
Shutter fiducial LED power (VNIR)
|
Digital Status
|
1
|
Integer; 0 = Off, 1 = On
|
1,5
|
|
134
|
VNIR_SPHERE_PWR
|
Sphere lamp 2 power (VNIR)
|
Digital Status
|
1
|
Integer; 0 = Off, 1 = On
|
1,5
|
|
135
|
VNIR_FLOOD1_PWR
|
VNIR flood lamp 1 power
|
Digital Status
|
1
|
Integer; 0 = Off, 1 = On
|
1,5
|
|
136
|
VNIR_FLOOD2_PWR
|
VNIR flood lamp 2 power
|
Digital Status
|
1
|
Integer; 0 = Off, 1 = On
|
1,5
|
|
137
|
VNIR_LVDS_1
|
VNIR LVDS driver #1
enable
|
Digital Status
|
1
|
Integer; 0 = Disable, 1
= Enable
|
1,5
|
|
138
|
VNIR_LVDS_2
|
VNIR LVDS driver #2
enable
|
Digital Status
|
1
|
Integer; 0 = Disable, 1
= Enable
|
1,5
|
|
139
|
VNIR_DAC_POWER
|
VNIR DAC power (for
lamps)
|
Digital Status
|
1
|
Integer; 0 = Off, 1 = On
|
1,5
|
|
140
|
VNIR_DAC_PD
|
VNIR DAC power down
|
Digital Status
|
1
|
0 = Run
1 = Power down
|
1,5
|
|
141
|
VNIR_ANA_5V_PWR
|
VNIR analog 5V power
|
Digital Status
|
1
|
Integer; 0 = Off, 1 = On
|
1,5
|
|
142
|
VNIR_ADC_Q1_PWR
|
VNIR detector quadrant
#1 A/D power
|
Digital Status
|
1
|
Integer; 0 = Off, 1 = On
|
1,5
|
|
143
|
VNIR_ADC_Q2_PWR
|
VNIR detector quadrant
#2 A/D power
|
Digital Status
|
1
|
Integer; 0 = Off, 1 = On
|
1,5
|
|
144
|
VNIR_ADC_Q3_PWR
|
VNIR detector quadrant
#3 A/D power
|
Digital Status
|
1
|
Integer; 0 = Off, 1 = On
|
1,5
|
|
145
|
VNIR_ADC_Q4_PWR
|
VNIR detector quadrant
#4 A/D power
|
Digital Status
|
1
|
Integer; 0 = Off, 1 = On
|
1,5
|
|
146
|
VNIR_CHARGE_PUMP
|
VNIR detector charge
pump power
|
Digital Status
|
1
|
Integer; 0 = off; 1 =
500 kHz; 2 = 250 kHz; 3 = 125 kHz (default)
|
1,5
|
|
147
|
VNIR_BIAS_PWR
|
VNIR detector bias power
|
Digital Status
|
1
|
Integer; 0 = Off, 1 = On
|
1,5
|
|
148
|
VNIR_AMP_HI_PWR
|
VNIR detector amp high
power
|
Digital Status
|
1
|
Integer; 0 = Off, 1 = On
|
1,5
|
|
149
|
VNIR_CLOCK_DRIVE
|
VNIR detector clock
driver
|
Digital Status
|
1
|
Integer; 0 = Off, 1 = On
|
1,5
|
|
150
|
VNIR_TEMP2_CONV
|
VNIR detector
temperature 2 conversion enable; disabling turns off power to temperature
sensor in case of introduced noise in detector
|
Digital Status
|
1
|
Integer; 0 = Disable, 1
= Enable
|
1,5
|
|
151
|
VNIR_TEMP1_CONV
|
VNIR detector
temperature 1 conversion enable; disabling turns off power to temperature
sensor in case of introduced noise in detector
|
Digital Status
|
1
|
Integer; 0 = Disable, 1
= Enable
|
1,5
|
|
152
|
VNIR_SHUTTER_MOTOR_
CURRENT_CONV
|
Shutter motor current conversion enable (VNIR); disabling
turns off power to current sensor in case of introduced noise in detector
|
Digital Status
|
1
|
Integer; 0 = Disable, 1
= Enable
|
1,5
|
|
153
|
VNIR_MUX_TEMP_CONV
|
VNIR multiplexed
temperature conversion enable; disabling turns off power to temperature
sensor in case of introduced noise in detector
|
Digital Status
|
1
|
Integer; 0 = Disable, 1
= Enable
|
1,5
|
|
154
|
VNIR_SHUT_ENB
|
Shutter motor phase enabled (VNIR)
|
Digital Status
|
1
|
Integer; 0 - 3
|
1,5
|
|
155
|
VNIR_SHUT_PHASE
|
Shutter motor phase (VNIR)
|
Digital Status
|
1
|
Integer; 0 - 3
|
1,5
|
|
156
|
VNIR_DAC_STATE
|
VNIR DAC power state
|
Digital Status
|
1
|
Integer; 0 = Off, 1 = On
|
1,5
|
|
157
|
VNIR_SHUTTER_FID
|
Shutter fiducial LED (VNIR)
|
Digital Status
|
1
|
Integer; 0 = Off, 1 = On
(fiduciated)
|
1,5
|
|
158
|
VNIR_ADC_Q1_STATE
|
VNIR detector quadrant
#1 A/D latch-up
|
Digital Status
|
1
|
Integer; 0 = Ok, 1 =
Latched
|
1,5
|
|
159
|
VNIR_ADC_Q2_STATE
|
VNIR detector quadrant
#2 A/D latch-up
|
Digital Status
|
1
|
Integer; 0 = Ok, 1 =
Latched
|
1,5
|
|
160
|
VNIR_ADC_Q3_STATE
|
VNIR detector quadrant
#3 A/D latch-up
|
Digital Status
|
1
|
Integer; 0 = Ok, 1 =
Latched
|
1,5
|
|
161
|
VNIR_ADC_Q4_STATE
|
VNIR detector quadrant
#4 A/D latch-up
|
Digital Status
|
1
|
Integer; 0 = Ok, 1 =
Latched
|
1,5
|
|
162
|
STATUS_INT
|
Status interval
(seconds); interval at which analog digital and software status are reported
in status packets to low-speed telemetry
|
Software Status
|
5
|
Integer; 1 – 65535 (0 =
Off)
|
1,6
|
|
163
|
MACRO_BLOCKS
|
Number of macro blocks
free
|
Software Status
|
5
|
Integer
|
1,6
|
|
164
|
TLM_VOLUME
|
Telemetry volume
produced (KB) on the low speed engineering channel since the last
CRM_STAT_CLR command
|
Software Status
|
5
|
Integer
|
1,6
|
|
165
|
WATCH_ADDR
|
Memory watch address
|
Software Status
|
5
|
Integer
|
1,6
|
|
166
|
WATCH_MEM_ID
|
Memory watch id (page
no.)
|
Software Status
|
3
|
Integer
|
1,6
|
|
167
|
WATCH_DATA
|
Watched memory
|
Software Status
|
5
|
Integer
|
1,6
|
|
168
|
SW_VERSION
|
Software version number
|
Software Status
|
3
|
Integer
|
1,6
|
|
169
|
ALARM_ID
|
Latest alarm Id
|
Software Status
|
3
|
Integer; see Table 3-5
|
1,6
|
|
170
|
ALARM_TYPE
|
Latest alarm type
|
Software Status
|
1
|
Integer; 0 = Persistent,
1 = Transient
|
1,6
|
|
171
|
ALARM_COUNT
|
Count of alarms since
the last CRM_STAT_CLR command
|
Software Status
|
3
|
Integer
|
1,6
|
|
172
|
CMD_EXEC
|
Commands executed since
the last CRM_STAT_CLR command
|
Software Status
|
3
|
Integer
|
1,6
|
|
173
|
CMD_REJECT
|
Commands rejected since
the last CRM_STAT_CLR command
|
Software Status
|
3
|
Integer
|
1,6
|
|
174
|
MAC_CMD_EXEC
|
Macro commands executed since the last CRM_STAT_CLR command
|
Software Status
|
3
|
Integer
|
1,6
|
|
175
|
MAC_CMD_REJECT
|
Macro commands rejected since the last CRM_STAT_CLR command
|
Software Status
|
3
|
Integer
|
1,6
|
|
176
|
MAC_ID
|
ID of most recent macro executed
|
Software Status
|
3
|
Integer
|
1,6
|
|
177
|
MACRO_LEARN
|
Macro learn mode; in learn mode commands are appended to a macro being
loaded to memory; when not in learn mode commands are executed
|
Software Status
|
1
|
Integer; 0 = Not learning,
1 = Learning
|
1,6
|
|
178
|
MONITOR_RESPONSE
|
Monitor response
enabling; if enabled a persistent out-of-limits condition will cause an
onboard safing macro to be executed; 0 = disabled; 1 = enabled
|
Software Status
|
1
|
Integer; 0 = Disable, 1
= Enable
|
1,6
|
|
179
|
MEM_WRITE
|
Memory write enable;
required to upload data structures with commandable monitor limits or pixel
procesing value
|
Software Status
|
1
|
Integer; 0 = Disable, 1
= Enable
|
1,6
|
|
180
|
IR_SPECTRA
|
Last value for number of
IR spectra to collect
|
Software Status
|
5
|
Integer; 0 – 65534
Remaining; 65535: Forever
|
1,6
|
|
181
|
VNIR_SPECTRA
|
Last value for number of
VNIR spectra to collect
|
Software Status
|
5
|
Integer; 0 – 65534
Remaining; 65535: Forever
|
1,6
|
|
182
|
COOL_1_SETPOINT
|
Cooler 1 temperature goal; value corresponds to temperature goal for
COOLER_TEMP1
|
Software Status
|
5
|
Integer
|
1,6
|
|
183
|
COOL_2_SETPOINT
|
Cooler 2 temperature goal; value corresponds to temperature goal for
COOLER_TEMP2
|
Software Status
|
5
|
Integer
|
1,6
|
|
184
|
COOL_3_SETPOINT
|
Cooler 3 temperature goal; value corresponds to temperature goal for
COOLER_TEMP3
|
Software Status
|
5
|
Integer
|
1,6
|
|
185
|
VNIR_HEATER_GOAL
|
VNIR heater temperature
goal; value corresponds to temperature goal for VNIR_DETECTOR_
TEMP1
|
Software Status
|
5
|
Integer
|
1,6
|
|
186
|
HEATER_1_GOAL
|
Heater 1 (on gimbal
electronics housing) goal; value corresponds to temperature goal for
OSU_CAVITY_ TEMP_VNIR
|
Software Status
|
5
|
Integer
|
1,6
|
|
187
|
HEATER_2_GOAL
|
Heater 2 (on gimbal
electronics housing) goal; value corresponds to temperature goal for
OSU_CAVITY_ TEMP_VNIR
|
Software Status
|
5
|
Integer
|
1,6
|
|
188
|
HEATER_3_GOAL
|
Heater 3 (on cooler radiator)
goal; value corresponds to temperature goal for OSU_CAVITY_ TEMP_IR
|
Software Status
|
5
|
Integer
|
1,6
|
|
189
|
HEATER_4_GOAL
|
Heater 4 (on
spectrometer housing) goal; value corresponds to temperature goal for
SPECT_CAVITY_
TEMP_IR
|
Software Status
|
5
|
Integer
|
1,6
|
|
190
|
HEATER_1_HYSTERESIS
|
Heater 1 (on gimbal
electronics housing) hysteresis
|
Software Status
|
3
|
Integer
|
1,6
|
|
191
|
HEATER_2_HYSTERESIS
|
Heater 2 (on gimbal
electronics housing) hysteresis
|
Software Status
|
3
|
Integer
|
1,6
|
|
192
|
HEATER_3_HYSTERESIS
|
Heater 3 (on cooler
radiator) hysteresis
|
Software Status
|
3
|
Integer
|
1,6
|
|
193
|
HEATER_4_HYSTERESIS
|
Heater 4 (on
spectrometer housing) hysteresi
|
Software Status
|
3
|
Integer
|
1,6
|
|
194
|
VNIR_HEATER_HYSTERESIS
|
VNIR heater hysteresis
|
Software Status
|
3
|
Integer
|
1,6
|
|
195
|
TARGET_ID
|
Target Id
|
Software Status
|
10
|
Integer
|
1,6
|
|
196
|
TARGET_TIME
|
Time of target closest
approach (whole second component); same scale as EXPOSURE_MET
|
Software Status
|
10
|
Integer
|
1,6
|
|
197
|
TARGET_SUBSECONDS
|
Time of target
fractional second (1/216 seconds)
|
Software Status
|
5
|
Integer
|
1,6
|
|
198
|
PROFILE_ID
|
Profile Id
|
Software Status
|
5
|
Integer; 0 - 1819
|
1,6
|
|
199
|
SCAN_STATUS_WORD
|
Scan motor status word
|
Software Status
|
16
|
Character; see Table 3-3
|
1,6
|
|
200
|
SCAN_CONTROL_WORD
|
Scan motor control word
|
Software Status
|
16
|
Character; see Table 3-4
|
1,6
|
|
201
|
SLEW_ANGLE
|
Gimbal angle (µradians)
|
Software Status
|
11
|
Integer
|
1,6
|
|
202
|
OFFSET_ANGLE
|
Target for offset angle
from gimbal profile defined in PROFILE_ID (µradians)
|
Software Status
|
11
|
Integer
|
1,6
|
|
203
|
OFFSET_RATE
|
Target for offset rate
from gimbal profile defined in PROFILE_ID (µradians/s)
|
Software Status
|
11
|
Integer
|
1,6
|
|
204
|
GOAL_ANGLE
|
Gimbal goal angle from
gimbal profile defined in PROFILE_ID (µradians)
|
Software Status
|
11
|
Integer
|
1,6
|
|
205
|
VNIR_HTR_MODE
|
VNIR heater control mode
|
Software Status
|
1
|
Integer; 0 = Off, 1 =
On, 2 = Software control
|
1,6
|
|
206
|
OBSERVE
|
Observation state
|
Software Status
|
1
|
Integer; 0 = Idle, 1 =
Observing
|
1,6
|
|
207
|
OFFSET_ADJUST
|
Scan offset adjustment
|
Software Status
|
1
|
Integer; 0 = Disable, 1
= Enable
|
1,6
|
|
208
|
HTR_1_MODE
|
Heater 1 (on gimbal
electronics housing) control mode
|
Software Status
|
1
|
Integer; 0 = Off; 1 =
On; 2 = Software control
|
1,6
|
|
209
|
HTR_2_MODE
|
Heater 2 (on gimbal
electronics housing) control mode
|
Software Status
|
1
|
Integer; 0 = Off; 1 =
On; 2 = Software control
|
1,6
|
|
210
|
HTR_3_MODE
|
Heater 3 (on cooler
radiator) control mode
|
Software Status
|
1
|
Integer; 0 = Off; 1 =
On; 2 = Software control
|
1,6
|
|
211
|
HTR_4_MODE
|
Heater 4 (on
spectrometer housing) control mode
|
Software Status
|
1
|
Integer; 0 = Off; 1 =
On; 2 = Software control
|
1,6
|
|
212
|
COVER_MODE
|
Cover deployment mode
|
Software Status
|
1
|
Integer; 0 = Disable
deployment; 1 = Enable deployment
|
1,6
|
|
213
|
SCAN_MODE
|
Scan platform control
mode
|
Software Status
|
1
|
Integer; 0 = off; 1 =
holding; the gimbal is held at the current position; 2 = slewing; the gimbal
is moved to a commanded angle; 3 = following a profile; the gimbal follows a
computed and uploaded profile; 4 = home; the gimbal searches for its index
fiducial
|
1,6
|
|
214
|
OBS_MAC_ID
|
Id of most recent
observation macro executed
|
Software Status
|
3
|
Integer
|
1,6
|
|
215
|
SHUTTER_POS
|
Shutter position from 0 to 32
|
Software Status
|
2
|
Integer; 0 - 32; nominal
open is 3; viewing sphere is 17; closed is 32
|
1,6
|
|
216
|
SHUTTER_DRIVE
|
Shutter drive selection; VNIR channel for nominal use; IR is
backup; both together is contingency for stuck shutter;
|
Software Status
|
1
|
Integer; 0 = IR side; 1
= VNIR side; 2 = both sides
|
1,6
|
|
217
|
SCAN_LOG_ENB
|
Scan platform logging
enabling; with this enabled requests for spectra return high-rate scan
diagnostic data
|
Software Status
|
1
|
Integer; 0 = Disable, 1
= Enable
|
1,6
|
|
218
|
IR_TEMP_MONITOR
|
IR temperature monitor
enable/disable
|
Software Status
|
1
|
Integer; 0 = Off, 1 = On
|
1,6
|
|
219
|
IR_EXPOSE
|
IR exposure time
parameter; number of 1/480ths of inverse frame rate
|
Software Status
|
3
|
Integer; 0 - 480
|
1,6
|
|
220
|
IR_RATE
|
IR frame acquisition
rate
|
Software Status
|
1
|
Integer; 0 = 1 Hz; 1 =
3.75 Hz; 2 = 5 Hz; 3 = 15 Hz; 4 = 30 Hz
|
1,6
|
|
221
|
VNIR_TEMP_MONITOR
|
VNIR temperature monitor
enable/disable
|
Software Status
|
1
|
Integer; 0 = Off, 1 = On
|
1,6
|
|
222
|
VNIR_EXPOSE
|
VNIR exposure time
parameter; number of 1/480ths of inverse frame rate
|
Software Status
|
3
|
Integer; 0 - 480
|
1,6
|
|
223
|
VNIR_RATE
|
VNIR frame acquisition
rate
|
Software Status
|
1
|
Integer; 0 = 1 Hz; 1 =
3.75 Hz; 2 = 5 Hz; 3 = 15 Hz; 4 = 30 Hz
|
1,6
|
|
224
|
IR_FILTER
|
IR wavelength filter table; which onboard table is used to define which
detector rows are recorded
|
Software Status
|
1
|
Integer; 0 - 3
|
1,6
|
|
225
|
IR_BINNING
|
IR pixel binning mode
|
Software Status
|
1
|
Integer; 0 = 1:1, 1 =
2:1, 2 = 5:1, 3 = 10:1
|
1,6
|
|
226
|
IR_LOSSY
|
IR lossy compression enabled or disabled; 12 to 8 bit look-up table
commanded line by line in uploaded data structure
|
Software Status
|
1
|
Integer; 0 = Disable, 1
= Enable
|
1,6
|
|
227
|
IR_FAST
|
Enable/disable IR Fast compression
|
Software Status
|
1
|
Integer; 0 = Disable, 1
= Enable
|
1,6
|
|
228
|
VNIR_FILTER
|
VNIR wavelength filter table; which onboard table is used to define which
detector rows are recorded
|
Software Status
|
1
|
Integer; 0 - 3
|
1,6
|
|
229
|
VNIR_BINNING
|
VNIR pixel binning mode
|
Software Status
|
1
|
Integer; 0 = 1:1, 1 =
2:1, 2 = 5:1, 3 = 10:1
|
1,6
|
|
230
|
VNIR_LOSSY
|
VNIR lossy compression enabled or disabled; 12 to 8 bit look-up table
commanded line by line in uploaded data structure
|
Software Status
|
1
|
Integer; 0 = Disable, 1
= Enable
|
1,6
|
|
231
|
VNIR_FAST
|
Enable/disable Fast compression
|
Software Status
|
1
|
Integer; 0 = Disable, 1
= Enable
|
1,6
|
|
232
|
IR_PIXEL_PROC_CHECKSUM
|
IR pixel processing
table CRC-CCITT checksum; the data structure containing gains offsets and
which LUT to use is 480 rows and 3
columns; this is the least significant end of the sum and serves as a
fingerprint
|
Software Status
|
5
|
Integer
|
1,6
|
|
233
|
VNIR_PIXEL_PROC_
CHECKSUM
|
VNIR pixel processing
table CRC-CCITT checksum; the data structure containing gains offsets and
which LUT to use is 480 rows and 3
columns; this is the least significant end of the sum and serves as a
fingerprint
|
Software Status
|
5
|
Integer
|
1,6
|
Notes:
(1)
Source of information describes whether information is a value-added field or
part of original instrument housekeeping, and if so, the type of housekeeping represented.
(2)
The added parameters represent values calculated in post-processing that are
useful to describe frame-dependent data quality, or approximate geometric,
lighting, and atmospheric conditions at the time of the observation that are
relevant to post-processing corrections.
(3)
The spectrometer image header describes the instrument configuration relevant
to an individual frame of data such as exposure time, frame rate, data editing
and compression, etc.
(4)
Analog status represents reading of voltage, current and temperature of
different components of the CRISM instrument. Monitors are run by different
electronics boards in the instrument. The nomenclature is as follows. DPU_PWR_0
represents the 0th status item monitored by the DPU power board, DPU_PWR_1 the
1st, etc. IR_PWR is the IR power board in the DPU. VNIR_PWR
is the VNIR power board in the DPU. COOL_PWR is the cooler power board in the
DPU. IR_FP is the IR focal plane electronics board in the base of the OSU.
VNIR_FP is the VNIR focal plane electronics board in the base of the OSU.
(5) Digital status represents on/off settings of the instrument,
levels of coolers or calibration lamps, or the source of data reported from
each focal plane. The source may be measured data from the detector, or one of
several test patterns stored in the focal plane electronics (for diagnostic
purposes).
(6) Software status represents the status of RAM memory, the
frequency of housekeeping reporting, the history of commanding, the
history of reporting of alarms, commanded setting of coolers and heaters, and
the commanded configuration of the instrument (as opposed to the actual
configuration reported in the spectrometer image header).
Table 3-3. Bit mapping of scan
motor status word
|
Name
|
Length
(bits)
|
Value
|
Description
|
|
Direction
|
1
|
0 = Down
1 = Up
|
Platform direction
|
|
Index Latch
|
1
|
0 = No index
1 = Index seen
|
Latched (i.e. sticky) index
pulse
|
|
Limit 2
|
1
|
0 = No limit
1 = Limit seen
|
Latched (i.e. sticky) limit
switch #2
|
|
Limit 1
|
1
|
0 = No limit
1 = Limit seen
|
Latched (i.e. sticky) limit
switch #1
|
|
Inphase
|
1
|
0 – 1
|
Raw inphase signal
|
|
Quadrature
|
1
|
0 – 1
|
Raw quadrature signal
|
|
Index
|
1
|
0 = No index
1 = Index
|
Raw index signal
|
|
Hall Sensor
|
3
|
0 – 7
|
Hall sensors
|
|
Encoder
|
22
|
Signed integer
|
Encoded scan platform
position
|
Table 3-4. Bit mapping of scan motor control word
|
Name
|
Length
(bits)
|
Value
|
Description
|
|
Enable Counter
|
1
|
0 = Disable
1 = Enable
|
Enable/disable encoder
position counter
|
|
Reset Counter
|
1
|
0 = No operation
1 = Reset
|
Reset (i.e. zero) encoder
position counter
|
|
Reset Index
|
1
|
0 = No operation
1 = Reset
|
Reset index latch
|
|
Motor Drive
|
1
|
0 = Disable
1 = Enable
|
Enable/disable motor drive
|
|
Test Clock
|
1
|
0 = Disable
1 = Enable
|
Enable/disable sending
external clock (for ground testing)
|
|
Index Arm
|
1
|
0 = No operation
1 = Index
|
Arm index latch
|
|
Hall Latch
|
1
|
0 = No operation
1 = Latch
|
Latch Hall inputs
|
|
Hall Control
|
1
|
0 = Automatic
1 = Computer
|
Enable/disable computer control
of Hall outputs
|
|
Fine Mode
|
1
|
0 = Coarse
1 = Fine
|
Coarse or fine control of
motor drive DAC
|
|
Reset Limits
|
1
|
0 = No operation
1 = Reset
|
Reset limit latches
|
|
Hall Outputs
|
3
|
0 – 7
|
Hall outputs
|
|
Drive
|
12
|
Signed integer
|
Motor drive DAC
|
Table 3-5. Alarms coded in housekeeping
|
ID
|
Description
|
Information
|
|
0
|
Unused
|
|
|
1
|
Bad packet
|
0
|
|
2
|
Out of macro contexts
|
Macro Id
|
|
3 … 15
|
Reserved
|
|
|
16
|
Invalid target id
|
|
|
17
|
Scan platform loss of
control
|
|
|
18 … 127
|
Reserved
|
|
|
128 … 169
|
Monitored value is too low;
see Table 3-6
|
Value and limit
|
|
170 … 191
|
Reserved
|
|
|
192 … 233
|
Monitored value is too
high; see Table 3-6
|
Value and limit
|
|
234 … 255
|
Reserved
|
|
Table 3-6. Alarms for monitored housekeeping and responses to out-of-limits conditions
|
Source
|
Alarm Ids
Low / High
|
Autonomy Macro Executed
|
|
Value too Low
|
Value too High
|
|
DPU power board temperature
|
128
|
192
|
|
|
|
DPU +5 voltage
|
129
|
193
|
|
|
|
DPU +5 current
|
130
|
194
|
|
|
|
Scan motor current 1 &
2
|
131
|
195
|
|
10
|
|
IR power board temperature
|
132
|
196
|
|
5
|
|
IR FPU +12 voltage
|
133
|
197
|
|
|
|
IR FPU +7 voltage
|
134
|
198
|
|
|
|
IR FPU current
|
135
|
199
|
|
5
|
|
Heater 3 & 4 current
|
136
|
200
|
|
12
|
|
VNIR power board
temperature
|
137
|
201
|
|
4
|
|
VNIR FPU +12 voltage
|
138
|
202
|
|
|
|
VNIR FPU +7 voltage
|
139
|
203
|
|
|
|
VNIR FPU current
|
140
|
204
|
|
4
|
|
Heater 1 & 2 current
|
141
|
205
|
|
11
|
|
|
142
|
206
|
|
8
|
|
Cooler +15 voltage
|
143
|
207
|
|
|
|
Cooler current
|
144
|
208
|
|
8
|
|
HOP heater 1 & 2
current
|
145
|
209
|
|
13
|
|
Shutter motor current (IR)
|
146
|
210
|
|
7
|
|
IR detector temperature 1
|
147
|
211
|
8
|
|
|
IR detector temperature 2
|
148
|
212
|
8
|
|
|
Cooler temperature 1
|
149
|
213
|
|
8
|
|
Cooler temperature 2
|
150
|
214
|
|
8
|
|
Cooler temperature 3
|
151
|
215
|
|
8
|
|
Shutter motor temperature (IR)
|
152
|
216
|
|
|
|
Integrating sphere temperature (IR)
|
153
|
217
|
|
|
|
Telescope spider
temperature (IR)
|
154
|
218
|
|
|
|
Spectral cavity temperature
(IR)
|
155
|
219
|
|
|
|
OSU cavity temperature (IR)
|
156
|
220
|
|
|
|
Sphere lamp current (IR)
|
157
|
221
|
|
14
|
|
IR FPU board temperature
|
158
|
222
|
|
5
|
|
HOP temperature (IR)
|
159
|
223
|
|
13
|
|
Shutter motor current (VNIR)
|
160
|
224
|
|
6
|
|
VNIR detector temperature 1
|
161
|
225
|
|
15
|
|
VNIR detector temperature 2
|
162
|
226
|
|
15
|
|
Telescope temperature
|
163
|
227
|
|
|
|
Optical bench temperature
|
164
|
228
|
|
|
|
Telescope spider temp.
(VNIR)
|
165
|
229
|
|
|
|
Spectral cavity temperature
(VNIR)
|
166
|
230
|
|
|
|
OSU cavity temperature
(VNIR)
|
167
|
231
|
|
|
|
VNIR FPU board temperature
|
168
|
232
|
|
4
|
|
Baffle temperature
|
169
|
233
|
|
|
Each CRISM EDR is
described by a PDS label stored in a separate text file with an extension
".LBL". A PDS label is object-oriented and describes objects in the
data file. The PDS label contains keywords for product identification, along
with descriptive information needed to interpret or process the data objects in
the file.
PDS labels are written in Object Description Language
(ODL) [5]. PDS label statements have the form of "keyword = value".
Each label statement is terminated with a carriage return character (ASCII 13)
and a line feed character (ASCII 10) sequence to allow the label to be read by
many operating systems. Pointer statements with the following format are used
to indicate the location of data objects:
^object = location
where the carat character (^, also called a pointer) is
followed by the name of the specific data object. The location is the name of
the file that contains the data object.
The CRISM EDR label
is a combined-detached label (see reference 5) that describes both the image
and table files that make up a CRISM EDR. An example EDR label is in Appendix
A.
EDR label
keywords with CRISM-specific values are listed in Table 3-7.
Table
3-7. CRISM-specific values for EDR label
keywords
|
Keyword
|
Valid Values
|
|
PRODUCT_TYPE
|
EDR
|
|
OBSERVATION_TYPE
|
FRT (Full
Resolution Targeted Observation)
HRL (Half
Resolution Long Targeted Observation)
HRS (Half
Resolution Short Targeted Observation)
FRS (Full Resolution Short
Targeted Observation)
ATO (Along-Track Oversampled
Targeted Observation)
ATU
(Along-Track Undersampled Targeted Observation)
EPF
(Atmospheric Survey EPF)
TOD
(Tracking Optical Depth Observation)
LMB (Limb
Scan Observation)
MSP
(Multispectral Survey)
HSP
(Hyperspectral Survey)
HSV
(Hyperspectral Survey, VNIR only, 10x binned)
MSV
(Hyperspectral Survey, VNIR only, 5x binned)
MSW
(Multispectral Window)
FFC
(Flat-field calibration)
CAL
(Radiometric Calibration)
ICL
(Calibration source intercalibration)
FUN (Functional
test)
UNK (no
valid EDRs within observation that indicate class type)
|
|
OBSERVATION_ID
|
8-byte hexadecimal
integer
|
|
MRO:OBSERVATION_NUMBER
|
Counter from product
ID, hexadecimal
|
|
MRO:ACTIVITY_ID
|
Type of
measurement and macro ID ###used to execute it, i.e.:
BI### –
Bias measurement
DF### –
Dark field measurement
LP### –
Lamp measurement
SP### –
Sphere measurement
SC### –
Scene measurement
T1### –
Focal plane electronics test pattern 1
T2### –
Focal plane electronics test pattern 1
T3### –
Focal plane electronics test pattern 1
T4### –
Focal plane electronics test pattern 1
T5### –
Focal plane electronics test pattern 1
T6### –
Focal plane electronics test pattern 1
T7### –
Focal plane electronics test pattern 1
UN### –
Instrument configuration does not match macro library
|
|
MRO:FRAME_RATE
|
""1",
"3.75", "5", "15", or "30"
|
|
MRO:SENSOR_ID
|
"S" for
VNIR, "L" for IR, or "J" for joint
|
|
SHUTTER_MODE_ID
|
"OPEN",
"SPHERE", OR "CLOSED"
|
|
LIGHT_SOURCE_NAME
|
"NONE",
"VNIR LAMP 1", "VNIR LAMP 2", "IR LAMP 1",
"IR LAMP 1", "SPHERE LAMP 1", "SPHERE LAMP 2"
|
|
MRO:CALIBRATION_LAMP_STATUS
|
"OFF",
"OPEN LOOP" or "CLOSED LOOP" (for integrating sphere only)
|
|
MRO:CALIBRATION_LAMP_LEVEL
|
Value between 0 and
4095
|
|
PIXEL_AVERAGING_WIDTH
|
1, 2, 5, or 10
|
|
COMPRESSION_TYPE
|
NONE, or 8_BIT
|
|
MRO:INSTRUMENT_POINTING_MODE
|
"DYNAMIC
POINTING" if SCAN_MODE (housekeeping file column 213)
equals 3; else "FIXED POINTING"
|
|
SCAN_MODE_ID
|
(If DYNAMIC
POINTING): "SHORT" (for full-resolution or half-resolution short
central swath or limb scan), "LONG" (for half-resolution long
central swath), or "EPF" (for EPF even if part of a different class of
observation), through 2012. The value has been designated “N/A” since
truncated central scans without EPF images were adopted for targeted
observations at that time.
|
|
SAMPLING_MODE_ID
|
"HYPERSPECTRAL"
if wavelength filter used
returns contiguous rows or "MULTISPECTRAL" if not
|
|
MRO:EXPOSURE_PARAMETER
|
The value supplied to
the CRISM instrument to command the exposure time. At a given frame rate
identified in MRO:FRAME_RATE, there are 480 possible exposure times ranging from
1 to 480.
|
|
MRO:WAVELENGTH_FILTER
|
Which of four onboard
menus of rows was selected for downlink. The four choices are 0, 1, 2, or 3.
|
|
MRO:WAVELENGTH_FILE_NAME
|
For an EDR, the wavelength file
is a 5-column, 480-row text file. The five elements in each row are the row
number and a 0 or 1 for each of MRO:WAVELENGTH_FILTER 0, 1, 2 and 3,
indicating whether data from that row of the detector is included in the EDR
when that option is selected in MRO:WAVELENGTH_FILTER.
For a TRDR, the wavelength file
is an image whose value at the location of a detector element is the center
wavelength of that element, in nanometers.
|
|
MRO:PIXEL_PROC_FILE_NAME
|
For an EDR, the name of the
ASCII file giving gain and offset to convert from 14 to 12 bits, and LUT used if lossy 12
to 8 bit compression is enabled (3
columns specified on a line-by-line basis)
|
|
MRO:LOOKUP_TABLE_FILE_NAME
|
(Not used in
processing) For an EDR, the name of the
ASCII file giving the 8-bit outputs from 12-bit inputs for each of the 8
onboard LUTs (8 columns specified for each 12-bit value 0-4095)
|
The DDR (Figure
3-8) consists of supporting data needed for the post-processing of a TRDR
pointed at Mars' surface. There is a one-for-one spatial correspondence of each
spatial pixel in a TRDR to each pixel in the DDR. The DDR for an observation is
stored separately from the EDR and
TRDR to minimize and streamline data product processing and updating. The EDR
does not require highly accurate pointing information to construct, which the
DDR does. Thus the EDR can be assembled promptly by having it decoupled from
the DDR. A change in instrument calibration - not knowledge of its pointing -
would require an update of the contents of the radiance portion of a TRDR but
not the contents of the DDR. Thus having the DDR decoupled from the TRDR
minimizes the amount of reprocessing necessary when knowledge of instrument
radiometric characteristics changes.
The DDR contains
one multiple-band image. The size of the multiple-band image varies according
to the observation mode but is deterministic given the macro ID. A typical
multiple-band image might have XX pixels in the sample (cross-track) dimension,
YY pixels in the line (along-track) dimension, and ZZ pixels in the wavelength
dimension, where:
§
XX=640/binning, where 640 is the number of columns read off the
detector, and binning is 1, 2, 5, or 10
§
YY=the number of frames of data taken by the macro, and
§
ZZ=the number layers in the DDR.
Due to optical distortions present in the EDRs and
non-resampled TRDRs, not all wavelengths represent exactly the same spatial
location. Therefore the spatial location for a DDR represent
those of the VNIR band closest to 610 nm and the IR band closest to 2300 nm.
There are separate DDRs for VNIR and IR data.
There are 14 layers in the DDR,
all represented as 32-bit real numbers. The files are created at approximately
14 days after transfer of target ID files, when sufficiently accurate pointing
information is available.
§
Solar incidence angle relative to
areoid, at same planetary radius as surface projection of pixel, units degrees
§
Emission angle relative to areoid, at
same planetary radius as surface projection of pixel, units degrees
§
Solar phase angle, units degrees
§
Areocentric latitude, units degrees N
§
Areocentric longitude, units degrees E
§
Solar incidence angle relative to
planetary surface as estimated using MOLA shape model, units degrees
§
Emission angle relative to planetary
surface as estimated using MOLA shape model, units degrees
§
Slope magnitude, using MOLA shape model
and reference ellipsoid, units degrees
§
Slope azimuth, using MOLA shape model
and reference ellipsoid, units degrees clockwise from N
§ Elevation relative to MOLA datum, units meters
§
TES thermal inertia, units J m^-2 K^-1
s^-0.5
§
TES bolometric albedo
§
Local solar time, hours
§
Spare
Once image data are assembled
into EDRs and calibrated into TRDRs, DDRs are created for the data. A version 0
DDR represents values based on predicted
pointing, and is generated to provide quick-look information. Version 1 (and any)
subsequent versions of a DDR are based on actual, reconstructed pointing.
See section 2.3.4 for general
information on CRISM product labels. A DDR label
is detached and points to the single multiband image in the DDR. An example DDR
label is in Appendix B.
DDR label
keywords with CRISM-specific values are listed in Table 3-9.
Table
3-9. CRISM-specific values for DDR label
keywords
|
Keyword
|
Valid Values
|
|
PRODUCT_TYPE
|
DDR
|
|
OBSERVATION_TYPE
|
FRT (Full
Resolution Targeted Observation)
HRL (Half
Resolution Long Targeted Observation)
HRS (Half
Resolution Short Targeted Observation)
FRS (Full Resolution Short
Targeted Observation
ATO (Along-Track Oversampled
Targeted Observation)
ATU
(Along-Track Undersampled Targeted Observation)
EPF
(Atmospheric Survey EPF)
TOD
(Tracking Optical Depth Observation)
MSP
(Multispectral Survey)
HSP
(Hyperspectral Survey)
HSV
(Hyperspectral Survey, VNIR only, 10x binned)
MSV
(Hyperspectral Survey, VNIR only, 5x binned)
MSW
(Multispectral Window)
FFC
(Flat-field calibration)
|
|
OBSERVATION_ID
|
8-byte hexadecimal
integer
|
|
MRO:OBSERVATION_NUMBER
|
Counter from product
ID, hexadecimal
|
|
MRO:ACTIVITY_ID
|
Only valid value is:
DE### – Derived Data
|
|
MRO:FRAME_RATE
|
""1",
"3.75", "5", "15", or "30"
|
|
MRO:SENSOR_ID
|
"S" for VNIR, "L" for IR
|
|
SHUTTER_MODE_ID
|
"OPEN"
|
|
PIXEL_AVERAGING_WIDTH
|
1, 2, 5, or 10
|
|
MRO:INSTRUMENT_POINTING_MODE
|
"DYNAMIC POINTING" if
SCAN_MODE (housekeeping file
column 213) equals 3 ; else "FIXED POINTING"
|
|
SCAN_MODE_ID
|
(If DYNAMIC POINTING): "SHORT" (for
full-resolution or half-resolution short central swath), "LONG"
(for half-resolution long central swath), or "EPF" (for EPF even
if part of a different class of observation), through 2012. The value has
been designated “N/A” since truncated central scans without EPF images were
adopted for targeted observations at that time.
|
|
BAND_NAME
|
Brief descriptive name of each layer of data
in DDR
|
The LDR consists
of supporting data needed for the post-processing of a TRDR pointed at Mars'
limb. The rationale for LDR structure and its geometric relation to a TRDR for
a limb scan are similar to that of the DDR. The LDR contains
one multiple-band image. The size of the multiple-band image is deterministic
given the macro ID and typically the same for all images. A typical
multiple-band image might have XX pixels in the sample (cross-track) dimension,
YY pixels in the line (along-track) dimension, and ZZ pixels in the wavelength
dimension, where:
§
XX=640/binning, where 640 is the number of columns read off the
detector, and binning is typically 10, for a dimension of 64,
§
YY=the number of frames of data taken by the macro, typically
540, and
§
ZZ=the number layers in the LDR.
Due to optical distortions present in the EDRs and
non-resampled TRDRs, not all wavelengths represent exactly the same spatial
location. The spatial location for a LDR represent those of the VNIR band
closest to 610 nm and the IR band closest to 2300 nm. There are separate LDRs
for VNIR and IR data.
There are 15 layers in the LDR,
all represented as 32-bit real numbers. The files are created at approximately
14 days after transfer of target ID files, when sufficiently accurate pointing
information is available.
§
Solar incidence angle at the areoid, units
degrees,
§
Emission angle at the areoid, units
degrees,
§
Phase angle, units degrees,
§
Planetocentric latitude at the tangent
point of the line of sight, units degrees N,
§
Longitude at the tangent point of the
line of sight, units degrees E,
§
Solar incidence angle at a surface
intercept relative to a MOLA shape model, units degrees,
§
Emission angle at a surface intercept
relative to a MOLA shape model, units degrees,
§
Elevation at the tangent point of the
line of sight, units meters relative to areoid,
§
Elevation at the tangent point of the
line of sight, units meters relative to the MOLA shape model,
§
Local Solar Time, units hours,
§
Ephemeris Time of observation, seconds
past noon January 1, 2000"
§
Sub-solar planetocentric latitude, units
degrees N,
§
Sub-solar longitude, units degrees E,
§
Sub-spacecraft planetocentric latitude,
units degrees N,
§
Sub-spacecraft longitude, units degrees
E.
Once limb image data are
assembled into EDRs, calibrated into TRDRs, and reconstructed pointing is
available, LDRs are created for the data. There is no significance to a version
0 or 1.
See section 2.3.4 for general information on CRISM product
labels. An LDR label is detached and points to the single multiband image in
the LDR. An example LDR label is in Appendix H.
DDR label
keywords with CRISM-specific values are listed in Table 3-10.
Table 3-10. CRISM-specific
values for LDR label keywords
|
Keyword
|
Valid Values
|
|
PRODUCT_TYPE
|
LDR
|
|
OBSERVATION_TYPE
|
LMB (Limb
Scan Observation)
|
|
OBSERVATION_ID
|
8-byte hexadecimal
integer
|
|
MRO:OBSERVATION_NUMBER
|
Counter from product
ID, hexadecimal
|
|
MRO:ACTIVITY_ID
|
Only valid value is:
DE### – Derived data
|
|
MRO:FRAME_RATE
|
"3.75"
|
|
MRO:SENSOR_ID
|
"S" for VNIR, "L" for IR
|
|
PIXEL_AVERAGING_WIDTH
|
10
|
|
MRO:INSTRUMENT_POINTING_MODE
|
"DYNAMIC POINTING"
|
|
BAND_NAME
|
Brief descriptive name of each layer of data
in LDR
|
The TRDR consists
of the output of one of the constituent macros associated with a target ID that
contains scene data (Mars or other), as shown in Figure 3-11. Not all EDRs are
processed to TRDR level; macros containing bias, background, sphere,
or calibration lamp data are processed instead to CDRs. Only scene EDRs are
processed to the TRDR level.
The TRDR contains
one or more multiple-band images (suffix *.IMG). One matches the dimensions of
the multiple-band image of raw DN in an EDR,
except that the data are in units of radiance. The size of the multiple-band
image varies according to the observation mode but is deterministic given the
ID of the command macro used to acquire the data. Appended to the multiple-band
image is a binary table of the detector rows that were used, as selected by the
wavelength filter. This is a one-column table, with each row containing one
detector row number expressed as a 16-bit unsigned integer values, most
significant bit first.
Other multiple-band images may contain I/F,
Lambert albedo, or derived summary products (Table 3-12). The Lambert albedo
image, if present, parallels the structure of the I/F image. The summary
product image, if present, has the same spatial dimensions, but a different
dimension in the spectral direction and it lacks the table of row numbers.
The size of the multiple-band image varies according to
the observation mode but is deterministic given the macro ID. A typical
multiple-band image might have XX pixels in the sample (cross-track) dimension,
YY pixels in the line (along-track) dimension, and ZZ pixels in the wavelength
dimension, where:
§
XX=640/binning, where binning is 1, 2, 5, or 10
§
YY=the number of frames of data taken by the macro, and
§
ZZ=the number of detector rows (wavelengths) that are retained by
the instrument.
The procedure for deriving this multiple-band image from
an EDR is discussed in detail in Appendix L.
Improvements in calibration accuracy (and noise
remediation) were added as versions of TRDRs incremented from v0 to v1 to v3
(v2 was developed but not released). Beginning with version 3 TRDRs, filtering was
applied to the I/F version of the IR multiband image (not the VNIR multiband
image) to reduce effects of propagated noise from ground or inflight
calibrations, or from noise in scene measurements (especially those taken later
in the mission at higher detector temperatures). The radiance IR multiband
image in version 3 of the TRDRs remained unfiltered for reference. An overview
of the filtering procedure is provided in Appendix N. Parameters of the
filtering procedure are encoded in labels, beginning in version 3.
The data in a TRDR do
not have optical distortions removed. In one column, the projection onto Mars’
surface may vary by as much as ±0.4 not-binned detector elements in the XX
dimension depending on position in the FOV (distortions are worst at the edges
of the VNIR and IR FOVs). For a single wavelength, its location in the ZZ
direction may vary by as much as ±1 not-binned detector elements depending on
wavelength and position in the XX direction (distortions are worst at the
short- and long-wavelength ends of the IR detector).
Components of the TRDR may
have been generated at different times. The list file can be created nearly as
soon as data are received at the SOC; once the approximate spacecraft pointing
information, gimbal position, and tables to convert telemetry from digital to
physical units are available. The radiance or I/F multiple-band image requires bracketing sphere observations
to process and so it might have been delayed one day. Construction of the
summary product or
Lambert albedo multiband images, if present, requires coregistered MOLA derived
data products and thus accurate, reconstructed spacecraft pointing for the data
sets. That information was not available for up to two weeks.

Figure 3-11. Contents of a CRISM Reduced Data Record for a
single observation (TRDR).
Summary products (or “summary parameters”) are spectral
indices that include reflectance at key wavelengths, spectral reflectance
ratios, and measures of the wavelength position or depth of various absorptions,
and that provide an overview of spectral signatures of phases on the Martian
surface or in the atmosphere. Although they do not by themselves provide
definitive detections of phases, they are useful “pointers” and indicators of
spatial variations in key spectral signatures. Forty-five summary products were
in use at the beginning of CRISM’s orbital measurements of Mars, that were
defined base on results from Mars Express OMEGA [Applicable Document 10]. Over
the early 2010’s the definitions of products evolved to reduce false positive
detections and to serve as indicators of phases previously undetected on Mars
that were discovered in early analyses of CRISM measurements [Applicable
Document 11]. Table 3-12 describes the various summary products in use during
various phases of the MRO mission, their status following the last major revision
to summary product definitions in 2014, and the rationales and caveats for the
usage of each product. Those with a defined band number of the left-most column
are parts of data deliveries after 2014.
Post-2014 (i.e., including TERs, MTRDRs, v4 MRDRs, and
VRDRs) summary product definitions are able to work either on the selected
wavelengths in multispectral mapping observations or on the continuous
wavelength sampling in hyperspectral targeted observations. If the input is hyperspectral
data (e.g., calculated from TERs, MTRDRs, or VRDRs), the summary products are
evaluated at the prescribed wavelengths, to optimize performance and to avoid
along-slit wavelength drift. This evaluation is performed using a polynomial
fit over the spectral kernel widths stated in Table 3-12. If the input is
multispectral data (MRDRs) the evaluation is at the discrete channel nearest in
wavelength. “Surface parameters” are evaluated on photometrically corrected I/F
following whatever procedure is used to normalize out atmospheric gas
absorptions; “atmospheric parameters” are evaluated on photometrically
corrected I/F retaining gas features.
The summary parameters are the
result of band math calculations – arithmetic functions of multiple spectral
bands (Table 3-12) – and are floating point data type. In the majority of
parameters (e.g. BD, INDEX type parameters) a featureless spectrum over the
applicable wavelength range will result in a parameter value of zero, and the
presence of the spectral feature being parameterized will result in a positive
parameter value. A negative parameter value indicates that the underlying
spectrum has structure that is inverted relative to what is expected for a
feature detection – for example a ‘bump’ relative to the continuum where a
detection would be a ‘dip’ (absorption feature). Due to residual noise,
background spectral variability, and the overprinting of spectral features from
differing surface and atmospheric constituents, it is common for the data
distribution for a given zero-referenced parameter to be centered at or near
zero but include both positive and negative values.
Table 3-12. Formulation of parameters for summary products
|
Summary product
unmodified over mission
|
|
Minimally revised
summary product
|
|
Fundamentally revised
summary product
|
|
New summary product
|
|
Depreciated
summary product (available in CRISM CAT)
|
|
#
|
NAME
|
STATUS
|
PARAMETER
|
FORMULATION
|
KERNEL WIDTH
|
RATIONALE
|
CAVEATS
|
|
Surface Parameters (calculated using TRDR, MRDR, TER, MTRDR Lambert albedo)
|
|
1
|
R770
|
Ö
|
0.77-µm
reflectance
|

|
R770: 5
|
Higher
value more dusty or icy
|
Sensitive
to slope effects, clouds
|
|
2
|
RBR
|
Ö
|
Red/blue
ratio
|

|
R440: 5
R770: 5
|
Higher
value has more npFeOx
|
Sensitive
to dust in atmosphere
|
|
|
BD530
|
x
|
0.53-µm
band depth
|

|
R440: 5
R530: 5
R709: 5
|
–
|
–
|
|
3
|
BD530_2
|
Ö
|
0.53-µm
band depth
|

|
R440: 5
R530: 5
R614: 5
|
Higher
value has more crystalline hematite
|
–
|
|
|
SH600
|
x
|
0.6-µm
shoulder height
|

|
–
|
–
|
–
|
|
4
|
SH600_2
|
Ö
|
0.6-µm
shoulder height
|

|
R533: 5
R600: 5
R716: 3
|
Select
ferric minerals, or compacted texture
|
Sensitive
to high opacity in atmosphere
|
|
5
|
SH770
|
Ö
|
0.77-µm
shoulder height
|

|
R716: 3
R775: 5
R860: 5
|
Select
ferric minerals, less sensitive to LCP than SH600_2
|
Sensitive
to high opacity in atmosphere
|
|
|
BD640
|
x
|
0.64-µm
band depth
|

|
R600: 5
R648: 5
R709: 5
|
Select
ferric minerals (esp. maghemite)
|
Obscured
by VNIR detector artifact
|
|
6
|
BD640_2
|
Ö
|
0.64-µm
band depth
|

|
R600: 5
R624: 3
R760: 5
|
Select
ferric minerals (esp. maghemite)
|
Obscured
by VNIR detector artifact
|
|
|
BD860
|
x
|
0.86-µm
band depth
|

|
–
|
–
|
–
|
|
7
|
BD860_2
|
Ö
|
0.86-µm
band depth
|

|
R755: 5
R860: 5
R977: 5
|
Select
ferric minerals (esp. hematite)
|
–
|
|
|
BD920
|
x
|
0.92
μm band depth
|

|
–
|
–
|
–
|
|
8
|
BD920_2
|
Ö
|
0.92
μm band depth
|

|
R807: 5
R920: 5
R984: 5
|
Low-Ca
pyroxene, crystalline ferric minerals
|
–
|
|
9
|
RPEAK1 *
|
Ö
|
Reflectance
peak 1
|
wavelength
where 1st derivative=0 of 5th order polynomial fit to R442, R533, R600, R710,
R740, R775, R800, R833, R860, R892, R925
|
|
Longer
wavelength peak in dust
|
–
|
|
10
|
BDI1000VIS
|
Ö
|
1-µm
integrated band depth; VNIR wavelengths
|
divide
R833, R860, R892, R925, R951, R984, R1023 by RPEAK1 then integrate over (1 –
normalized radiances) to get integrated band depth
|
|
Crystalline
ferrous silicates
|
–
|
|
11
|
BDI1000IR
|
Ö
|
1-µm
integrated band depth; IR wavelengths
|
divide
R1030, R1050, R1080, R1150 by linear fit from peak R (of the 15) between
1.3-1.87μm to R2530 extrapolated backwards, then integrate over (1 –
normalized radiances) to get integrated band depth
|
|
Ferrous
silicate once corrected for aerosol induced slope
|
–
|
|
12
|
IRA
|
Ö
|
IR albedo
|

|
R1330: 11
|
IR albedo
|
–
|
|
|
OLINDEX2
(beginning with TRR3)
|
x
|
Olivine
index 2
|
 ) )
Where
RB#### = (RC#### - R####)/RC####. RC#### denotes the value of a point at a wavelength
of #### nm along a modeled line that follows the average slope of the
spectrum.
Slope for
RC#### anchored at R1750 and R2400.
|
R1080: 7
R1210: 7
R1330: 7
R1470: 7
|
Olivines
strongly > 0
|
Also
sensitive to HCP, Fe-phyllosilicates
|
|
13
|
OLINDEX3
(beginning with TER, MTRDR)
|
Ö
|
Olivine
index 3
|

Slope for
RC#### anchored at R1750 and R2400.
|
R1080: 7
R1152: 7
R1210: 7
R1250: 7
R1263: 7
R1276: 7
R1330: 7
R1368: 7
R1395: 7
R1427: 7
R1470: 7
R1750: 7
R2400: 7
|
Olivines
strongly > 0
|
Also
sensitive to HCP, Fe-phyllosilicates
|
|
|
LCPINDEX
|
x
|
LCP index
|

|
–
|
Pyroxene
is strongly +; Favors LCP
|
–
|
|
14
|
LCPINDEX2
(beginning
with TER, MTRDR)
|
Ö
|
Detect
broad absorption centered at 1.81 µm (LCP index 2)
|

Slope for
RC#### anchored at R1560 and R2450.
|
R1560: 7
R1690: 7
R1750: 7
R1810: 7
R1870: 7
R2450: 7
|
Pyroxene
is strongly +; Favors LCP
|
–
|
|
|
HCPINDEX
|
x
|
HCP index
|

|
–
|
Pyroxene
is strongly +; Favors HCP
|
LCP
|
|
15
|
HCPINDEX2
(beginning
with MTRDR)
|
Ö
|
Detect
broad absorption centered at 2.12 µm (HCP index 2)
|

Slope for
RC#### anchored at R1810 and R2530.
|
R1810: 7
R2120: 5
R2140: 7
R2230: 7
R2250: 7
R2430: 7
R2460: 7
R2530: 7
|
Pyroxene
is strongly +; Favors HCP
|
–
|
|
16
|
BD1300
|
Ö
|
1.3-µm
absorption associated with Fe2+ substitution in plagioclase
|

|
R1080: 5
R1320: 15
R1750: 5
|
Plagioclase
with Fe2+ substitution
|
Fe-rich olivine
can be > 0
|
|
17
|
VAR
|
Ö
|
1.0-2.3-µm
spectral variance
|
Fit a line
from 1-2.3 microns and find variance of observed values from fit values by
summing in quadrature over the # intervening wavelengths
|
–
|
Ol &
Px will have high values; (to be used w/ OL, PX indices)
|
–
|
|
18
|
ISLOPE1
|
Ö
|
Spectral
slope 1
|

|
R1815: 5
R2530: 5
|
ferric
coating on dark rock
|
Sensitive
to atmospheric hazes
|
|
19
|
BD1400
|
Ö
|
1.4-µm H2O
& -OH band depth
|

|
R1330: 5
R1395: 3
R1467: 5
|
Hydrated &
hydroxylated minerals
|
–
|
|
20
|
BD1435
|
Ö
|
1.435-µm
CO2 ice band depth
|

|
R1370: 3
R1432: 1
R1470: 3
|
CO2 ice, some
hydrated minerals
|
–
|
|
|
BD1500
|
x
|
1.5-µm H2O
ice band depth
|

|
–
|
H2O ice
|
–
|
|
21
|
BD1500_2
|
Ö
|
1.5-µm H2O
ice band depth
|

|
R1367: 5
R1525: 11
R1808: 5
|
H2O ice
|
–
|
|
|
ICER1
|
Ö
|
CO2
and H2O ice band depth ratio
|

|
R1510: 5
R1430: 5
|
CO2-H2O
ice mixtures; > 1 for more CO2, < 1 for more water
|
–
|
|
22
|
ICER1_2
|
Ö
|
CO2
and H2O ice band depth ratio
|

Slope for
RC#### anchored at R1850 and R2060.
|
R1850: 5
R1510: 5
R1435: 5
R2060: 5
|
CO2-H2O
ice mixtures; > 1 for more CO2, < 1 for more water
|
–
|
|
|
BD1750
|
x
|
1.7-µm H2O
band depth
|

|
–
|
Gypsum
Alunite
|
–
|
|
23
|
BD1750_2
|
Ö
|
1.7-µm H2O
band depth
|

|
R1690: 5
R1750: 3
R1815: 5
|
Gypsum
Alunite
|
Don’t use
on pre-MRDR, TER, MTRDR products
|
|
|
BD1900
|
x
|
1.9-µm H2O
band depth
|

|
–
|
H2O in
minerals
|
Weakly
sensitive to lo-Ca pyroxene, glass, H2O ice
|
|
24
|
BD1900_2
|
Ö
|
1.9-µm H2O
band depth
|

|
R1850: 5
R1930: 5
R1985: 5
R2067: 5
|
H2O in
minerals
|
Weakly
sensitive to lo-Ca pyroxene, glass, H2O ice
|
|
|
BD1900r
|
Ö
|
1.95-µm H2O
band depth
|

|
R1862: 1
R1869: 1
R1875: 1
R1908: 1
R1914: 1
R1921: 1
R1928: 1
R1934: 1
R1941: 1
R2112: 1
R2120: 1
R2126: 1
|
H2O in
minerals
|
Weakly
sensitive to lo-Ca pyroxene, glass, H2O ice
|
|
25
|
BD1900r2
|
Ö
|
1.95-µm H2O
band depth
|

Slope for
RC#### anchored at R1850 and R2060.
|
R1850: 1
R1862: 1
R1869: 1
R1875: 1
R1908: 1
R1914: 1
R1921: 1
R1928: 1
R1934: 1
R1941: 1
R2112: 1
R2120: 1
R2126: 1
R2060: 1
|
H2O in
minerals
|
Weakly
sensitive to lo-Ca pyroxene, glass, H2O ice
|
|
26
|
BDI2000
|
Ö
|
2-µm
integrated band depth
|
divide
R1660, R1811, R2009, R2141, R2206, R2253, R2292, R2318, R2352, R2391, R2431,
R2457 by linear fit from peak R (of 15) between 1.3-1.87μm to R2530,
then integrate over (1 – normalized radiances) to get integrated band depth
|
–
|
Pyroxene,
glass
|
Weakly
sensitive to H2O ice
|
|
|
BD2100
|
x
|
2.1-µm
shifted H2O band depth (multispectral)
|

|
–
|
H2O in
monohydrated sulfate
|
Alunite,
Serpentine
|
|
27
|
BD2100_2
|
Ö
|
2.1-µm
shifted H2O band depth (hyperspectral)
|

|
R1930: 5
R2132: 5
R2250: 5
|
H2O in monohydrated
sulfates
|
Alunite,
Serpentine
|
|
28
|
BD2165
|
Ö
|
2.165-µm
Al-OH band depth
|

|
R2120: 5
R2165: 3
R2230: 3
|
Pyrophyllite
Kaolinite-group
|
Beidellite
Allophane
Imogolite
|
|
29
|
BD2190
|
Ö
|
2.190-µm
Al-OH band depth
|

|
R2120: 5
R2185: 3
R2250: 3
|
Beidellite
Allophane
Imogolite
|
Kaolinite-group
|
|
30
|
D2200
|
Ö
|
2.2-µm
dropoff
|

Slope for
RC#### anchored at R1815 and R2430.
|
R1815: 7
R2165: 5
R2210: 7
R2230: 7
R2430: 7
|
Al-OH
minerals
|
Chlorite,
Prehnite/Pumpellyite
|
|
|
DOUB2200H
|
x
|
2.16-µm
Si-OH band depth and 2.21-µm H-bound Si-OH band depth (doublet)
|

|
R2172: 5
R2205: 3
R2258: 3
R2311: 5
|
Opal and
other Si-OH phases
|
–
|
|
31
|
MIN2200
|
Ö
|
2.16-µm
Si-OH band depth and 2.21-µm H-bound Si-OH band depth (doublet)
|

|
R2120: 5
R2165: 3
R2120: 3
R2350: 5
|
Kaolinite
group
|
–
|
|
|
BD2210
|
x
|
2.21-µm
Al-OH band depth
|

|
R2120: 5
R2210: 3
R2250: 5
|
Al-OH
minerals
|
Gypsum,
Alunite
|
|
32
|
BD2210_2
|
Ö
|
2.21-µm
Al-OH band depth
|

|
R2165: 5
R2210: 5
R2290: 5
|
Al-OH minerals
|
Gypsum,
Alunite
|
|
33
|
BD2230
|
Ö
|
2.23-µm
band depth
|

|
R2210: 3
R2230: 3
R2252: 3
|
Hydroxylated
ferric sulfate
|
Al-OH
minerals
|
|
34
|
BD2250
|
Ö
|
2.25-µm
broad Al-OH and Si-OH band depth
|

|
R2120: 5
R2245: 7
R2340: 3
|
Opal and
other Si-OH minerals
|
–
|
|
35
|
MIN2250
(beginning
with TER, MTRDR)
|
Ö
|
2.21-µm
Si-OH band depth and 2.26-µm H-bound Si-OH band depth
|

|
R2165: 5
R2210: 3
R2265: 3
R2350: 5
|
Opal
|
–
|
|
36
|
BD2265
(beginning
with TER, MTRDR)
|
Ö
|
2.265-µm
band depth
|

|
R2210: 5
R2265: 3
R2295: 5
|
Jarosite
Gibbsite
Acid-treated
nontronite
|
–
|
|
37
|
BD2290
|
Ö
|
2.3-µm
Mg,Fe-OH band depth / 2.292-µm CO2 ice band depth
|

|
R2250: 5
R2290: 5
R2350: 5
|
Mg,Fe-OH
minerals
|
Mg-Carbonate;
Also CO2 ice
|
|
38
|
D2300
|
Ö
|
2.3-µm
dropoff
|

Slope for
RC#### anchored at R1815 and R2530.
|
R1815: 5
R2120: 5
R2170: 5
R2210: 5
R2290: 3
R2320: 3
R2330: 3
R2530: 5
|
Mg,Fe-OH
minerals
|
Mg-Carbonate;
Also CO2 ice
|
|
39
|
BD2355
|
Ö
|
2.35-µm
band depth
|

|
R2300: 5
R2355: 5
R2450: 5
|
Chlorite
Prehnite
Pumpellyite
|
Requires
normalization of atmo. CO absorption
|
|
|
SINDEX
|
x
|
Detects
convexity at 2.29 μm due to absorptions at 1.9/2.1 μm & 2.4
μm
|

|
–
|
Mono and
polyhydrated sulfates) will be > 0
|
–
|
|
40
|
SINDEX2
|
Ö
|
Inverse
lever rule to detect convexity at 2.29 μm due to absorptions at 1.9/2.1
μm & 2.4 μm
|

|
R2120: 5
R2290: 7
R2400: 3
|
Mono and
polyhydrated sulfates) will be > 0
|
–
|
|
|
ICER2
|
x
|
2.7-µm CO2
ice band
|

|
–
|
CO2 vs
water ice /soil; CO2 will be >>1, water and soil will be ~1
|
–
|
|
41
|
ICER2
|
Ö
|
2.7-µm CO2
ice band
|

Where
RB#### = (RC#### - R####)/RC####. RC#### denotes the value of a point at a
wavelength of #### nm along a modeled line that follows the average slope of
the spectrum.
Slope for
RC#### anchored at R2456 and R2530.
|
R2456: 5
R2530: 5
R2600: 5
|
CO2 vs
water ice /soil; CO2 will be >>0, water and soil will be ~0
|
–
|
|
|
BDCARB
|
x
|
Carbonate
overtone band depth, or metal-OH band
|

|
–
|
Carbonates;
both overtones need to be present to increase parameter value
|
Many hydroxylated
silicate phases
|
|
42
|
MIN2295_ 2480
(beginning
with TER, MTRDR)
|
Ö
|
Mg Carbonate
overtone band depth and metal-OH band
|

|
R2165: 5
R2295: 5
R2364: 5
R2480: 5
R2570: 5
|
Mg -carbonates
or hydroxylated silicate; both overtones need to be present to increase
parameter value
|
–
|
|
43
|
MIN2345_2537
(beginning
with MTRDR)
|
Ö
|
Ca/Fe Carbonate
overtone band depth and metal-OH band
|

|
R2250: 5
R2345: 5
R2430: 5
R2537: 5
R2602: 5
|
Ca/Fe -carbonates
or hydroxylated silicate; both overtones need to be present to increase
parameter value
|
Prehnite,
Serpentine
|
|
|
BD2500H
|
x
|
Mg
Carbonate overtone band depth
|

|
R2380: 5
R2500: 5
R2510: 5
R2540: 5
|
Mg-carbonates
|
Some
zeolites
|
|
44
|
BD2500_2
|
Ö
|
Mg Carbonate
overtone band depth
|

|
R2364: 5
R2480: 5
R2570: 5
|
Mg-carbonates
|
Some
zeolites
|
|
45
|
BD3000
|
Ö
|
3-µm H2O
band depth
|

|
R2210: 5
R2530: 5
R3000: 5
|
bound H2O
(accounts for spectral slope)
|
–
|
|
46
|
BD3100
|
Ö
|
3.1-µm H2O
ice band depth
|

|
R3000: 5
R3120: 5
R3250: 5
|
H2O ice
|
–
|
|
47
|
BD3200
|
Ö
|
3.2-µm CO2
ice band depth
|

|
R3250: 5
R3320: 5
R3390: 5
|
CO2 ice
|
–
|
|
48
|
BD3400
|
Ö
|
3.4-µm
carbonate band depth
|

|
–
|
carbonates
|
–
|
|
49
|
BD3400_2
|
Ö
|
3.4-µm
carbonate band depth
|

|
R3250: 10
R3420: 15
R3630: 10
|
carbonates
|
–
|
|
50
|
CINDEX
|
Ö
|
3.9-µm
carbonate index
|
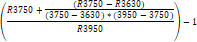
|
–
|
carbonates
will be > ‘bkgrnd’ values > 0
|
–
|
|
51
|
CINDEX2
|
Ö
|
Inverse
lever rule to detect convexity at 3.6 μm due to absorptions at 3.4
μm & 3.9 μm
|

|
R3450: 9
R3610: 11
R3875: 7
|
carbonates
will be > ‘bkgrnd’ values > 0
|
–
|
|
Atmospheric
Parameters (calculated using TRDR, MRDR, TER, MTRDR photometrically corrected
I/F)
|
|
52
|
R440
|
Ö
|
0.44-µm
reflectance
|

|
R440: 5
|
Clouds/Hazes
|
–
|
|
53
|
IRR1
|
Ö
|
IR ratio 1
|

|
R800: 5
R1020: 5
|
Aphelion
ice clouds (>1) vs. seasonal or dust (< 1)
|
–
|
|
54
|
BD2600
|
Ö
|
2.6-µm H2O
band depth
|

|
R2530: 5
R2600: 5
R2630: 5
|
H2O vapor
(accounts for spectral slope)
|
–
|
|
55
|
IRR2
|
Ö
|
IR ratio 2
|

|
R2210: 5
R2350: 5
|
aphelion
ice clouds vs. seasonal or dust
|
–
|
|
56
|
IRR3
|
Ö
|
IR ratio 3
|

|
R3390: 7
R3500: 7
|
aphelion
ice clouds (higher values) vs. seasonal or dust
|
–
|
See section 2.3.4 for general
information on CRISM product labels. A TRDR contains
two labels, both detached. One points to both the multiband radiance image and
the housekeeping listfile.
A second label points to the multiband summary product image,
if it is present. An example TRDR label is in Appendix C.
TRDR label
keywords with CRISM-specific values are listed in Table 3-13.
Table
3-13. CRISM-specific values for TRDR label
keywords
|
Keyword
|
Valid
Values
|
|
PRODUCT_TYPE
|
TARGETED_RDR
|
|
OBSERVATION_TYPE
|
FRT (Full Resolution
Targeted Observation)
HRL (Half Resolution Long Targeted Observation)
HRS (Half Resolution Short Targeted Observation)
FRS (Full
Resolution Short Targeted Observation)
ATO (Along-Track Oversampled Targeted Observation)
ATU (Along-Track Undersampled Targeted Observation)
EPF (Atmospheric Survey EPF)
TOD (Tracking Optical Depth Observation)
LMB (Limb Scan Observation)
MSP (Multispectral Survey)
HSP (Hyperspectral Survey)
HSV (Hyperspectral Survey - VNIR only, pixels 10x-binned)
MSV (Hyperspectral Survey - VNIR only, pixels 5x-binned)
MSW (Multispectral Window)
FFC (Flat-field calibration)
|
|
OBSERVATION_ID
|
8-byte hexadecimal integer
|
|
MRO:OBSERVATION_NUMBER
|
Counter from product ID, hexadecimal
|
|
MRO:ACTIVITY_ID
|
RA### – Radiance
IF### – I/F
AL### – Lambert albedo
SU### – Summary products
|
|
MRO:FRAME_RATE
|
""1", "3.75",
"5", "15", or "30"
|
|
MRO:SENSOR_ID
|
"S"
for VNIR, or "L" for IR
|
|
SHUTTER_MODE_ID
|
The
only valid value is "OPEN"
|
|
LIGHT_SOURCE_NAME
|
The
only valid value is "NONE"
|
|
MRO:CALIBRATION_LAMP_STATUS
|
The
only valid value is "OFF"
|
|
MRO:CALIBRATION_LAMP_LEVEL
|
The
only valid value is 0
|
|
PIXEL_AVERAGING_WIDTH
|
1,
2, 5, or 10
|
|
MRO:INSTRUMENT_POINTING_
MODE
|
"DYNAMIC POINTING" if SCAN_MODE (housekeeping file
column 213) equals 3; else "FIXED POINTING"
|
|
SCAN_MODE_ID
|
(If
DYNAMIC POINTING): "SHORT" (for full-resolution or half-resolution
short central swath, or limb scan observation), "LONG" (for
half-resolution long central swath), or "EPF" (for EPF even
if part of a different class of observation), through 2012. The value has
been designated “N/A” since truncated central scans without EPF images were
adopted for targeted observations at that time.
|
|
SAMPLING_MODE_ID
|
"HYPERSPECTRAL" if
wavelength filter used
returns contiguous rows or "MULTISPECTRAL" if not
|
|
MRO:EXPOSURE_PARAMETER
|
The value supplied to the CRISM
instrument to command the exposure time. At a given frame rate identified in
MRO:FRAME_RATE, there are 480 possible exposure times ranging from 1 to 480.
|
|
MRO:WAVELENGTH_FILTER
|
Which of four onboard menus of rows
was selected for downlink. The four choices are 0, 1, 2, or 3.
|
|
MRO:WAVELENGTH_FILE_NAME
|
For an EDR, the wavelength file
is a 5-column, 480-row text file. The five elements in each row are the row
number and a 0 or 1 for each of MRO:WAVELENGTH_FILTER 0, 1, 2 and 3,
indicating whether data from that row of the detector is included in the EDR
when that option is selected in MRO:WAVELENGTH_FILTER.
For a TRDR, the wavelength file
is an image whose value at the location of a detector element is the center
wavelength of that element, in nanometers.
|
|
MRO:PIXEL_PROC_FILE_NAME
|
For a TRDR, the name of the ASCII file
giving gain and offset to convert from 14 to 12 bits, and LUT used if lossy 12 to 8
bit compression is enabled (3
columns specified on a line-by-line basis)
|
|
MRO:INV_LOOKUP_TABLE_FILE_NAME
|
For a TRDR, the name of the ASCII file
giving the inverse translation from 8 to 12 bits if 12 to 8 bit compression
was enabled (not used in flight)
|
|
MRO:INVALID_PIXEL_LOCATION
|
(In v2 and earlier) X,Y,Z locations
within a TRDR at which data values
are invalid because they represent cosmic ray hits (not currently used)
|
|
MRO:REPLACED_PIXEL_
LOCATION
|
(In v2 and earlier) X,Y,Z locations
within a TRDR at which data values
were replaced by interpolating from surrounding pixels
|
|
MRO:ATMO_CORRECTION_FLAG
|
Whether
or not a correction has been performed for photometric and atmospheric
effects; "OFF" or "ON"
|
|
MRO:THERMAL_CORRECTION_
MODE
|
Whether and what type of thermal
correction has been performed to calibrated data. Valid values are
"OFF", "CLIMATOLOGY;ADR_CL",
"EMPIRICAL_MODEL_FROM_SPECTRUM;ALG_M",
"PHYSICAL_MODEL;ADR_TE", or “N/A”.
|
|
MRO:PHOTOCLIN_CORRECTION_
FLAG
|
Valid only in the case where the value
of keyword MRO:THERMAL_CORRECTION_MODE is PHYSICAL_MODEL;ADR_TE. If
MRO:PHOTOCLIN_CORRECTION_FLAG is OFF, then slopes used to calculate
temperature come from the companion DDR. If it is ON, then the slopes are
calculated using photoclinometry of CRISM data (not used in flight)
|
|
MRO:SPATIAL_SUBSAMPLING_FLAG
|
If = 1, keystone corrected to 610 or
2300 nm by cubic resampling
|
|
MRO:SPATIAL_SUBSAMPLING_FILE
|
If MRO:SPATIAL_SUBSAMPLING_FLAG=1, name of instrument kernel or
"CM" CDR used
|
|
MRO:SPATIAL_RESCALING_FLAG
|
If =1, VNIR rescaled to IR- 2300 nm -
by cubic resampling
|
|
MRO:SPATIAL_RESCALING_FILE
|
If MRO:SPATIAL_RESCALING_FLAG=1, name of instrument kernel or
"CM" CDR and frames kernel used
|
|
MRO:SPECTRAL_RESAMPLING_
FLAG
|
If =1, nearest-neighbor spectral
resampling has been performed
|
|
MRO:SPECTRAL_RESAMPLING_FILE
|
If MRO:SPECTRAL_RESAMPLING_ FLAG=1,
names of "PS" CDR used
|
|
MRO:HDF_SOFTWARE_NAME
|
Name
of the CRISM hyperspectral data filter software used to process radiance TRDR
data to I/F
|
|
MRO:HDF_SOFTWARE_VERSION_ID
|
Version
of the software used by the CRISM hyperspectral data filter application
|
|
MRO:IF_MIN_VALUE
|
Control
parameter for iterative kernel filter (IKF) used to convert IR radiance to
I/F; minimum valid value of I/F. Values outside valid range are ignored
during preprocessing
|
|
MRO:IF_MAX_VALUE
|
Maximum
valid value of I/F for IR IKF
|
|
MRO:TRACE_MIN_VALUE
|
Control
parameter for Ratio Shift Correction (RSC) used to convert VNIR and IR
radiance to I/F; minimum valid value of a computed ratio. Values outside of
the range are ignored during this processing step
|
|
MRO:TRACE_MAX_VALUE
|
Maximum
valid value of I/F for RSC
|
|
MRO:REFZ_MEDIAN_BOX_WIDTH
|
IKF
control parameter; kernel size of a median filter used in the spectral
direction in the computation of the reference cube during the preprocessing
steps
|
|
MRO:REFZ_SMOOTH_BOX_WIDTH
|
IKF
control parameter; kernel size of a boxcar smoothing filter used in the spectral
direction in the computation of the reference cube during the preprocessing
steps
|
|
MRO:FRAM_STAT_MEDIAN_BOX_
WIDTH
|
IKF
control parameter; kernel size of a median filter used on the frame median profile
in the computation of bad frames during preprocessing steps
|
|
MRO:FRAM_STAT_MIN_DEVIATION
|
IKF
control parameter; minimum deviation from the mean of an element of the
normalized frame median profile necessary to be classified as a bad frame during
preprocessing steps
|
|
MRO:FRAM_STAT_MEDIAN_CONF_
LVL
|
IKF
control parameter; the confidence level for the Grubb's Test used for outlier
detection of elements of the normalized median frame profile in the detection
of bad frames during preprocessing steps; typical values near 0.95
|
|
MRO:FRAM_STAT_IQR_CONF_LVL
|
IKF
control parameter; the confidence level for the Grubb's Test used for outlier
detection of elements of the normalized median profile of the frame
interquartile range in the detection of bad frames during preprocessing
steps; typical values near 0.95
|
|
MRO:RSC_REF_XY_MEDIAN_WIDTH
|
RSC
control parameter; kernel size of a median filter used in the XY direction
while computing the reference cube during the preprocessing steps
|
|
MRO:RSC_REF_XY_SMOOTH_
WIDTH
|
RSC
control parameter; kernel size of a boxcar smoothing filter used in the XY
direction while computing the reference cube during the preprocessing steps
|
|
MRO:RSC_REF_YZ_MEDIAN_WIDTH
|
RSC
control parameter; kernel size of a median filter used in the YZ direction
while computing the reference cube during the preprocessing steps
|
|
MRO:RSC_REF_YZ_SMOOTH_WIDTH
|
RSC
control parameter; kernel size of a boxcar smoothing filter used in the YZ
direction while computing the reference cube during the preprocessing steps
|
|
MRO:RSC_RATIO_XY_MEDIAN_
WIDTH
|
RSC
control parameter; kernel size of a median filter used in the XY direction
while computing the ratio cube during preprocessing steps
|
|
MRO:RSC_RATIO_XY_SMOOTH_
WIDTH
|
RSC
control parameter; kernel size of a smoothing boxcar filter used in the XY
direction while computing the ratio cube during preprocessing steps
|
|
MRO:RSC_RES_XY_PLY_ORDER
|
RSC
control parameter; the order of the polynomial used to model low frequency content
in the XY direction used as part of the RSC while computing the resolve cube
during post processing steps
|
|
MRO:RSC_RES_XY_PLY_EXTND_
WIDTH
|
RSC
control parameter; number of pixels used to extend the trend of the column
profiles when computing the polynomial used to model low frequency content in
the XY direction used as part of the RSC while computing the resolve cube
during the post processing steps
|
|
MRO:LOG_XFORM_NEG_CLIP_
VALUE
|
IKF
control parameter; value used for a negative I/F in the log base10 transform;
represents minimum possible output pixel value for IKF procedure
|
|
MRO:IKF_NUM_REGIONS
|
IKF
control parameter; number of spectral regions for application of IKF
procedure
|
|
MRO:IKF_START_CHANNEL
|
IKF
control parameter; number of first channel in a given spectral region for
application of IKF procedure
|
|
MRO:IKF_STOP_CHANNEL
|
IKF
control parameter; number of last channel in a given spectral region for
application of IKF procedure
|
|
MRO:IKF_CONFIDENCE_LEVEL
|
IKF
control parameter; confidence level for Grubb's Test used for outlier
detection of elements of model residuals in IKF procedure; typical values
near 0.95
|
|
MRO:IKF_WEIGHTING_STDDEV
|
IKF
control parameter; weighting parameter for final model evaluation in IKF
procedure
|
|
MRO:IKF_KERNEL_SIZE_X
|
IKF
control parameter; size of the kernel in the X direction used in the IKF
procedure
|
|
MRO:IKF_KERNEL_SIZE_Y
|
IKF
control parameter; size of the kernel in the Y direction used in the IKF
procedure
|
|
MRO:IKF_KERNEL_SIZE_Z
|
IKF
control parameter; size of the kernel in the Z direction used in the IKF
procedure
|
|
MRO:IKF_MODEL_ORDER_X
|
IKF
control parameter; dimensionality of the model in the X direction used in the
IKF procedure
|
|
MRO:IKF_MODEL_ORDER_Y
|
IKF
control parameter; dimensionality of the model in the Y direction used in the
IKF procedure
|
|
MRO:IKF_MODEL_ORDER_Z
|
IKF
control parameter; dimensionality of the model in the Z direction used in the
IKF procedure
|
|
BAND_NAME
|
Brief
descriptive name of each layer of data in the summary product multi-band image.
Values transitioned in 2014 following redefinition of summary product
definitions. See Table 3-12.
|
An MRDR (Figure 3-14) consists of
mosaicked, map-projected VNIR+IR multispectral survey
TRDRs, plus VNIR+IR hyperspectral survey TRDRs downsampled spectrally to
earlier multispectral wavelengths. All data are represented as 32-bit real
numbers. The files are updated infrequently, when a large amount of new
coverage or new processing procedures are available. The multispectral map RDR
contains up to five multiple-band images at 256 pixels/degree (v1, v3) or 327
pixels/degree (v4), and one list file containing wavelengths of the
multispectral data.
The first multiple-band image, if present, is
map-projected I/F without any further corrections applied, taken directly from
the TRDR associated with a strip of multispectral data. Although in the TRDRs
there are separate multiple-band images for the VNIR and IR detectors, in this
case the data are merged. The size of the multiple-band image varies between
map tiles. A typical multiple-band image might have 1280 pixels in the latitude
direction, a variable number of pixels in the longitude direction, and
approximately 72 pixels in the wavelength dimension, representing each of the
selected channels in multispectral mode. This serves as a backup to the Lambert
albedo image if it is not present, or for when Lambert albedo processing was in
early development.
The second multiple-band image, if present, is
geometrically identical to the map-projected I/F multiple-band image, except
that the data have been processed using the ADR binary
tables and other subsequent steps as described in Appendix P3 to Lambert albedo (the estimated surface contribution to reflected I/F,
divided by cos i).
The third and fourth multiple-band images, if present,
contains map-projected data from the DDRs associated
with strips of multispectral data, used to derive I/F from
radiance. One file corresponds to the I/F image, and one file corresponds to
the Lambert albedo image (the component image strips may be fewer in the
Lambert albeo file). In each of these, 11 additional layers are specific to
individual multispectral strips used to assemble the tile, and are not
contained in source DDRs.
§ Solar longitude, units degrees
§ Solar distance at time of
measurement, units AU
·
VNIR OBSERVATION_ID
of constituent measurement
·
IR OBSERVATION_ID of constituent measurement
·
The VNIR OBSERVATION_NUMBER
carried through from the source scene EDRs;
·
The IR OBSERVATION_NUMBER carried through from the source scene
EDRs;
·
The VNIR LINE_SAMPLE
carried through from the temporary TRDR used
to populate the MRDR; this identifies the VNIR wavelength calibration at the
spatial pixel of the MRDR
·
The IR LINE_SAMPLE carried through from the temporary TRDR used to populate the MRDR; this identifies the IR wavelength calibration at the
spatial pixel of the MRDR
·
The LINE_SAMPLE from the source VNIR TRDR;
this together with column number, observation ID, and ordinal counter provides
traceability back to a spatial pixel in a source EDR
·
The LINE from the source IR TRDR
·
The LINE from the source VNIR TRDR
The fifth multiple-band image contains map-projected
summary products from multispectral data.
The listfile, in ASCII format, contains wavelengths of
each layer in the Lambert albedo and I/F images.
Three versions of MRDRs have been released, with version
numbers loosely keyed to calibration version numbers of input TRDRs. Which
multiband images are present differ with version depending on the development
status of the processing pipeline. Versions 1 and 3 have included content from TRDRs
of mapping data having the corresponding version numbers. Summary product
values at a given column within a strip are normalized to their along-track
values as a first order correction for optical artifacts. There are no
corrections for stochastic noise or inter-strip residuals due to calibration
artifacts or differences in atmospheric opacity. V1 contains all five multiband
images; V3 contains updated uncorrected I/F and the corresponding derived data.
Version 4 uses v3 radiometric calibration, but adopts a
different approach to populating map tiles with strips of mapping data. For
individual input mapping strips, the remediation of systematic optical and
calibration artifacts is included at the input strip level (adapted from v3 TERs
and MTRDRs). Prior to tile assembly, corrected I/F values for Lambert albedo
and summary product files are subjected to a normalization procedure to minimize
differences between overlapping strips of mapping data, using as reference data
acquired under clear atmospheric conditions early in the mission when the IR
detector was operated at its coldest with the least noise. Appendix P3 provides
further detail. As this is the ultimate version of MRDRs, only Lambert albedo,
corresponding derived data, and summary product multiband images are present.
Areocentric latitude and longitude, incidence, emission,
and phase angles are derived from spacecraft attitude, gimbal position, pixel
location, and MOLA shape model of Mars. The adopted projection convention is
planetocentric, positive east, using the 2000 IAU prime meridian and pole of
rotation. The projection varies in 5° latitude bands, using EQUIRECTANGULAR
equatorward of 87.5° latitude and POLAR STEREOGRAPHIC poleward of that
latitude. For the latitude bands projected equirectangularly, the center latitude
of projection is the center of each tile to minimize "distortion."
For the latitude band projected polar stereographically, in the north 0°
longitude is down, and in the south 0° longitude is up.
For multispectral RDRs, the planet is divided into 1964
non-overlapping tiles as shown in Figure 2-10. Their longitude width increases
poleward to keep tiles approximately the same in area. Through v3 they were
structured with 256 pixels/degree (ppd). Beginning in v4, the map tiles are
structured at 327 ppd to better match the native resolution of the data.
The multiband images are accompanied in the BROWSE
directory by browse products, which are composed of thematically related
byte-scaled spectral summary products and are described in detail in Section
3.11.3.


Figure 3-14. Contents of a CRISM Reduced Data Record for a
multispectral map tile (MRDR).
See section 2.3.4 for general
information on CRISM product labels. Each component file of the MRDR has a single label pointing to it. An example MRDR label is in Appendix D.
MRDR label keywords with CRISM-specific values are listed
in Table 3-15.
Table
3-15. CRISM-specific values for MRDR label keywords
|
Keyword
|
Valid Values
|
|
PRODUCT_TYPE
|
MAP_PROJECTED_MULTISPECTRAL_RDR
|
|
BAND_NAME
|
Brief descriptive name of each layer of data
in the summary product multi-band image or
the geometric/timing multi-band image. See Table 3-12.
|
|
MRO:ATMO_CORRECTION_FLAG
|
Whether
or not a correction has been performed for photometric and atmospheric
effects; "OFF" or "ON"
|
|
MRO:PHOTOCLIN_CORRECTION_ FLAG
|
Validity only in the
case where the value of keyword MRO:THERMAL_CORRECTION_MODE is
PHYSICAL_MODEL;ADR_TE. If
MRO:PHOTOCLIN_CORRECTION_FLAG is OFF, then slopes used to calculate
temperature come from the companion DDR. If it is ON, then the slopes are
calculated using photoclinometry of CRISM data
|
|
MRO:THERMAL_CORRECTION_ MODE
|
Whether and what type
of thermal correction has been performed to calibrated data. Valid values are
"OFF", "CLIMATOLOGY;ADR_CL",
"EMPIRICAL_MODEL_FROM_SPECTRUM;ALG_M",
"PHYSICAL_MODEL;ADR_TE", or “N/A”
|
A VRDR (Figure 3-14) consists of mosaicked, map-projected
VNIR hyperspectral mapping TRDRs (MSV, 90 channels, 90 m/pixel), VNIR
hyperspectral mapping TRDRs (HSV, 107 channels, 180 m/pixel) downsampled
spectrally to MSV wavelengths to fill gaps in MSV coverage. All data are
represented as 32-bit real numbers. The VNIR hyperspectral map RDR contains three
multiple-band images at 654 pixels/degree, and one list file containing
wavelengths of the data.
The first multiple-band image is VNIR Lambert albedo
constructed in the same fashion as the post-2012 MRDR data, using volcano scan
corrections and strip-to-strip reconciliation using as anchor strips those
acquired under conditions closest to tdust
= 0.2, tice = 0.0. The size
of the multiple-band image varies between map tiles. A typical multiple-band
image has 3271 pixels in the latitude direction, a variable number of pixels in
the longitude direction, and 90 pixels in the wavelength dimension,
representing each of the selected channels in MSV mode.
The second multiple-band image contains map-projected data
from the DDRs associated with strips of VNIR hyperspectral data converted to Lambert albedo. 7 layers are specific to individual multispectral
strips used to assemble the tile, and are not contained in source DDRs.
§ Solar longitude, units degrees
§ Solar distance at time of
measurement, units AU
·
VNIR OBSERVATION_ID of constituent measurement
·
The VNIR OBSERVATION_NUMBER carried through from the source scene
EDRs;
·
The VNIR LINE_SAMPLE carried through from the temporary TRDR used to populate the MRDR; this identifies the VNIR wavelength calibration at the
spatial pixel of the MRDR
·
The LINE_SAMPLE from the source VNIR TRDR;
this together with column number, observation ID, and ordinal counter provides
traceability back to a spatial pixel in a source EDR
·
The LINE from the source VNIR TRDR
The third multiple-band image contains map-projected
summary parameters from VNIR hyperspectral data. Only those parameters that can
be constructed from VNIR-only data are included.
The listfile, in ASCII format, contains wavelengths of
each layer in the Lambert albedo and I/F images
VRDRs use v3 radiometric calibration, and the same
approach to populating map tiles with strips of mapping data as with v4 MRDRs.
Areocentric latitude and longitude, incidence, emission,
and phase angles are derived from spacecraft attitude, gimbal position, pixel
location, and MOLA shape model of Mars. The adopted projection convention is
planetocentric, positive east, using the 2000 IAU prime meridian and pole of
rotation. The projection varies in 5° latitude bands, using EQUIRECTANGULAR
equatorward of 87.5° latitude and POLAR STEREOGRAPHIC poleward of that
latitude. For the latitude bands projected equirectangularly, the center latitude
of projection is the center of each tile to minimize "distortion."
For the latitude band projected polar stereographically, in the north 0°
longitude is down, and in the south 0° longitude is up.
For VNIR hyperspectral RDRs, the planet is divided into
1964 non-overlapping tiles as shown in Figure 2-10. Their longitude width
increases poleward to keep tiles approximately the same in area. The map tiles
are structured at 654 ppd to match the native resolution of the data.
The multiband images are accompanied in the BROWSE
directory by browse products, which are composed of thematically related
byte-scaled spectral summary products and are described in detail in Section
3.11.3.
See section 2.3.4 for general information on CRISM product
labels. Each component file of the VRDR has a single label pointing to it. An
example VRDR label is in Appendix Q.
VRDR label keywords with CRISM-specific values are listed
in Table 3-16.
Table 3-16.
CRISM-specific values for VRDR label keywords
|
Keyword
|
Valid Values
|
|
PRODUCT_TYPE
|
MAP_PROJECTED_VNIR_HYPERSPECTRAL_RDR
|
|
BAND_NAME
|
Brief descriptive name of each layer of data
in the summary product multi-band image or
the geometric/timing multi-band image. See Table 3-12.
|
A Targeted Empirical Record (TER)
spectral product is a spatially reconciled (coregistered VNIR and IR; S- and L-
detector), full spectral range (VNIR and IR; S- and L- detector) I/F targeted
observation central scan multiband image in the IR (L-detector) sensor space
that has been corrected for geometric, photometric, atmospheric, and
instrumental effects. The corresponding Map-projected Targeted Reduced Data
Record (MTRDR) (Figure 3-17) spectral product consists of the TER corrected I/F
spectral information after map projection and the removal of spectral channels
with suspect radiometry (“bad bands”). The MTRDR spectral product is similar in
concept to a local, high-resolution map tile comparable to an MRDR, but at ~10-
or ~5 times higher spatial resolution with hyperspectral sampling. The TER/MTRDR
product set includes a hyperspectral image cube in units of corrected I/F (IF),
spectral summary parameters (SU) derived from the corrected spectral reflectance
data, residual noise-remediated refined spectral summary parameters (SR), browse
products (BR) derived from the refined spectral summary parameters, data
processing information maps (IN), a map projected version of the associated IR
(L-detector) DDR (DE) (MTR product only), and a text table that lists
wavelength information (WV) for the spectral image cube. All of the image cubes
are 32-bit real, with the exception of the browse products which have been
byte-scaled (8-bit). A detailed description of the TER/MTRDR data processing is
provided in Appendix P1.
The primary TER/MTRDR data products are hyperspectral multi-band
images (IF) with units of corrected I/F in the IR (L-detector) sensor space
(TER) and map-projected according to MRO project standards (MTR). A typical MTR
hyperspectral multiband image (with an equirectangular map projection) has XX
pixels in the longitude dimension, YY pixels in the latitude dimension, and ZZ
pixels in the wavelength dimension, where XX and YY depend on the source data
characteristics and target location, and ZZ is the number of channels retained
in the product across the full spectral range. Spatial dimensions are
consistent across all genetically related (common source Target ID) TER and MTR
product sets.
The spectral summary products (SU; defined in Table 3-12) are
multi-band images composed of the results of a suite of spectral band math
calculations designed to parameterize the known surface mineralogical
diversity. The CRISM spectral summary parameter library has been significantly
revised and expanded in association with the TER/MTRDR development and is
documented in Applicable Document [11]. The refined summary parameter products (SR)
have been post-processed to remove the most egregious effects of spectral
noise.
The browse products are composed of thematically related byte-scaled
spectral summary products and are described in detail in Section 3.12.3.
The data processing information (IN) products are
multi-band images that provide visibility into TER/MTRDR data processing
pipeline residuals in a spatial frame consistent with the TER/MTRDR data
product suite.
The table file, in ASCII format, contains wavelength
information for each spectral band in the Lambert albedo multiband image.
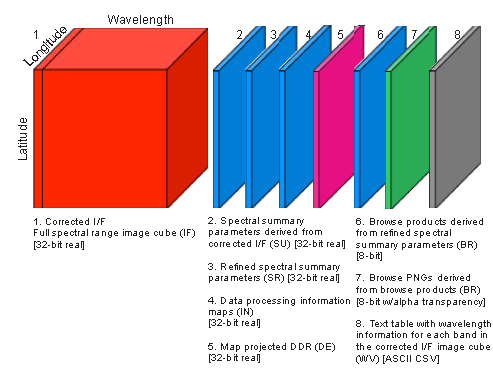
Figure 3-17. Contents of a
CRISM Map-projected Targeted Reduced Data Record (MTRDR) Data Product Set
See section 2.3.4 for general
information on CRISM product labels. Example TER and MTRDR labels are provided in
Appendix E.
TER/MTRDR
label keywords with CRISM-specific values are listed in Table 3-18.
Table
3-18. CRISM-specific values for TER/MTRDR label keywords
|
Keyword
|
Valid Values
|
|
PRODUCT_TYPE
|
MPTARGETED_RDR, MPTARGETED_BROWSE,
MAP_PROJECTED_DDR, TER, TARGETED_BROWSE
|
|
OBSERVATION_TYPE
|
FRT (Full Resolution Targeted
Observation)
HRL (Half Resolution Long
Targeted Observation)
HRS (Half Resolution Short
Targeted Observation)
|
|
OBSERVATION_ID
|
8-byte
hexadecimal integer
|
|
MRO:OBSERVATION_NUMBER
|
Counter from product ID
|
|
MRO:ACTIVITY_ID
|
IF### – Scene measurement
|
|
MRO:SENSOR_ID
|
"J" for joined
|
|
MRO:WAVELENGTH_FILE_NAME
|
The name of the
companion file with wavelength information for each spectral band.
|
|
MRO:
PHOTOMETRIC_CORR_FLAG
|
Indicates
the application of a Lambertian photometric correction. Valid values are:
“ON”, “OFF”
|
|
MRO:
ATMOSPHERIC_CORR_FLAG
|
Indicates
the application of a correction for atmospheric gas absorptions. Valid values
are: “ON”, “OFF”
|
|
MRO:
RATIO_SHIFT_CORR_FLAG
|
Indicates
the application of the Ratio Shift Correction (RSC), a robust column-oriented
‘destriping’ procedure. Valid values are: “ON”, “OFF”
|
|
MRO:
EMPIRICAL_GEOM_NORM_FLAG
|
Indicates
the application of the Empirical Geometric Normalization (EGN) procedure
which normalizes the contribution of atmospheric I/F to that at the mimimum
emergence angle in the image. Valid values are: “ON”, ”OFF”.
|
|
MRO:
EMPIRICAL_SMILE_CORR_FLAG
|
Indicates
the application of the Empirical Smile Correction (ESC) procedure. Valid
values are: “ON”, ”OFF”.
|
|
MRO:
SENSOR_SPACE_TRANSFORM_FLAG
|
Indicates
the application of a spatial transform that maps CRISM VNIR data from a given
targeted observation into the corresponding IR data sensor space. Valid
values are: “ON”, ”OFF”
|
A level-6 CDR (Figure 3-19) consists of tabulated derived
data. Typically it is used for calibration of EDRs to CDRs, radiance or I/F. Derivation of the level-6 CDRs from flight data is described in Appendix M. The
different types of calibration-related level-6 CDRs are given in Table 3-20.
The CDR6 format
is also used to store operationally significant engineering information that
the user may find helpful, but that are beyond the scope of the required
elements of the archive. This includes a time ordered history of observations
and the characteristics of the sites observed, as well as the
configuration-managed history of the hardware and software state of the CRISM
instrument. These "operational CDRs" are described in Table 3-21.
File format is comparable to that of EDR and
RDR list files. The tables are ASCII comma-separated value (CSV) format.
See section 2.3.4 for general information on CRISM product
labels. An example level-6 CDR label is in Appendix F.

Figure 3-19. Contents of a CRISM Calibration Data Record
(CDR). Level 4 is image data; level 6 is text.
Table 3-20. Descriptions of calibration-related level-6
CDRs
|
PRODUCTS
|
FORM FOR EACH FOCAL
PLANE
|
PRODUCT ACRONYM
|
|
INFREQUENTLY UPDATED PRODUCTS
|
|
Coefficients for correcting raw housekeeping for effects of lamps, coolers, frame rate
|
ASCII table , 11 columns
(only one file applicable
to both VNIR and IR)
|
HD
|
|
Coefficients for calibrating housekeeping from digital to physical units
|
ASCII table , 5 columns
(only one file applicable
to both VNIR and IR)
|
HK
|
|
Coefficients to convert housekeeping voltages for perturbations due to current
|
ASCII table , 7 columns
(only one file applicable
to both VNIR and IR)
|
HV
|
|
Gain and offset to use for each row for 12 to 14 bit
conversion; 12 to 8 bit lookup tables for each row (if used)
|
ASCII table, 4 columns, 1
per detector
|
PP
|
|
Wavelength tables
|
ASCII table, 5 columns, 1
per detector
|
WV
|
|
Bandwidth for each row (band) in central columns of
each detector at which spectral smile and keystone are minimum.
|
ASCII table, 2 cols VNIR
and 11 cols IR, 1 per detector
|
BW
|
|
Center wavelength for each row (band) in central
columns of each detector at which spectral smile and keystone are minimum.
|
ASCII table, 2 columns, 1 per
detector
|
SW
|
|
12 to 8 bit lookup tables
|
ASCII table, 1 col. of
12-bit input, 8 cols. of 8-bit output
|
LK
|
|
8 to 12 bit lookup tables (inverse of 12 to 8)
|
ASCII table, 8 cols. of
8-bit input, 1 col. of 12-bit output
|
LI
|
|
Linearity correction
|
ASCII table, 7 columns, 1
per detector
|
LC
|
|
Bias step function as a function of frame rate and
quadrant
|
ASCII table, 3 columns, 1
per detector
|
BS
|
|
Additive correction of bias to nominal detector
operating temperature
|
ASCII table, 3 columns, 1
per detector
|
DB
|
|
Additive correction of bias to nominal focal plane
electronics operating temperature
|
ASCII table, 3 columns, 1
per detector
|
EB
|
|
Interquadrant ghost removal scaling factors
|
ASCII table, 6 columns, 1
per detector
|
GH
|
|
Average Mars spectrum for limiting cases in
different operating modes
|
ASCII table, 6 columns, 1
per detector
|
AS
|
|
Saturation limit for each detector quadrant and
frame rate
|
ASCII table, 3 columns, 1
per detector
|
SL
|
|
Valid limits for each detector quadrant and frame
rate for 14-bit DN level and noise
|
ASCII table, 5 columns, 1
per detector
|
VL
|
|
Atmospheric transmission for each wavelength bin
averaged over IR columns 270-369 or VNIR columns 260-359, the part of each
detector at which spectral smile and keystone are minimum
|
ASCII table, 2 columns, 1 per detector
|
CT
|
|
FREQUENTLY UPDATED PRODUCTS
|
|
Standard
telemetry file: CRISM low-rate telemetry in raw counts, from the beginning of
a UTC calendar day to its end. This is used in preference to the telemetry attached
to each image for correction of thermal effects.
|
ASCII table, 224 columns
|
ST
|
|
Predicted
EDR processing table: Predicted table
of EDRs containing scene data and the corresponding EDRs containing
time-dependent calibration measurements. It is constructed from uplinked
commands
|
ASCII table, 21 columns
|
BTF
|
|
EDR processing table: Table of EDRs containing scene
data and the corresponding EDRs containing time-dependent calibration
measurements. Used to process scene EDRs to TRDRs, and calibration EDRs to
CDRs. If there is a discrepancy between the actual and predicted EDRs used
for calibration, the TRDRs resulting from scene EDRs are quality-flagged.
|
ASCII table, 6 columns
|
ATF
|
Table
3-21. Descriptions of operational level-6 CDRs
|
PRODUCTS
|
FORM FOR EACH FOCAL
PLANE
|
PRODUCT ACRONYM
|
|
Digital values of alarm limits and instrument parameters.
Used for validation of uplinked sequences.
|
ASCII table with columns
of start time of applicability, raw digital value, and comments (only one
file applicable to both VNIR and IR)
|
DR
|
|
Calibrated physical values of alarm limits. Used for
validation of uplinked sequences.
|
ASCII table with columns
of start time of applicability, value as Celsius, volts, or amps, and
comments (only one file applicable to both VNIR and IR)
|
DC
|
|
Digital values of heater and cooler settings. Used
for validation of uplinked sequences.
|
ASCII table with columns
of start time of applicability, raw digital value, and comments (only one
file applicable to both VNIR and IR)
|
SR
|
|
Calibrated physical values of heater and cooler
settings. Used for validation of uplinked sequences.
|
ASCII table with columns
of start time of applicability, value as Celsius, and comments (only one file
applicable to both VNIR and IR)
|
SC
|
|
Expected compression ratio of data in different instrument con figurations. Used for
management of solid state recorder usage.
|
ASCII table with columns
activity, wavelength filter, binning, lossy compression setup, lossless compression setup, and expected compression
ratio of data with that configuration.
|
CP
|
|
Mission event log. Includes times of updates to
instrument software or settings, command loads, flight tests, or other
notable events.
|
ASCII table with columns
of start time and comments (only one file applicable to both VNIR and IR)
|
EL
|
A level-4 CDR (Figure 3-19) consists of a derived image
product needed for calibration to radiance or I/F.
Derivation of the level-4 CDRs from flight data is described in Appendix L. The
different types of level-4 CDRs are given in Table 3-22. The data may be bitmap
or 32-bit real numbers, depending on the product.
A level-4 CDR contains one or more images. The size varies
according to pixel binning. The dimensions are XX’ pixels in the sample
(cross-track) dimension, YY pixels in the wavelength dimension, where:
§
XX’= (640)/binning, where 640 is the number of columns read off
the detector, and binning is 1, 2, 5, or 10
§
YY= the number of rows (wavelength) that are retained by the
instrument.
See section 2.3.4 for general information on CRISM product
labels. An example level-4 CDR label is in Appendix G.
Table 3-22. Descriptions of level-4 CDRs
|
PRODUCTS
|
FORM FOR EACH FOCAL PLANE
|
VERSIONS FOR DIFFERENT PIXEL BINNING / CHANNEL
SELECTION?
|
VERSIONS FOR DIFFERENT FRAME RATE?
|
ACRONYM
|
|
|
GROUND
CALIBRATION PRODUCTS
|
|
|
Masks
of detector dark columns, scattered light columns, scene columns
|
2D matrix per detector, 8 bit
|
Y
|
N
|
DM
|
|
|
Nonuniformity file:
time-tagged, row-normalized measurement of detector nonuniformity
|
Two 2D matrices, 32 bit
|
Y
|
Y
|
NU
|
|
|
Matrices
to remove estimated leaked higher order light
|
Four 2D matrices per detector, 16 bit integer, row
numbers
Four 2D matrices per detector, 32 bit, weighting
coefficients
|
Y
|
N
|
LL
|
|
|
Sphere
spectral radiance at set point (pixel by pixel coefficients to a 2nd order
polynomial function of optical bench temperature)
|
Three 2D matrices per detector, 32 bit, for each
sphere bulb
|
Y
|
N
|
SS
|
|
|
Shutter position reproducibility correction to sphere radiance (pixel by pixel coefficients to a linear
function of the ratio of corrected sphere image to sphere spectral radiance
model)
|
2 2D matrices per detector, 32 bit, for each sphere bulb
|
Y
|
N
|
SH
|
|
|
Temperature
dependence of detector responsivity (pixel by pixel coefficients to a 2nd
order polynomial function of detector temperature)
|
Three 2D matrices per detector, 32 bit
|
Y
|
N
|
TD
|
|
|
Along-slit
angle measured from slit center
|
2D matrix per detector, 32 bit
|
Y
|
N
|
CM
|
|
|
Number
of lines by which to shift each column (sample) of an image to minimize the
effects of spectral smile
|
2D matrix per detector, 32 bit
|
Y
|
N
|
PS
|
|
|
Wavelength
image (each pixel) determined onground
|
2D matrix per detector, 32 bit
|
Y
|
N
|
WA
|
|
|
Nearest-neighbor
resampled wavelength image (each pixel) determined onground
|
2D matrix per detector, 32 bit
|
Y
|
N
|
RW
|
|
|
Spectral
bandpass, or full width half maximum (each pixel) determined onground
|
One (VNIR) or ten(IR) 2D matrices per detector, 32
bit
|
Y
|
N
|
SB
|
|
|
Solar
flux at 1 AU (for each pixel to take into account spectral smile effects)
|
2D matrix per detector, 32 bit
|
Y
|
N
|
SF
|
|
|
Nearest-neighbor
resampled solar flux at 1 AU (for each pixel to take into account spectral
smile effects)
|
2D matrix per detector, 32 bit
|
Y
|
N
|
RF
|
|
|
Atmospheric
transmission as measured from a nadir-pointed hyperspectral scan across
Olympus Mons
|
2D matrix per detector, 32 bit
|
Y
|
N
|
AT
|
|
|
Atmospheric
transmission as measured from a nadir-pointed hyperspectral scan across
Olympus Mons, nearest-neighbor resampled in the wavelength direction
|
2D matrix per detector, 32 bit
|
Y
|
N
|
RT
|
|
|
FREQUENTLY UPDATED PRODUCTS
|
|
Bad
pixel mask: time-tagged bitmap of bad pixels
|
2D matrix, 8 bits, per detector
|
Y
|
Y
|
BP
|
|
|
Bias file:
time-tagged, fitted VNIR and IR images extrapolated to zero exposure time
|
2D matrix, 32 bit, per detector
|
Y
|
Y
|
BI
|
|
|
Background file:
time-tagged, bias- and ghost-subtracted, linearized, averaged VNIR and IR
background frames
|
2D matrix, 32 bit, per detector
|
Y
|
Y
|
BK
|
|
|
Noise file:
time-tagged, image of pixel-by-pixel uncertainties in background images
|
2D matrix, 32 bit, per detector
|
Y
|
Y
|
UB
|
|
|
Processed sphere image in units of DN/ms
|
2D matrix, 32 bit, per detector (1 for each sphere bulb)
|
Y
|
N
|
SP
|
|
CDR label keywords with CRISM-specific values are listed
in Table 3-23.
Table 3-23. CRISM-specific values for CDR label keywords
|
Keyword
|
Valid Values
|
|
PRODUCT_TYPE
|
CDR
|
|
OBSERVATION_TYPE
|
If produced from flight data:
FRT (Full Resolution Targeted
Observation)
HRL (Half Resolution Long
Targeted Observation)
HRS (Half Resolution Short
Targeted Observation)
FRS (Full
Resolution Short Targeted Observation)
ATO
(Along-Track Oversampled Targeted Observation)
ATU
(Along-Track Undersampled Targeted Observation)
EPF (Atmospheric Survey EPF)
TOD (Tracking Optical Depth
Observation)
MSP (Multispectral Survey,
losslessly compressed)
MSW (Multispectral Window)
HSP
(Hyperspectral Survey, losslessly compressed)
HSV
(Hyperspectral Survey - VNIR only, pixels 10x-binned)
MSV
(Hyperspectral Survey - VNIR only, pixels 5x-binned)
CAL (Radiometric Calibration)
FFC (Flat-field calibration)
ICL (Calibration source
intercalibration)
|
|
OBSERVATION_ID
|
10-digit
hexadecimal integer (if produced from flight data)
|
|
MRO:OBSERVATION_NUMBER
|
Counter from product ID (if produced from
flight data)
|
|
MRO:ACTIVITY_ID
|
Valid values (if produced from
flight data) are:
BI### – Bias measurement
DF### – Dark field measurement
LP### – Lamp measurement
SP### – Sphere measurement
SC### – Scene measurement (for
flat-field calibration)
|
|
SOURCE_PRODUCT_ID
|
The product ID of the EDR from which a CDR was constructed
(if produced from flight data)
|
|
MRO:EXPOSURE_PARAMETER
|
The value supplied to
the CRISM instrument to command the exposure time. At a given frame rate
identified in MRO:FRAME_RATE, there are 480 possible exposure times ranging from
1 to 480.
|
|
MRO:WAVELENGTH_FILTER
|
Which of four onboard
menus of rows was selected for downlink. The four choices are 0, 1, 2, or 3.
|
|
MRO:SENSOR_ID
|
"S" for VNIR, or "L" for
IR
|
|
SHUTTER_MODE_ID
|
"OPEN", "SPHERE", OR
"CLOSED" (if produced from flight data)
|
|
LIGHT_SOURCE_NAME
|
"NONE", "VNIR LAMP 1",
"VNIR LAMP 2", "IR LAMP 1", "IR LAMP 1",
"SPHERE LAMP 1", "SPHERE LAMP 2"
|
|
MRO:CALIBRATION_LAMP_STATUS
|
"OFF", "OPEN LOOP" or
"CLOSED LOOP" (for integrating sphere only)
|
|
MRO:CALIBRATION_LAMP_LEVEL
|
Value between 0 and 4095
|
|
PIXEL_AVERAGING_WIDTH
|
1, 2, 5, or 10
|
|
MRO:DETECTOR_TEMPERATURE
|
Physical
units; used to correct bias or responsivity for detector temperature. On each
detector there are two temperature sensors. The primary source of IR detector
temperature is IR temperature sensor 1 (column 50 in the EDR list file). The backup source of
IR detector temperature is IR temperature sensor 2 (column 51 in the EDR list
file). The primary source of VNIR detector temperature is VNIR temperature
sensor 2 (column 65 in the EDR list file). The backup source of VNIR detector
temperature is VNIR temperature sensor 1 (column 64 in the EDR list
file)."
|
|
MRO:FPE_TEMPERATURE
|
Physical
units; used to correct bias for electronics temperature. The temperature of
the IR focal plane electronics (if MRO:SENSOR_ID = "L"), or the
VNIR focal plane electronics (if MRO:SENSOR_ID = "S").
|
|
MRO:OPTICAL_BENCH_
TEMPERATURE
|
Physical units; backup to correct sphere radiance for
sphere temperature
|
|
MRO:SPHERE_TEMPERATURE
|
Physical units; used to correct sphere radiance for
sphere temperature
|
|
MRO:SPECTROMETER_HOUSING_
TEMP
|
Physical
units; used in backup correction of background for spectrometer housing
temperature. The primary source of this temperature is a measurement
digitized by the VNIR focal plane electronics, column 58 in the EDR list file. The backup
source of this temperature is a measurement digitized by the IR focal plane
electronics, column 69 in the EDR list file
|
|
BAND_NAME
|
Brief descriptive name of each layer of data
in the CDR
|
An Ancillary Data Record or ADR, if archived, contains a hyperdimensional binary table of derived values, where the axes of the
matrix represent values of a layer of a DDR (e.g.,
incidence angle, thermal inertia, etc.), the output of another ADR, or a value
extracted from a TRDR.
The overall objective of ADRs is to correct I/F in
a TRDR for a strip of multispectral survey data for atmospheric, photometric,
or (possibly) thermal effects to isolate the surface-reflected component of I/F
as Lambert albedo.
There are three types of ADRs:
1.
The "CL" ADR is
a table of surface temperatures and atmospheric dust and ice opacities, given
for a latitude and longitude from the DDR and
Ls and local solar time from the TRDR label.
2.
The "AC" ADR is
a table of correction from I/F to
Lambert albedo, for an incidence, emission, and phase angle and surface
elevation from the DDR, dust and ice optical depths and surface temperature
from the CL ADR, and observed I/F from a TRDR.
There is a separate AC ADR for each wavelength that is corrected; nominal
wavelengths are those used in multispectral mapping, in wavelength filter 1.
3.
The "TE" ADR is
a table of calculated surface temperature for latitude, thermal inertia,
elevation, and slope magnitude and azimuth from the DDR,
dust and ice opacity from the CL ADR, Ls and local solar time from the TRDR label, and bolometric albedo estimated from Lambert albedo at
wavelengths <2300 nm. This supplants surface temperature that is returned
from the CL ADR.
ADR contents
are described in Tables 3-24 through 3-26. Whether archived or not, they are
used in the process of converting I/F to Lambert albedo during production of
MRDRs. In that processing the thermal correction to the longest IR wavelengths
is not implemented.
Table 3-24. LUT for atmospheric opacity (ADR type
= CL)
|
VARIABLE
|
RANGE
|
UNIT
|
|
Latitude
|
-90-90°
|
degrees
|
|
Longitude
|
-90-90°
|
degrees
|
|
Ls
|
0-360°
|
degrees
|
|
Local time
|
15
|
(assumed local time)r
|
|
Surface temperature
|
180-310
|
°K
|
|
Dust opacity
|
0-1.0
|
dimensionless opacity
|
|
Ice opacity
|
0-1.0
|
dimensionless opacity
|
Table
3-25. LUT for predicted atmospheric / photometric / thermal correction (ADR type = AC)
|
VARIABLE
|
RANGE
|
WAVELENGTH
|
|
Wavelength
|
410-3920 nm
|
(separate table for each wavelength)
|
|
Incidence angle at areoid
|
25-75°
|
degrees
|
|
Emission angle at areoid
|
0-45°
|
degrees
|
|
Phase angle at areoid
|
45-135°
|
degrees
|
|
Elevation
|
-8000-26000
|
meters
|
|
Dust optical depth
|
0-1
|
dimensionless opacity
|
|
Ice optical depth
|
0-0.6
|
dimensionless opacity
|
|
Surface temperature
|
140-300 K
|
°K
|
|
Observed I/F
|
0.03-0.50
|
dimensionless
|
Table 3-26. LUT for local surface temperature (ADR type = TE)
|
VARIABLE
|
RANGE
|
UNITS
|
|
Latitude
|
-90-90°
|
degrees
|
|
Slope magnitude
|
0-10
|
degrees
|
|
Slope azimuth
|
0-270
|
degrees clockwise from north
|
|
Elevation
|
-8000-26000
|
meters
|
|
Thermal inertia
|
5-5000
|
J m^-2 K^-1 s^-0.5
|
|
Dust+ice opacity
|
0-1.0
|
dimensionless opacity
|
|
Ls
|
0-360°
|
degrees
|
|
Local time
|
13-17
|
(assumed local time)r
|
|
Bolometric albedo
|
0.15-0.35
|
dimensionless
|
Four types of SPICE kernels
are needed to calculate CRISM's pointing:
1) Frames kernel (FK). This file defines the
relationships of the of CRISM's field of view to the spacecraft, with the
gimbal at "nadir". These transformations in frames of reference
include:
·
gimbal base (MRO_CRISM_BASE) -> spacecraft (MRO_SPACECRAFT)
·
optical axis at gimbal "nadir" (MRO_CRISM_OSU) ->
gimbal base (MRO_CRISM_BASE)
·
(the gimbal C kernel defines the relationship of optic axis at a
gimbal position to the gimbal nadir)
·
(the gimbal offset defines the software offset between commanded
nadir and physical nadir)
·
IR zero position for IK (MRO_CRISM_IR) -> optical axis
(MRO_CRISM_OSU); nominal there two are coaligned and offsets of the IR FOV from
the optical axis are entirely accounted for in the IK
·
VNIR zero position for IK (MRO_CRISM_VNIR) -> optical axis
(MRO_CRISM_OSU); nominal there two are coaligned and offsets of the VNIR FOV
from the optical axis are entirely accounted for in the IK
Graphically, this is:
MRO_SPACECRAFT
|
MRO_CRISM_BASE
|
|<--- gimbal ck
|
|<--- gimbal offset
|
MRO_CRISM_OSU
| |
| MRO_CRISM_IR
|
MRO_CRISM_VNIR
The CRISM frames kernel is
delivered to NAIF and is incorporated into the MRO frames kernel.
2) Instrument kernel (IK). This file describes the
relationship of position of each detector element (at a row or wavelength and
spatial or column position) to a zero position within the field of view.
Nominally, that is in the VNIR row closest to 610 nm or the IR row closest to
2300 nm, at the column position closest to the optical axis. Due to keystone
distortion, there is a different relationship for every row number of either
detector.
The CRISM instrument kernel is delivered to NAIF.
3) Gimbal C kernel. This file gives a time history
of the angle of the gimbal within the gimbal plane, relative to its commanded
nadir. It is constructed from gimbal attitude measurements in image headers,
i.e., from the TAB file part of an EDR.
One file covers a 2-week time span of CRISM data.
CRISM gimbal C kernels are delivered to NAIF.
4) Metakernel. This file gives, for any time span
covered by a gimbal C kernel, the MRO and CRISM SPICE kernels
used to create DDRs for observations occurring during that time period. Note
that kernels are loaded in the order listed., so the highest priority kernel is
listed last.
Browse products are synoptic versions of data products to
help identify products of interest. There are browse products
for EDRs, TRDRs, TERs, MTRDRs, and MRDRs.
There are
two types of products. One is an HTML file that gives the key parameters of the
component EDRs for each observation, and links to PNG files for each EDR in the observation. A detached label to the HTML file describes the observation at
a high level.
The browse product
for each EDR is a scaled (0-255), median DN value from selected wavelengths for
each spatial element in an EDR multiband image, stored in PNG format. The
dimensions of the PNG file, XX pixels in the sample (cross-track) dimension and
YY pixels in the line (along-track) dimension, match the spatial dimensions of
the source EDR. A detached label to the PNG file describes the source EDR and
the scaling between its raw data values and the PNG file.
Figure 3-27 shows an example EDR HTML
browse product, linking to the PNG files for the component EDRs and to all of
the associated labels.
An example set of EDR browse product labels is in Appendix I.
Figure 3-27. Example EDR browse product
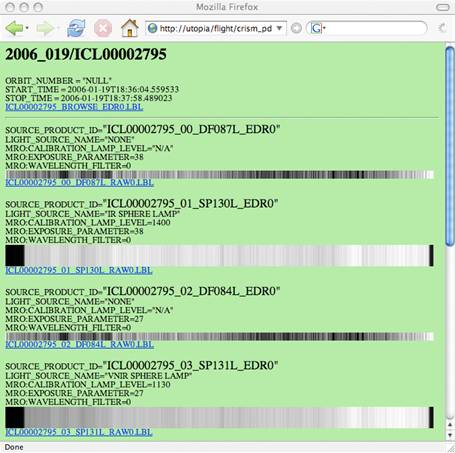
Each hyperspectral targeted (gimbaled) observation TRDR IF
data product has one browse product in a directory structure that parallels
that of the TRDR directory. This is by year and DOY, e.g. /2006/2006_350/, with
subdirectories for each observation named according to the combination of class
type and observation ID unique to a single observation, e.g.
"FRT00001270". Each VNIR (S-detector) TRDR has a TRU browse product
visualization and each IR (L-detector) TRDR has a FAL browse product
visualization (see definitions in sections 3.11.3). As with TER MTRDR browse
products (section 3.11.3), three data files and one detached PDS label file
describing the three files constitutes a single TRDR browse product set. The
three data files are:
1. A .IMG
file which stores the browse image as a 3-band 8-bit raw binary PDS image
object.
2. A .HDR
file which stores ENVI Header information associated with the IMG file. This
file is provided as a convenience to users of the ENVI software and allows the
TRDR browse products to be loaded directly into ENVI.
3. A .PNG
file which stores the 3-band 8-bit browse image in Portable Network Graphics
(PNG) format with an alpha transparency channel that corresponds to the
non-scene edge pixels.
The spatial dimensions of each PNG and IMG file match the
spatial dimensions of the source TRDR.
An MRDR, VRDR, TER, or MTRDR browse product set consists
of three data files and a detached PDS label file. The label file contains the
metadata and pointers to the three data files. The three data files are
1) an IMG file containing the browse product image as a three-band
PDS IMAGE object;
2) a PNG file containing the browse product image in the
Portable Network Graphics file format (three bands and an alpha transparency
channel); and
3) a HDR file associated with the IMG file which stores file
format (and map projection information for MRDRs, VRDRs, and MTRDRs) in the
ENVI header format. This allows users of the ENVI image processing software to readily
read in the image data. The SOURCE_PRODUCT_ID keyword in the PDS label links
the browse products to the source MRDR/VRDR/TER/MTRDR.
There are up to four PNG browse product
images sourced to the VNIR detector and up to thirteen PNG browse product
images sourced to the IR detector. One browse product is constructed from data
from both detectors, if present. The spatial dimensions of each PNG file match
the source MRDR, TER, or MTRDR. The detached PDS label describes the scaling
between the source 32-bit spectral summary parameter data and the byte scaled
data in the IMG and PNG files.
All TER/MTRDR and VRDR browse products (BR) are
constructed from refined spectral summary parameters (SR) calculated for
observations using the revised CRISM spectral summary parameter library [Applicable
Document 11] as described in Appendix P1. All MRDR browse products are
constructed from comparably refined summary product versions of strips of
mapping data from which strip-to-strip residuals are removed using the
optimization process described in Appendix P3. In the byte-scaled browse
products, spectral parameters that sample selected channels (e.g. R770) or
capture spectral slope (e.g. ISLOPE1) or a band ratio (e.g. IRR2) are stretched
according to the scene statistics. All other parameters are stretched according
to meaningful values of the underlying band math calculation and the parameter
distribution both within the product and across the product set.
Note that browse products for MRDRs are not one-for-one
comparable with TER, MTRDR, and VRDR browse products, for reasons having to do
with the component red, green, or blue bands which typically are summary
products. For TERs, MTRDRs, and VRDRs, summary product band math is evaluated
at precise wavelengths of the formulae evaluated using polynomial fits to
multiple channels over the kernel widths summarized in Table 3-12. In contrast
for MRDRs summary product band math is evaluated at the channels present that
are nearest to the wavelengths in the formulae, yielding a non-identical
solution.
1. VNIR Browse Products
1.1 TRU (“True
Color”) is an enhanced natural color representation of the scene composed of
spectral channels across the visible spectrum.
red =
(R600) 600-nm I/F
green
= (R530) 530-nm I/F
blue
= (R440) 440-nm I/F
1.2 VNA (“VNIR Albedo”) shows
I/F at 770 nm (near the typical VNIR peak of the
reflectance spectrum) as a proxy for VNIR albedo and may be used to correlate
spectral variations with morphology. For consistency with the browse product
suite, the single source parameter band is replicated into all three RGB
channels.
red =
(R770) 770-nm I/F
green
= (R770) 770-nm I/F
blue =
(R770) 770-nm I/F
1.3 FEM (“Fe Mineralogy”) shows
information related to iron-bearing minerals and represents the spectral curvature
at the visible and near-infrared wavelengths related to iron.
red =
(BD530_2) 530-nm band depth, highlighting nanophase or crystalline ferric
oxides
green
= (BD600_2) 600-nm shoulder highlighting textural and/or coating effects
blue
= (BDI1000VIS) 1000-nm VNIR band depth highlighting dust-free or more mafic
surfaces
1.4 FM2 (“Fe Mineralogy, Version
2”) shows complementary information related to Fe minerals and is particularly
sensitive to olivine and pyroxene, as well as nanophase ferric oxide and
crystalline ferric or ferrous minerals.
red =
(BD530) 530-nm band depth indicating the presence of nanophase ferric oxides
green
= (BD920) 920-nm band depth highlighting coarser-grained ferric minerals
or low-Ca pyroxene
blue
= (BDI1000VIS) 1000-nm VNIR band depth highlighting dust-free or more mafic
surfaces
2.
IR Browse Products
2.1 FAL
(“False Color”) is an enhanced infrared false color representation of the scene
with the constituent wavelengths chosen to highlight differences between key
mineral groups. Red to orange coloration is typically characteristic of
olivine-rich for Fe-phyllosilicate-rich material, blue/green colors is often
indicative of clay mineralogy, green colors may indicate carbonate, and
gray/brown colors often indicate basaltic material.
red =
(R2529) 2529-nm I/F
green
= (R1506) 1506-nm I/F
blue
= (R1080) 1080-nm I/F
2.2 IRA (“IR Albedo”) shows I/F
at 1330 nm as a proxy for IR albedo and may be used
to correlate spectral variations with morphology. For consistency with the
browse product suite, the single source parameter band is replicated into all
three RGB channels.
red =
(R1330) 1330-nm I/F
green
= (R1330) 1330-nm I/F
blue =
(R1330) 1330-nm I/F
2.3 MAF (“Mafic
Mineralogy”) shows information related to mafic mineralogy. Olivine and
Fe-phyllosilicate share a 1000-1700 nm bowl-shaped absorption and will appear
red in the MAF browse product. Low- and high-Ca pyroxene display an additional
~2000-nm absorption and appear green/cyan and blue/magenta.
red =
(OLINDEX3) Spectral index keyed to fayalitic olivine (also highlights iron-bearing
phyllosilicates)
green
= (LCPINDEX2) Spectral index keyed to low-Ca pyroxene
blue
= (HCPINDEX2) Spectral index keyed to high-Ca pyroxene
2.4 HYD (“Hydrated
Mineralogy”) shows information related to bound water in minerals. Polyhydrated
sulfates have strong 1900 nm and 2400 nm absorption bands, and thus appear
magenta in the HYD browse product. Monohydrated sulfates have a strong 2100 nm
absorption and a weak 2400 nm absorption band, and thus appear yellow/green in
the HYD browse product. Blue colors are indicative of other hydrated minerals
(such as clays, glass, carbonate, or zeolite).
red = (SINDEX2)
Spectral index keyed to bound water bands indicative of hydrated
sulfates
green
= (BD2100_2) 2100-nm band depth attributable to a shifted H2O
band exhibited by monohydrated sulfates
blue =
(BD1900_2) 1900-nm band depth attributable to bound molecular H2O
2.5 PHY (“Phyllosilicates”) shows information related to
hydroxylated minerals including phyllosilicate. Fe/Mg-OH bearing minerals
(e.g., Fe/Mg-phyllosilicate) will appear red, or magenta (when hydrated).
Al/Si-OH bearing minerals (e.g., Al-phyllosilicates or hydrated silica) will
appear green, or cyan (when hydrated). Blue colors are indicative of other hydrated
minerals (such as sulfates, glass, carbonate, or water ice).
red = (D2300)
2300-nm spectral drop-off associated with Fe/Mg phyllosilicate or Mg-carbonate
green
= (D2200) 2200-nm spectral drop-off associated with Al-phyllosilicate or
hydrated silica
blue =
(BD1900R2) 1900-nm band depth attributable to bound molecular H2O
2.6 PFM (“Phyllosilicate
with Fe and Mg”) shows information related to the cation composition of
hydroxylated minerals including Fe/Mg-phyllosilicate. Red/yellow colors
indicate the presence of prehnite, chlorite, epidote, or Ca/Fe carbonate, while
cyan colors indicate the presence of Fe/Mg-smectites or Mg-carbonate.
red = (BD2355)
2355-nm band depth indicating the presence of prehnite,
chlorite, epidote, or Ca/Fe carbonate
green
= (D2300) 2300-nm spectral drop-off associated with Fe/Mg phyllosilicate or Mg-carbonate
blue =
(BD2290) 2290-nm band depth consistent with an
Mg- or Fe- OH cation-hydroxl absorption
2.7 PAL
(“Phyllosilicate with Al”) shows information related to the cation composition
of hydroxylated minerals including Al-phyllosilicate and hydrated silica. Red/yellow
colors indicate the presence of Al-smectites or hydrated silica, cyan colors
may indicate the alunite, and light/white colors indicate the presence of
kaolinite group minerals.
red = (BD2210_2)
2210-nm band depth consistent with an Al-OH
cation-hydroxl absorption
green
= (BD2190) 2190-nm band depth
blue =
(BD2165) 2165-nm band depth consistent with Al-OH structure in Kaolininte-group
minerals.
2.8 HYS (“Hydrated
Silica”) shows information related to Si/Al-hydroxylated minerals that can be
used to differentiate between hydrated silica and Al-phyllosilicates. Light
red/yellow colors indicate the presence of hydrated silica, whereas cyan colors
indicate Al-OH minerals. Additionally, jarosite will appear yellow. Blue
colors are indicative of other hydrated minerals (such as sulfates, clays,
glass, carbonate, or water ice).
red = (MIN2250)
Minimum band depth of paired 2210-nm and 2260-nm Si-OH features
green
= BD2250 2250-nm band depth consistent with Al-OH and Si-OH
cation-hydroxyl
blue =
(BD1900R2) 1900-nm band depth attributable to bound molecular H2O
2.9 ICE (“Ices”)
shows information related to water or carbon dioxide frost or ice. CO2
frost or ice displays a sharp 1435-nm absorption and thus appears blue in the
ICE browse product. Water ice or frost has a strong 1500 nm absorption and thus
appears green in the ICE browse product. Red colors are indicative of
hydrated minerals (such as sulfates, clays, glass, carbonate, or water ice).
red = (BD1900_2)
1900-nm band depth attributable to bound molecular H2O
green
= (BD1500_2) 1500-nm band depth diagnostic of H2O
ice
blue =
(BD1435) 1435-nm band depth diagnostic of CO2
ice
2.10 IC2 (“Ices,
Version 2”) shows complementary information related to water or carbon dioxide
frost or ice. CO2 frost or ice displays a sharp 1435-nm absorption
and thus appears blue in the IC2 browse product. Water ice or frost has a
strong 1500 nm absorption and thus appears green in the IC2 browse product.
The 3920-nm spectral channel is a discriminator for icy vs. ice-free
material with ices having a lower solar reflected and thermal emission radiance
at this wavelength.
red = (R3920)
3920-nm I/F highlighting comparatively warm ice-free surfaces
green
= (BD1500_2) 1500-nm band depth diagnostic of H2O
ice
blue =
(BD1435) 1435-nm band depth diagnostic of CO2
ice
2.11 CHL (“Chloride”)
shows information related to inferred chloride deposits in THEMIS DCS glowing
terrain and spatially associated hydrated mineral deposits. The chloride material
has a relatively positive near-infrared spectral slope and is comparatively
desiccated, so appears blue in the CHL browse product. Yellow/green colors are indicative
of hydrated minerals, especially phyllosilicates.
red = (ISLOPE1)
spectral slope over the 1815-nm to 2530-nm interval
green
= (BD3000) 3000-nm band depth attributable to bound H2O
blue =
(IRR2) 2530-nm to 2210-nm spectral ratio
2.12 CAR (“Carbonates”)
shows information related to Mg carbonate minerals. Blueish- or yellowish-white
colors indicate Mg-carbonate, while red/magenta colors indicate
Fe/Mg-phyllosilicate. Blue colors are indicative of other hydrated minerals
(such as sulfates, clays, glass, or carbonate).
red = (D2300)
2300-nm spectral drop-off associated with Fe/Mg phyllosilicate or Mg-carbonate
green
= (BD2500H) 2500-nm band depth corresponding to an Mg-carbonate overtone
blue =
= (BD1900_2) 1900-nm band depth attributable to bound molecular H2O
2.13 CR2 (“Carbonates,
Version 2”) shows information distinguishing carbonate minerals. Red/magenta
colors indicate Mg-carbonates, while green/cyan colors indicate
Fe/Ca-carbonates.
red = (MIN2295_2480) Minimum
band depth of paired 2295-nm and 2480-nm Mg-carbonate overtone features
green = (MIN2345_2537) Minimum
band depth of paired 2345-nm and 2537-nm Ca/Fe-carbonate overtone features
blue =
(CINDEX2) Spectral index keyed to ~3400-nm and ~3900-nm carbonate
spectral features.
3. Joined
(VNIR and IR) Browse Products
3.1 TAN (“Tandem”)
shows an enhanced visible to infrared false color representation of the scene,
incorporating spectral data from both (VNIR and IR) detectors. This is the
designated browse product visualization for the TER/MTR IF data products.
red = (R2529)
2529-nm I/F
green
= (R1330) 1330-nm I/F
blue =
(R770) 770-nm I/F
Example TER and MTRDR browse product labels are provided in Appendix J. An example set of MRDR browse product labels is in Appendix K.
See section 3.10.1 in Applicable Document [5] for
descriptions of the potential products in this directory.
In the Observation Tracking Table (OTT) directory, only the
OBS_ID table is regularly generated. It provides a synopsis of the disposition
and quality of CRISM observations that have actually been commanded to the
instrument. Its contents are described in Table 3-28. There is one row per
commanded EDR.
Table 3-27. Contents of OBS_ID
Table.
|
Information
|
Description
|
|
REQUEST_ID
|
May be null if it is not
site-related, such as calibration or functional test (class = FUN or CAL).
|
|
PARTICIPATING_INSTRUMENTS
|
Any combination of the
characters CHX to indicate instruments planning to participate.
|
|
COORDINATED_TARGET
|
1 if true
|
|
MEP_TARGET
|
1 if true
|
|
RIDEALONG
|
1 if true
|
|
OBSERVATION_ID
|
8-byte hexadecimal integer,
if in integrated target list.
|
|
OBSERVATION_TYPE
|
FRT, HRL, HRS, FRS, ATO,
ATU, EPF, TOD, MSW, MSP, HSP, HSV, MSV, CAL, FFC, ICL, or FUN
|
|
ACTIVITY_ID
|
AC### where AC is a
2-letter designation of the type of measurement made, and ### as a 3-numeral
designation of the instrument command macro that was executed to acquire the
data. Macro numbers are in the range
0-255. BI is measurement of detector bias, DF is a measurement of background
including dark current and thermal background, LP is measurement of a focal
plane lamp, SP is measurement of the internal integrating
sphere, and SC is measurement of an
external scene. TP indicates that the EDR contains any test pattern produced by instrument electronics. T1 through T7 specify the
test pattern, test pattern 1 through test pattern 7. UN indicates data in
which housekeeping does not match the commanded instrument
configuration.
|
|
PLAN_OBSERVATION_NUMBER
|
Monotonically increasing
ordinal counter of the EDRs generated from one spectrometer for a single
OBSERVATION_ID.
|
|
PLAN_SENSOR_ID
|
Spectrometer identifier. 0
= IR; 1 = VNIR.
|
|
PLAN_LINES
|
Number of frames
|
|
PLAN_BANDS
|
Number of wavelengths
|
|
PLAN_BINNING
|
Spatial pixel binning mode; specified separately for each detector; 0 =
1:1; 1 = 2:1; 2 = 5:1; 3 = 10:1
|
|
PLAN_RATE
|
Rate of frame acquisition;
0 = 1 Hz; 1 = 3.75 Hz; 2 = 5 Hz; 3 = 15 Hz; 4 = 30 Hz; specified separately
for each detector
|
|
PLAN_EXPOSURE_ PARAMETER
|
At a given frame rate there
are 480 possible exposure times ranging from 1 to 480. An exposure parameter
of 480 yields an exposure time equal to the inverse of the frame rate. An
exposure time parameter of 1 yields an exposure time 1/480 as large.
|
|
PLAN_SHUTTER_POS
|
Shutter position from 0 to 32; nominal open is 3; viewing
sphere is 17; closed is 32.
|
|
PLAN_FILTER
|
Wavelength filter table;
which of uploadable tables 0-3; specified separately for each detector
|
|
PLAN_FAST
|
Lossless Fast compression enabled or disabled; specified separately for
each detector; 0 = disabled; 1 = enabled
|
|
PLAN_LOSSY
|
Lossy compression enabled or disabled; 12 to 8 bit look-up table
commanded line by line in uploaded data structure; specified separately for
each detector; 0 = disabled; 1 = enabled
|
|
PLAN_IR_FLOOD1_PWR
|
IR flood lamp 1 power (IR); 0 = off; 1 = on.
|
|
PLAN_IR_FLOOD1_LEVEL
|
IR flood lamp 1 level 0-4095.
|
|
PLAN_IR_FLOOD2_PWR
|
IR flood lamp 2 power (IR); 0 = off; 1 = on.
|
|
PLAN_IR_FLOOD2_LEVEL
|
IR flood lamp 2 level 0-4095.
|
|
PLAN_IR_SPHERE_PWR
|
IR sphere lamp power; 0 = off; 1 =
on.
|
|
PLAN_IR_SPHERE_GOAL
|
Closed-loop goal, 0-4095.
|
|
PLAN_VNIR_FLOOD1_PWR
|
VNIR flood lamp 1 power (VNIR); 0 = off; 1 = on.
|
|
PLAN_VNIR_FLOOD1_LEVEL
|
VNIR flood lamp 1 level 0-4095.
|
|
PLAN_VNIR_FLOOD2_PWR
|
VNIR flood lamp 2 power (VNIR); 0 = off; 1 = on.
|
|
PLAN_VNIR_FLOOD2_LEVEL
|
VNIR flood lamp 2 level 0-4095.
|
|
PLAN_VNIR_SPHERE_PWR
|
VNIR sphere lamp power; 0
= off; 1 = on.
|
|
PLAN_VNIR_SPHERE_GOAL
|
Closed-loop goal, 0-4095.
|
|
PLAN_COMPRESSION_RATIO
|
Compression ratio used to model data volume.
|
|
|
yyyy-mm-ddThh:mm:ss.sss,
ISO UTC time format
|
|
PLAN_START_TIME
|
yyyy-mm-ddThh:mm:ss.sss,
ISO UTC time format
|
|
PLAN_STOP_TIME
|
yyyy-mm-ddThh:mm:ss.sss,
ISO UTC time format
|
|
PLAN_LOWER_RIGHT_ LATITUDE
|
Planned latitude of the
surface point at the edge of the FOV on the antisunward (right-hand) side of
the groundtrack at the observation start.
|
|
PLAN_LOWER_RIGHT_ LONGITUDE
|
Planned longitude of the
surface point at the edge of the FOV on the antisunward (right-hand) side of
the groundtrack at the observation start.
|
|
PLAN_LOWER_LEFT_ LATITUDE
|
Planned latitude of the
surface point at the edge of the FOV on the sunward (left-hand) side of the
groundtrack at the observation start.
|
|
PLAN_LOWER_LEFT_ LONGITUDE
|
Planned longitude of the
surface point at the edge of the FOV on the sunward (left-hand) side of the
groundtrack at the observation start.
|
|
PLAN_UPPER_RIGHT_ LATITUDE
|
Planned latitude of the
surface point at the edge of the FOV on the antisunward (right-hand) side of
the groundtrack at the observation end.
|
|
PLAN_UPPER_RIGHT_ LONGITUDE
|
Planned longitude of the
surface point at the edge of the FOV on the antisunward (right-hand) side of
the groundtrack at the observation end.
|
|
PLAN_UPPER_LEFT_ LATITUDE
|
Planned latitude of the
surface point at the edge of the FOV on the sunward (left-hand) side of the
groundtrack at the observation end.
|
|
PLAN_UPPER_LEFT_ LONGITUDE
|
Planned longitude of the
surface point at the edge of the FOV on the sunward (left-hand) side of the
groundtrack at the observation end.
|
|
RECEIPT
|
Received on ground; 0 = no,
1 = partially received with no gap filled, 2 = partially received with gap
filled, 3 = received.
|
|
PRODUCT_ID
|
CCCNNNNNNNN_XX_AAAAAS_EDRV
where CCC = OBSERVATION_TYPE, NNNNNNNN = OBSERVATION_ID as a hexadecimal
number, XX = OBSERVATION_NUMBER, AAAAA = ACTIVITY_ID, S = SENSOR_ID S or L, V
= Product version number
|
|
ENCODING_COMPRESSION_RATIO
|
Actual compression ratio of data.
|
|
CLOSEST_APPROACH_ TIME
|
yyyy-mm-ddThh:mm:ss.sss,
ISO UTC time format
|
|
START_TIME
|
yyyy-mm-ddThh:mm:ss.sss,
ISO UTC time format
|
|
STOP_TIME
|
yyyy-mm-ddThh:mm:ss.sss,
ISO UTC time format
|
|
LOWER_RIGHT_LATITUDE
|
Actual latitude of the
surface point at the edge of the FOV on the antisunward (right-hand) side of
the groundtrack at the observation start.
|
|
LOWER_RIGHT_LONGITUDE
|
Actual longitude of the
surface point at the edge of the FOV on the antisunward (right-hand) side of
the groundtrack at the observation start.
|
|
LOWER_LEFT_LATITUDE
|
Actual latitude of the
surface point at the edge of the FOV on the sunward (left-hand) side of the
groundtrack at the observation start.
|
|
LOWER_LEFT_LONGITUDE
|
Actual longitude of the
surface point at the edge of the FOV on the sunward (left-hand) side of the
groundtrack at the observation start.
|
|
UPPER_RIGHT_LATITUDE
|
Actual latitude of the
surface point at the edge of the FOV on the antisunward (right-hand) side of
the groundtrack at the observation end.
|
|
UPPER_RIGHT_LONGITUDE
|
Actual longitude of the
surface point at the edge of the FOV on the antisunward (right-hand) side of
the groundtrack at the observation end.
|
|
UPPER_LEFT_LATITUDE
|
Actual latitude of the
surface point at the edge of the FOV on the sunward (left-hand) side of the
groundtrack at the observation end.
|
|
UPPER_LEFT_LONGITUDE
|
Actual longitude of the
surface point at the edge of the FOV on the sunward (left-hand) side of the
groundtrack at the observation end.
|
|
DATA_QUALITY_INDEX
|
See description in section
2.5.2
|
|
FILE_SPECIFICATION_NAME
|
Pathname of image EDR in data directory, e.g.,
EDR/2006_350/FRT00001270/FRT00001270_01_SC001S_EDR0.IMG
|
|
LINES
|
Number of frames
|
|
COMMENT
|
Text string describing
nature of observation
|
The TRDR EXTRAS visualizations are Portable Network
Graphics (PNG) format files that depict the geometry and structure of CRISM
hyperspectral targeted observations. The TRDR detector specific visualizations
have file names with the form [Class Type][Target ID]_[Sensor]_[Name].PNG where
[Class Type] is a three letter observation type code (e.g. FRT, HRL, HRS),
[Target ID] is an eight character hexadecimal observation identifier, [Sensor]
is a single character indicating the VNIR (S-detector) or IR (L-detector)
wavelength range, and [Name] indicates the plot contents.
See section 3.10.2 in Applicable Document [5] for
descriptions of the products in this directory.
See section 3.10.3 in Applicable Document [5] for
descriptions of the products in this directory. Examples of TER and MTR Extras
products are detailed in this document in Appendix P2.
To facilitate timely and consistent analysis of CRISM
data, the CRISM Analysis Tool (CAT) has been developed and provided to the
community shortly after MRO’s orbital mission began. CAT is based on the
commercially available ENVI software package which requires IDL to run. A
companion software package with lesser functionality, JCAT, does not require
ENVI or IDL, and was developed and made available in 2019.
The CRISM Team has also developed a spectral library of
well-characterized Mars analog materials, measured under dry N2-purged
conditions over CRISM's wavelength range and convolved with the CRISM's slit
function. This special measurement environment is necessary because many
lithologies of interest adsorb water strongly and under ambient conditions are
spectrally dissimilar to their state on Mars. In 2014, a companion set of Mars
type spectra of various phases. The spectral libraries are found at Applicable
Documents [11] and [12].
CAT, JCAT, and the spectral libraries are available at the
PDS Geosciences Node web site https://pds-geosciences.wustl.edu/missions/mro/crism.htm,
along with tutorial information to operate the CAT.
Key data-reduction and management capabilities of the
CRISM analysis tool (CAT) include:
§
The CAT has the ability to read EDRs, TRDRs, DDRs, MRDRs, VRDRs, CDRs,
TERs and MTRDRs.
§
The CAT has the ability to map-project data following the
conventions given in section 3.4.2.
§
The CAT has the ability to access the SOC and to download and
apply current CDRs for correction of atmospheric and photometric effects.
§
The CAT has the ability to create site-specific browse products.
§
The CAT also has the ability to apply all of the extensive
analysis capabilities already built into ENVI, including classification (e.g.
spectral angle mapping), mixture modeling, principal components analysis, and
techniques that use the spectral library as input.
PDS-labeled images and tables can be viewed with the
program NASAView, developed by the PDS and available for a variety of computer
platforms from the PDS web site http://pds.nasa.gov/tools.
PDS_VERSION_ID
= PDS3
LABEL_REVISION_NOTE
= "2003-11-19, S. Slavney (GEO);
2005-02-01, C. Hash (ACT);
2006-01-04, C. Hash (ACT);"
/* EDR
Identification */
DATA_SET_ID
= "MRO-M-CRISM-2-EDR-V1.0"
PRODUCT_ID
= "FRT00004ECA_07_SC166L_EDR0"
/*
cccnnnnnnnn_xx_ooaaas_EDRv */
/* ccc
= Class Type */
/*
nnnnnnnn = Observation ID (hex) */
/* xx =
counter within observation (hex) */
/*
ooaaa = obs type, macro number */
/* s =
sensor ID (S or L) */
/* v =
version number */
INSTRUMENT_HOST_NAME
= "MARS RECONNAISSANCE ORBITER"
SPACECRAFT_ID
= MRO
INSTRUMENT_NAME
= "COMPACT RECONNAISSANCE IMAGING
SPECTROMETER FOR MARS"
INSTRUMENT_ID
= CRISM
TARGET_NAME
= MARS
PRODUCT_TYPE
= EDR
PRODUCT_CREATION_TIME
= 2007-04-06T16:41:28
START_TIME
= 2007-03-23T03:02:31.910417
STOP_TIME
= 2007-03-23T03:04:39.644669
SPACECRAFT_CLOCK_START_COUNT
= "2/0859086170.55396"
SPACECRAFT_CLOCK_STOP_COUNT
= "2/0859086298.37980"
ORBIT_NUMBER
= "NULL"
OBSERVATION_TYPE
= "FRT"
OBSERVATION_ID
= "16#00004ECA#"
MRO:OBSERVATION_NUMBER
= 16#07#
MRO:ACTIVITY_ID
= "SC166"
MRO:SENSOR_ID
= "L"
PRODUCT_VERSION_ID
= "0"
PRODUCER_INSTITUTION_NAME
= "JOHNS HOPKINS UNIVERSITY
APPLIED PHYSICS LABORATORY"
SOFTWARE_NAME
= "pipe_edrslice"
SOFTWARE_VERSION_ID
= "4.3"
/* EDR
Instrument and Observation Parameters */
/* for
first frame */
TARGET_CENTER_DISTANCE
= NULL <KM>
SOLAR_DISTANCE
= NULL <KM>
SHUTTER_MODE_ID
= OPEN
LIGHT_SOURCE_NAME
= "NONE"
MRO:CALIBRATION_LAMP_STATUS
= "OFF"
MRO:CALIBRATION_LAMP_LEVEL
= "N/A"
PIXEL_AVERAGING_WIDTH
= 1
MRO:INSTRUMENT_POINTING_MODE
= "DYNAMIC POINTING"
SCAN_MODE_ID
= SHORT
MRO:FRAME_RATE
= 3.75 <HZ>
MRO:EXPOSURE_PARAMETER
= 301
SAMPLING_MODE_ID
= "HYPERSPEC"
COMPRESSION_TYPE
= "NONE"
MRO:WAVELENGTH_FILTER
= 0
MRO:WAVELENGTH_FILE_NAME
= "CDR6_1_0000000000_WV_L_1.TAB"
MRO:PIXEL_PROC_FILE_NAME
= "CDR6_1_0000000000_PP_L_1.TAB"
MRO:LOOKUP_TABLE_FILE_NAME
= "CDR6_1_0000000000_LK_J_0.TAB"
/* This
EDR label describes two data files. The first file contains */
/* the
first two objects and the second file contains the third: */
/* 1.
A multiple-band image file containing uncalibrated EDR data, */
/* 2.
A binary table of selected image row numbers from detector, */
/* 3.
A table of ancillary and housekeeping data. */
/*
Description of EDR IMAGE file */
OBJECT
= FILE
^IMAGE = "FRT00004ECA_07_SC166L_EDR0.IMG"
^ROWNUM_TABLE = ("FRT00004ECA_07_SC166L_EDR0.IMG", 210241)
RECORD_TYPE = FIXED_LENGTH
RECORD_BYTES = 1280
FILE_RECORDS = 210241
OBJECT = IMAGE
LINES = 480
LINE_SAMPLES = 640
SAMPLE_TYPE = MSB_UNSIGNED_INTEGER
SAMPLE_BITS = 16
BANDS = 438
BAND_STORAGE_TYPE = LINE_INTERLEAVED
MISSING_CONSTANT = 65535
CHECKSUM = "NULL"
END_OBJECT = IMAGE
OBJECT = ROWNUM_TABLE
NAME = "SELECTED ROWS FROM DETECTOR"
INTERCHANGE_FORMAT = "BINARY"
ROWS = 438
COLUMNS = 1
ROW_BYTES = 2
DESCRIPTION = "The detector is subsampled in the spectral direction
by selecting specific rows to be downlinked. This
table provides a list of the rows selected for all
frames in this multidimensional image cube."
OBJECT = COLUMN
NAME = DETECTOR_ROW_NUMBER
DATA_TYPE = MSB_UNSIGNED_INTEGER
BIT_MASK = 2#0000000111111111#
START_BYTE = 1
BYTES = 2
MISSING_CONSTANT = 65535
DESCRIPTION = "Detector row number from which the data was
taken."
END_OBJECT = COLUMN
END_OBJECT = ROWNUM_TABLE
END_OBJECT
= FILE
/*
Description of EDR HOUSEKEEPING TABLE file */
OBJECT
= FILE
^EDR_HK_TABLE = "FRT00004ECA_07_SC166L_HKP0.TAB"
RECORD_TYPE = FIXED_LENGTH
RECORD_BYTES = 1038
FILE_RECORDS = 480
OBJECT = EDR_HK_TABLE
NAME = "EDR HOUSEKEEPING TABLE"
INTERCHANGE_FORMAT = "ASCII"
ROWS = 480
COLUMNS = 233
ROW_BYTES = 1038
/*
Columns in the table are described in this external file: */
^STRUCTURE = "EDRHK.FMT"
END_OBJECT = EDR_HK_TABLE
END_OBJECT
= FILE
END
PDS_VERSION_ID
= PDS3
LABEL_REVISION_NOTE
= "2004-11-22, S. Slavney (GEO);
2006-04-05, S. Murchie (JHU/APL);"
/* DDR
Identification */
DATA_SET_ID
= "MRO-M-CRISM-6-DDR-V1.0"
PRODUCT_ID
= "FRT00004ECA_07_DE166L_DDR1"
/*
cccnnnnnnnn_xx_ooaaas_DDRv */
/* ccc
= Class Type */
/*
nnnnnnnn = Observation ID (hex) */
/* xx =
counter this observation (hex) */
/*
ooaaa = obs type, macro number */
/* s =
sensor ID (S or L) */
/* v =
version number */
INSTRUMENT_HOST_NAME
= "MARS RECONNAISSANCE ORBITER"
SPACECRAFT_ID
= MRO
INSTRUMENT_NAME
= "COMPACT RECONNAISSANCE IMAGING
SPECTROMETER FOR MARS"
INSTRUMENT_ID
= CRISM
TARGET_NAME
= MARS
PRODUCT_TYPE
= DDR
PRODUCT_CREATION_TIME
= 2007-04-07T07:48:44
START_TIME
= 2007-03-23T03:02:31.499
STOP_TIME
= 2007-03-23T03:04:39.233
SPACECRAFT_CLOCK_START_COUNT
= "2/859086170:55396"
SPACECRAFT_CLOCK_STOP_COUNT
= "2/859086298:37980"
ORBIT_NUMBER
= 0
OBSERVATION_TYPE
= "FRT"
OBSERVATION_ID
= "16#00004ECA#"
MRO:OBSERVATION_NUMBER
= 16#07#
MRO:ACTIVITY_ID
= "DE166"
MRO:SENSOR_ID
= "L"
PRODUCT_VERSION_ID
= "1"
SOURCE_PRODUCT_ID
= {
"MRO_SCLKSCET.00021.65536.tsc",
"mro_v08.tf",
"MRO_CRISM_FK_0000_000_N_1.TF",
"MRO_CRISM_IK_0000_000_N_1.TI",
"naif0008.tls",
"pck00008.tpc",
"mro_sc_psp_070313_070319.bc",
"mro_sc_psp_070320_070326.bc",
"mro_sc_2007-03-27.bc",
"mro_sc_2007-03-28.bc",
"spck_2007_081_r_1.bc",
"spck_2007_082_r_1.bc",
"spck_2007_083_r_1.bc",
"spck_2007_084_r_1.bc",
"spck_2007_085_r_1.bc",
"spck_2007_086_r_1.bc",
"de410.bsp",
"mro_cruise.bsp",
"mro_ab.bsp",
"mro_psp.bsp",
"mro_psp_rec.bsp"
}
PRODUCER_INSTITUTION_NAME
= "APPLIED PHYSICS LABORATORY"
SOFTWARE_NAME
= "crism_ddr"
SOFTWARE_VERSION_ID
= "1.9"
/* DDR
Instrument and Observation Parameters */
TARGET_CENTER_DISTANCE
= 3675.164588 <KM>
/* distance to Mars center at first frame */
SOLAR_DISTANCE
= 212137794.935710 <KM>
SOLAR_LONGITUDE
= 205.303815 <DEGREES>
MRO:FRAME_RATE
= 3.75 <HZ>
PIXEL_AVERAGING_WIDTH
= 1
MRO:INSTRUMENT_POINTING_MODE
= "DYNAMIC POINTING"
SCAN_MODE_ID
= "LONG"
/* This
DDR label describes one data file: */
/* 1. A
multiple-band backplane image file with wavelength-independent, */
/*
spatial pixel-dependent geometric and timing information. */
/* See
the CRISM Data Products SIS for more detailed description. */
OBJECT
= FILE
^IMAGE = "FRT00004ECA_07_DE166L_DDR1.IMG"
RECORD_TYPE = FIXED_LENGTH
RECORD_BYTES = 2560
FILE_RECORDS = 6720
OBJECT = IMAGE
LINES = 480
LINE_SAMPLES = 640
SAMPLE_TYPE = PC_REAL
SAMPLE_BITS = 32
BANDS = 14
BAND_STORAGE_TYPE = BAND_SEQUENTIAL
BAND_NAME = ("INA at areoid, deg",
"EMA at areoid, deg",
"Phase angle, deg",
"Latitude, areocentric, deg N",
"Longitude, areocentric, deg E",
"INA at surface from MOLA, deg",
"EMA at surface from MOLA, deg",
"Slope magnitude from MOLA, deg",
"MOLA slope azimuth, deg clkwise from N",
"Elevation, meters relative to MOLA",
"Thermal inertia, J m^-2 K^-1 s^-0.5",
"Bolometic albedo",
"Local solar time, hours",
"Spare")
END_OBJECT = IMAGE
END_OBJECT
= FILE
END
PDS_VERSION_ID
= PDS3
LABEL_REVISION_NOTE
= "2004-11-22, S. Slavney (GEO);
2005-12-20, H. Taylor (JHU/APL);
2006-04-05, S. Murchie (JHU/APL);
2006-09-18, P. Cavender (JHU/APL);
2007-04-30, P. Cavender (JHU/APL);
Version 1, Improved SS CDRs and
added post-processing bad pixel
correction
2007-09-13, D. Humm (JHU/APL);
Version 2, Improved calibration
motivated by Deimos observation
2010-06-01, D. Humm (JHU/APL);
Version 3, shutter mirror correction
and other calibration tweaks
2010-10-12, C. Hash (ACT);
Version 3, Added data filter control
parameters"
DATA_SET_ID
= "MRO-M-CRISM-3-RDR-TARGETED-V1.0"
PRODUCT_ID
= "FRT00004ECA_07_RA166L_TRR3"
/*
cccnnnnnnnn_xx_ooaaas_TRRv */
/* ccc
= Class Type */
/*
nnnnnnnn = Observation ID, hexadecimal */
/*
ooaaa = Image type, Macro number */
/* s =
Sensor ID (S or L) */
/* v =
Version number */
INSTRUMENT_HOST_NAME
= "MARS RECONNAISSANCE ORBITER"
SPACECRAFT_ID
= MRO
INSTRUMENT_NAME
= "COMPACT RECONNAISSANCE IMAGING
SPECTROMETER FOR MARS"
INSTRUMENT_ID
= CRISM
TARGET_NAME
= MARS
PRODUCT_TYPE
= TARGETED_RDR
PRODUCT_CREATION_TIME
= 2010-11-09T00:34:29
START_TIME
= 2007-03-23T03:02:31.499
STOP_TIME
= 2007-03-23T03:04:39.233
SPACECRAFT_CLOCK_START_COUNT
= "2/0859086170.55396"
SPACECRAFT_CLOCK_STOP_COUNT
= "2/0859086298.37980"
ORBIT_NUMBER
= "NULL"
OBSERVATION_TYPE
= "FRT"
OBSERVATION_ID
= "16#00004ECA#"
MRO:OBSERVATION_NUMBER
= 16#07#
MRO:ACTIVITY_ID
= "RA166"
MRO:SENSOR_ID
= "L"
MRO:DETECTOR_TEMPERATURE
= -165.838
MRO:OPTICAL_BENCH_TEMPERATURE
= -48.411
MRO:SPECTROMETER_HOUSING_TEMP
= -72.699
MRO:SPHERE_TEMPERATURE
= -48.064
MRO:FPE_TEMPERATURE
= 0.812
PRODUCT_VERSION_ID
= "3"
SOURCE_PRODUCT_ID
= {
"CDR410000000000_DM0000000L_3",
"CDR410000000000_LL0000000L_4",
"CDR410000000000_SH0000001L_4",
"CDR410000000000_SS0000001L_6",
"CDR410000000000_TD0000000S_2",
"CDR410803692813_SF0000000L_4",
"CDR420847411200_NU1000001L_5",
"CDR420859086160_BK1030100L_3",
"CDR420859086162_BP1000000L_3",
"CDR420859086162_UB1030100L_3",
"CDR420859086234_BP1000000L_3",
"CDR420859086302_BK1030100L_3",
"CDR420859086303_BP1000000L_3",
"CDR420859086303_UB1030100L_3",
"CDR420859087293_BK0003800L_3",
"CDR420859087299_UB0003800L_3",
"CDR420859087333_SP0003801L_3",
"CDR420859087333_SP0042501S_3",
"CDR420859087355_BK0003800L_3",
"CDR420859087361_UB0003800L_3",
"CDR420859127820_BI1000000L_3",
"CDR420861470430_BI0000000L_3",
"CDR6_1_0000000000_AS_L_0",
"CDR6_1_0000000000_BS_L_0",
"CDR6_1_0000000000_DB_L_0",
"CDR6_1_0000000000_EB_L_0",
"CDR6_1_0000000000_GH_L_2",
"CDR6_1_0000000000_HD_J_1",
"CDR6_1_0000000000_HK_J_1",
"CDR6_1_0000000000_HV_J_1",
"CDR6_1_0000000000_LC_L_1",
"CDR6_1_0000000000_LI_J_0",
"CDR6_1_0000000000_VL_L_0",
"CDR6_2_0835294537_PP_L_0",
"CDR6_2_0859075219_ST_J_0",
"FRT00004ECA_07_SC166L_EDR0"
}
MRO:INVALID_PIXEL_LOCATION
= {
}
PRODUCER_INSTITUTION_NAME
= "JOHNS HOPKINS UNIVERSITY
APPLIED PHYSICS LABORATORY"
SOFTWARE_NAME
= "crism_imagecal"
SOFTWARE_VERSION_ID
= "2.5.3"
/*
Targeted RDR Instrument and Observation Parameters */
TARGET_CENTER_DISTANCE
= "NULL" <KM>
SOLAR_DISTANCE
= 212139419.063420 <KM>
SOLAR_LONGITUDE
= 205.304261
SHUTTER_MODE_ID
= "OPEN"
LIGHT_SOURCE_NAME
= "NONE"
MRO:CALIBRATION_LAMP_STATUS
= "OFF"
MRO:CALIBRATION_LAMP_LEVEL
= "N/A"
PIXEL_AVERAGING_WIDTH
= 1
MRO:INSTRUMENT_POINTING_MODE
= "DYNAMIC POINTING"
SCAN_MODE_ID
= "SHORT"
MRO:FRAME_RATE
= 3.75 <HZ>
MRO:EXPOSURE_PARAMETER
= 301
SAMPLING_MODE_ID
= "HYPERSPEC"
COMPRESSION_TYPE
= "NONE"
MRO:WAVELENGTH_FILTER
= "0"
MRO:WAVELENGTH_FILE_NAME
= "CDR410803692813_WA0000000L_3.IMG"
MRO:PIXEL_PROC_FILE_NAME
= "CDR6_2_0835294537_PP_L_0.TAB"
MRO:INV_LOOKUP_TABLE_FILE_NAME
= "CDR6_1_0000000000_LI_J_0.TAB"
MRO:ATMO_CORRECTION_FLAG
= "OFF"
MRO:THERMAL_CORRECTION_MODE
= "OFF"
MRO:PHOTOCLIN_CORRECTION_FLAG
= "OFF"
MRO:SPATIAL_RESAMPLING_FLAG
= "OFF"
MRO:SPATIAL_RESAMPLING_FILE
= "N/A"
MRO:SPATIAL_RESCALING_FLAG
= "OFF"
MRO:SPATIAL_RESCALING_FILE
= "N/A"
MRO:SPECTRAL_RESAMPLING_FLAG
= "OFF"
MRO:SPECTRAL_RESAMPLING_FILE
= "N/A"
/*
Hyperspectral Data Filter Control Parameters */
MRO:HDF_SOFTWARE_NAME
= "N/A"
MRO:HDF_SOFTWARE_VERSION_ID
= "N/A"
MRO:IF_MIN_VALUE
= "N/A"
MRO:IF_MAX_VALUE
= "N/A"
MRO:TRACE_MIN_VALUE
= "N/A"
MRO:TRACE_MAX_VALUE
= "N/A"
MRO:REFZ_MEDIAN_BOX_WIDTH
= "N/A"
MRO:REFZ_SMOOTH_BOX_WIDTH
= "N/A"
MRO:FRAM_STAT_MEDIAN_BOX_WIDTH
= "N/A"
MRO:FRAM_STAT_MIN_DEVIATION
= "N/A"
MRO:FRAM_STAT_MEDIAN_CONF_LVL
= "N/A"
MRO:FRAM_STAT_IQR_CONF_LVL
= "N/A"
MRO:RSC_REF_XY_MEDIAN_WIDTH
= "N/A"
MRO:RSC_REF_XY_SMOOTH_WIDTH
= "N/A"
MRO:RSC_REF_YZ_MEDIAN_WIDTH
= "N/A"
MRO:RSC_REF_YZ_SMOOTH_WIDTH
= "N/A"
MRO:RSC_RATIO_XY_MEDIAN_WIDTH
= "N/A"
MRO:RSC_RATIO_XY_SMOOTH_WIDTH
= "N/A"
MRO:RSC_RES_XY_PLY_ORDER
= "N/A"
MRO:RSC_RES_XY_PLY_EXTND_WIDTH
= "N/A"
MRO:LOG_XFORM_NEG_CLIP_VALUE
= "N/A"
MRO:IKF_NUM_REGIONS
= "N/A"
MRO:IKF_START_CHANNEL
= ("N/A", "N/A")
MRO:IKF_STOP_CHANNEL
= ("N/A", "N/A")
MRO:IKF_CONFIDENCE_LEVEL
= ("N/A", "N/A")
MRO:IKF_WEIGHTING_STDDEV
= ("N/A", "N/A")
MRO:IKF_KERNEL_SIZE_X
= ("N/A", "N/A")
MRO:IKF_KERNEL_SIZE_Y
= ("N/A", "N/A")
MRO:IKF_KERNEL_SIZE_Z
= ("N/A", "N/A")
MRO:IKF_MODEL_ORDER_X
= ("N/A", "N/A")
MRO:IKF_MODEL_ORDER_Y
= ("N/A", "N/A")
MRO:IKF_MODEL_ORDER_Z
= ("N/A", "N/A")
/* This
Targeted RDR label describes two data files. The first file */
/*
contains the first two objects and the second file contains the */
/*
third: */
/* 1.
A multiple-band image file containing calibrated RDR data, */
/*
in units of radiance, */
/* 2.
A binary table of selected image row numbers from detector, */
/* 3.
A table of ancillary and housekeeping data converted to */
/*
engineering units. */
OBJECT
= FILE
^IMAGE = "FRT00004ECA_07_RA166L_TRR3.IMG"
^ROWNUM_TABLE = ("FRT00004ECA_07_RA166L_TRR3.IMG", 210241 )
RECORD_TYPE = FIXED_LENGTH
RECORD_BYTES = 2560
FILE_RECORDS = 210241
OBJECT = IMAGE
LINES = 480
LINE_SAMPLES = 640
SAMPLE_TYPE = PC_REAL
SAMPLE_BITS = 32
UNIT = "W / (m**2 micrometer sr)"
BANDS = 438
BAND_STORAGE_TYPE = LINE_INTERLEAVED
END_OBJECT = IMAGE
OBJECT = ROWNUM_TABLE
NAME = "SELECTED ROWS FROM DETECTOR"
INTERCHANGE_FORMAT = "BINARY"
ROWS = 438
COLUMNS = 1
ROW_BYTES = 2
DESCRIPTION = "The detector is subsampled in the spectral direction
by selecting specific rows to be downlinked. This
table provides a list of the rows selected for all
frames in this multidimensional image cube."
OBJECT = COLUMN
NAME = DETECTOR_ROW_NUMBER
DATA_TYPE = MSB_UNSIGNED_INTEGER
COLUMN_NUMBER = 1
BIT_MASK = 2#0000000111111111#
START_BYTE = 1
BYTES = 2
DESCRIPTION = "Detector row number from which the data was taken."
END_OBJECT = COLUMN
END_OBJECT = ROWNUM_TABLE
END_OBJECT
= FILE
OBJECT
= FILE
^TRDR_HK_TABLE = "FRT00004ECA_07_RA166L_HKP3.TAB"
RECORD_TYPE = FIXED_LENGTH
RECORD_BYTES = 1221
FILE_RECORDS = 480
OBJECT = TRDR_HK_TABLE
NAME = "TARGETED RDR HOUSEKEEPING TABLE"
INTERCHANGE_FORMAT = ASCII
ROWS = 480
COLUMNS = 233
ROW_BYTES = 1221
^STRUCTURE = "TRDRHK.FMT"
END_OBJECT = TRDR_HK_TABLE
END_OBJECT
= FILE
END
PDS_VERSION_ID
= PDS3
LABEL_REVISION_NOTE
= "2004-11-22, S. Slavney (GEO);
2005-12-20, H. Taylor (JHU/APL);
2006-04-05, S. Murchie (JHU/APL);
2006-09-18, P. Cavender (JHU/APL);
2007-04-30, P. Cavender (JHU/APL);
Version 1, Improved SS CDRs and
added post-processing bad pixel
correction
2007-09-13, D. Humm (JHU/APL);
Version 2, Improved calibration
motivated by Deimos observation
2010-06-01, D. Humm (JHU/APL);
Version 3, shutter mirror correction
and other calibration tweaks
2010-10-12, C. Hash (ACT);
Version 3, Added data filter control
parameters"
DATA_SET_ID
= "MRO-M-CRISM-3-RDR-TARGETED-V1.0"
PRODUCT_ID
= "FRT00004ECA_07_IF166L_TRR3"
/*
cccnnnnnnnn_xx_ooaaas_TRRv */
/* ccc
= Class Type */
/*
nnnnnnnn = Observation ID, hexadecimal */
/*
ooaaa = Image type, Macro number */
/* s =
Sensor ID (S or L) */
/* v =
Version number */
INSTRUMENT_HOST_NAME
= "MARS RECONNAISSANCE ORBITER"
SPACECRAFT_ID
= MRO
INSTRUMENT_NAME
= "COMPACT RECONNAISSANCE IMAGING
SPECTROMETER FOR MARS"
INSTRUMENT_ID
= CRISM
TARGET_NAME
= MARS
PRODUCT_TYPE
= TARGETED_RDR
PRODUCT_CREATION_TIME
= 2010-11-11T04:21:39
START_TIME
= 2007-03-23T03:02:31.499
STOP_TIME
= 2007-03-23T03:04:39.233
SPACECRAFT_CLOCK_START_COUNT
= "2/0859086170.55396"
SPACECRAFT_CLOCK_STOP_COUNT
= "2/0859086298.37980"
ORBIT_NUMBER
= "NULL"
OBSERVATION_TYPE
= "FRT"
OBSERVATION_ID
= "16#00004ECA#"
MRO:OBSERVATION_NUMBER
= 16#07#
MRO:ACTIVITY_ID
= "IF166"
MRO:SENSOR_ID
= "L"
MRO:DETECTOR_TEMPERATURE
= -165.838
MRO:OPTICAL_BENCH_TEMPERATURE
= -48.411
MRO:SPECTROMETER_HOUSING_TEMP
= -72.699
MRO:SPHERE_TEMPERATURE
= -48.064
MRO:FPE_TEMPERATURE
= 0.812
PRODUCT_VERSION_ID
= "3"
SOURCE_PRODUCT_ID
= {
"CDR410000000000_DM0000000L_3",
"CDR410000000000_LL0000000L_4",
"CDR410000000000_SH0000001L_4",
"CDR410000000000_SS0000001L_6",
"CDR410000000000_TD0000000S_2",
"CDR410803692813_SF0000000L_4",
"CDR420847411200_NU1000001L_5",
"CDR420859086160_BK1030100L_3",
"CDR420859086162_BP1000000L_3",
"CDR420859086162_UB1030100L_3",
"CDR420859086234_BP1000000L_3",
"CDR420859086302_BK1030100L_3",
"CDR420859086303_BP1000000L_3",
"CDR420859086303_UB1030100L_3",
"CDR420859087293_BK0003800L_3",
"CDR420859087299_UB0003800L_3",
"CDR420859087333_SP0003801L_3",
"CDR420859087333_SP0042501S_3",
"CDR420859087355_BK0003800L_3",
"CDR420859087361_UB0003800L_3",
"CDR420859127820_BI1000000L_3",
"CDR420861470430_BI0000000L_3",
"CDR6_1_0000000000_AS_L_0",
"CDR6_1_0000000000_BS_L_0",
"CDR6_1_0000000000_DB_L_0",
"CDR6_1_0000000000_EB_L_0",
"CDR6_1_0000000000_GH_L_2",
"CDR6_1_0000000000_HD_J_1",
"CDR6_1_0000000000_HK_J_1",
"CDR6_1_0000000000_HV_J_1",
"CDR6_1_0000000000_LC_L_1",
"CDR6_1_0000000000_LI_J_0",
"CDR6_1_0000000000_VL_L_0",
"CDR6_2_0835294537_PP_L_0",
"CDR6_2_0859075219_ST_J_0",
"FRT00004ECA_07_SC166L_EDR0"
}
MRO:INVALID_PIXEL_LOCATION
= {
}
PRODUCER_INSTITUTION_NAME
= "JOHNS HOPKINS UNIVERSITY
APPLIED PHYSICS LABORATORY"
SOFTWARE_NAME
= "crism_imagecal"
SOFTWARE_VERSION_ID
= "2.5.3"
/*
Targeted RDR Instrument and Observation Parameters */
TARGET_CENTER_DISTANCE
= "NULL" <KM>
SOLAR_DISTANCE
= 212139419.063420 <KM>
SOLAR_LONGITUDE
= 205.304261
SHUTTER_MODE_ID
= "OPEN"
LIGHT_SOURCE_NAME
= "NONE"
MRO:CALIBRATION_LAMP_STATUS
= "OFF"
MRO:CALIBRATION_LAMP_LEVEL
= "N/A"
PIXEL_AVERAGING_WIDTH
= 1
MRO:INSTRUMENT_POINTING_MODE
= "DYNAMIC POINTING"
SCAN_MODE_ID
= "SHORT"
MRO:FRAME_RATE
= 3.75 <HZ>
MRO:EXPOSURE_PARAMETER
= 301
SAMPLING_MODE_ID
= "HYPERSPEC"
COMPRESSION_TYPE
= "NONE"
MRO:WAVELENGTH_FILTER
= "0"
MRO:WAVELENGTH_FILE_NAME
= "CDR410803692813_WA0000000L_3.IMG"
MRO:PIXEL_PROC_FILE_NAME
= "CDR6_2_0835294537_PP_L_0.TAB"
MRO:INV_LOOKUP_TABLE_FILE_NAME
= "CDR6_1_0000000000_LI_J_0.TAB"
MRO:ATMO_CORRECTION_FLAG
= "OFF"
MRO:THERMAL_CORRECTION_MODE
= "OFF"
MRO:PHOTOCLIN_CORRECTION_FLAG
= "OFF"
MRO:SPATIAL_RESAMPLING_FLAG
= "OFF"
MRO:SPATIAL_RESAMPLING_FILE
= "N/A"
MRO:SPATIAL_RESCALING_FLAG
= "OFF"
MRO:SPATIAL_RESCALING_FILE
= "N/A"
MRO:SPECTRAL_RESAMPLING_FLAG
= "OFF"
MRO:SPECTRAL_RESAMPLING_FILE
= "N/A"
/*
Hyperspectral Data Filter Control Parameters */
MRO:HDF_SOFTWARE_NAME
= "crismhdf"
MRO:HDF_SOFTWARE_VERSION_ID
= "1.0.4"
MRO:IF_MIN_VALUE
= 0.000000
MRO:IF_MAX_VALUE
= 1.000000
MRO:TRACE_MIN_VALUE
= 0.01
MRO:TRACE_MAX_VALUE
= 100.00
MRO:REFZ_MEDIAN_BOX_WIDTH
= 35
MRO:REFZ_SMOOTH_BOX_WIDTH
= 9
MRO:FRAM_STAT_MEDIAN_BOX_WIDTH
= 5
MRO:FRAM_STAT_MIN_DEVIATION
= 0.00500000
MRO:FRAM_STAT_MEDIAN_CONF_LVL
= 0.99999900
MRO:FRAM_STAT_IQR_CONF_LVL
= 0.99999900
MRO:RSC_REF_XY_MEDIAN_WIDTH
= 15
MRO:RSC_REF_XY_SMOOTH_WIDTH
= 5
MRO:RSC_REF_YZ_MEDIAN_WIDTH
= 15
MRO:RSC_REF_YZ_SMOOTH_WIDTH
= 5
MRO:RSC_RATIO_XY_MEDIAN_WIDTH
= 25
MRO:RSC_RATIO_XY_SMOOTH_WIDTH
= 13
MRO:RSC_RES_XY_PLY_ORDER
= 5
MRO:RSC_RES_XY_PLY_EXTND_WIDTH
= 38
MRO:LOG_XFORM_NEG_CLIP_VALUE
= 0.00000100
MRO:IKF_NUM_REGIONS
= 2
MRO:IKF_START_CHANNEL
= ( 0, 179 )
MRO:IKF_STOP_CHANNEL
= ( 178, 437 )
MRO:IKF_CONFIDENCE_LEVEL
= ( 0.900, 0.900 )
MRO:IKF_WEIGHTING_STDDEV
= ( 1.500, 1.250 )
MRO:IKF_KERNEL_SIZE_X
= ( 5, 5 )
MRO:IKF_KERNEL_SIZE_Y
= ( 3, 3 )
MRO:IKF_KERNEL_SIZE_Z
= ( 5, 5 )
MRO:IKF_MODEL_ORDER_X
= ( 1, 1 )
MRO:IKF_MODEL_ORDER_Y
= ( 1, 1 )
MRO:IKF_MODEL_ORDER_Z
= ( 1, 4 )
/* This
Targeted RDR label describes two data files. The first file */
/*
contains the first two objects and the second file contains the */
/*
third: */
/* 1.
A multiple-band image file containing calibrated RDR data, */
/*
in units of radiance, */
/* 2.
A binary table of selected image row numbers from detector, */
/* 3.
A table of ancillary and housekeeping data converted to */
/*
engineering units. */
OBJECT
= FILE
^IMAGE = "FRT00004ECA_07_IF166L_TRR3.IMG"
^ROWNUM_TABLE = ("FRT00004ECA_07_IF166L_TRR3.IMG", 210241 )
RECORD_TYPE = FIXED_LENGTH
RECORD_BYTES = 2560
FILE_RECORDS = 210241
OBJECT = IMAGE
LINES = 480
LINE_SAMPLES = 640
SAMPLE_TYPE = PC_REAL
SAMPLE_BITS = 32
UNIT = "I_OVER_F"
BANDS = 438
BAND_STORAGE_TYPE = LINE_INTERLEAVED
END_OBJECT = IMAGE
OBJECT = ROWNUM_TABLE
NAME = "SELECTED ROWS FROM DETECTOR"
INTERCHANGE_FORMAT = "BINARY"
ROWS = 438
COLUMNS = 1
ROW_BYTES = 2
DESCRIPTION = "The detector is subsampled in the spectral direction
by selecting specific rows to be downlinked. This
table provides a list of the rows selected for all
frames in this multidimensional image cube."
OBJECT = COLUMN
NAME = DETECTOR_ROW_NUMBER
DATA_TYPE = MSB_UNSIGNED_INTEGER
COLUMN_NUMBER = 1
BIT_MASK = 2#0000000111111111#
START_BYTE = 1
BYTES = 2
DESCRIPTION = "Detector row number from which the data was taken."
END_OBJECT = COLUMN
END_OBJECT = ROWNUM_TABLE
END_OBJECT
= FILE
OBJECT
= FILE
^TRDR_HK_TABLE = "FRT00004ECA_07_RA166L_HKP3.TAB"
RECORD_TYPE = FIXED_LENGTH
RECORD_BYTES = 1221
FILE_RECORDS = 480
OBJECT = TRDR_HK_TABLE
NAME = "TARGETED RDR HOUSEKEEPING TABLE"
INTERCHANGE_FORMAT = ASCII
ROWS = 480
COLUMNS = 233
ROW_BYTES = 1221
^STRUCTURE = "TRDRHK.FMT"
END_OBJECT = TRDR_HK_TABLE
END_OBJECT
= FILE
END
PDS_VERSION_ID
= PDS3
RECORD_TYPE = UNDEFINED
LABEL_REVISION_NOTE = "2003-11-19, S. Slavney
(GEO);
2005-09-25, S. Murchie
(JHU/APL);
2007-03-09, E. Malaret (ACT
Corp.);
2007-09-14, C. Hash (ACT Corp);
2022-04-28 G. Romeo, F. Seelos,
K. Hancock,
R. Poffenbarger
(JHU/APL);"
^ENVI_HEADER =
"T1018_MRRAL_00N358_0327_4.HDR"
^IMAGE =
"T1018_MRRAL_00N358_0327_4.IMG"
/* Multispectral Reduced Data Record (MRDR) Product Identification
*/
DATA_SET_ID =
"MRO-M-CRISM-5-RDR-MULTISPECTRAL-V1.0"
PRODUCT_ID =
"T1018_MRRAL_00N358_0327_4"
/*(
TNNNN_MRRss_yydxxx_rrrr_v )*/
/*( NNNN = tile
number )*/
/*( ss = subtype of image
product )*/
/*( yy = latitude of upper left
corner )*/
/*( d = N or S for north or south
latitude )*/
/*( xxx = east longitude of upper
left corner )*/
/*( rrrr = resolution in
pixels/degree )*/
/*( v = version
number )*/
INSTRUMENT_HOST_NAME = "MARS RECONNAISSANCE
ORBITER"
SPACECRAFT_ID = MRO
INSTRUMENT_NAME = "COMPACT RECONNAISSANCE
IMAGING
SPECTROMETER FOR MARS"
INSTRUMENT_ID = CRISM
TARGET_NAME = MARS
PRODUCT_TYPE = MAP_PROJECTED_MULTISPECTRAL_RDR
PRODUCT_CREATION_TIME = 2022-07-15T17:36:07
START_TIME = "N/A"
STOP_TIME = "N/A"
SPACECRAFT_CLOCK_START_COUNT = "N/A"
SPACECRAFT_CLOCK_STOP_COUNT = "N/A"
PRODUCT_VERSION_ID = "4"
PRODUCER_INSTITUTION_NAME = "JOHNS HOPKINS UNIVERSITY
APPLIED PHYSICS
LABORATORY"
SOFTWARE_NAME =
"crism_mapping_execute_flow"
SOFTWARE_VERSION_ID = "1.03.62"
MRO:WAVELENGTH_FILE_NAME =
"T1018_MRRWV_00N358_0327_4.TAB"
/* This Map Projected Multispectral RDR label describes one data
file: */
/* 1. A multiple-band image file of calibrated RDR data in
radiance, */
/* reflectance, or quantities derived therein, or related
ancillary information. */
/* This RDR represents one latitude-longitude bin in a global
map. */
/* See the Map Projection Object below for bin coordinates and
resolution. */
/* See the CRISM Data Products SIS for more detailed
description. */
/* Description of MAP PROJECTED MULTISPECTRAL RDR REFLECTANCE
IMAGE file */
/* MRO:PHOTOMETRIC_CORR_FLAG = "ON" */
/* MRO:ATMOSPHERIC_CORR_FLAG = "ON" */
/* MRO:RATIO_SHIFT_CORR_FLAG = "ON" */
/* MRO:EMPIRICAL_GEOM_NORM_FLAG = "OFF" */
/* MRO:EMPIRICAL_SMILE_CORR_FLAG = "ON" */
/* MRO:SENSOR_SPACE_TRANSFORM_FLAG = "ON" */
/* ENVI header
description */
/* The ENVI header is a separate ASCII file that includes
basic */
/* image data file characteristics and allows the image data to
be */
/* loaded directly into the ENVI image processing software
available */
/* bands
list. */
OBJECT = ENVI_HEADER
HEADER_TYPE = "ENVI"
INTERCHANGE_FORMAT = "ASCII"
BYTES = 2152
DESCRIPTION = "This text file can be used by
ENVI image
processing software to read in the image."
END_OBJECT = ENVI_HEADER
OBJECT = IMAGE
LINES = 1636
LINE_SAMPLES = 1636
SAMPLE_TYPE = PC_REAL
SAMPLE_BITS = 32
BANDS = 72
BAND_STORAGE_TYPE = BAND_SEQUENTIAL
MISSING_CONSTANT = 65535
END_OBJECT = IMAGE
/* Map projection information about this RDR is in the
IMAGE_MAP_PROJECTION */
/* object
below. */
OBJECT = IMAGE_MAP_PROJECTION
^DATA_SET_MAP_PROJECTION = "MRR_MAP.CAT"
MAP_PROJECTION_TYPE = "EQUIRECTANGULAR"
A_AXIS_RADIUS = 3396.190000000000
<KILOMETER>
B_AXIS_RADIUS = 3396.190000000000
<KILOMETER>
C_AXIS_RADIUS = 3396.190000000000
<KILOMETER>
POSITIVE_LONGITUDE_DIRECTION = EAST
CENTER_LATITUDE = 0.0000000 <DEGREE>
CENTER_LONGITUDE = -2.5000000 <DEGREE>
LINE_FIRST_PIXEL = 1 <PIXEL>
LINE_LAST_PIXEL = 1636 <PIXEL>
SAMPLE_FIRST_PIXEL = 1 <PIXEL>
SAMPLE_LAST_PIXEL = 1636 <PIXEL>
MAP_PROJECTION_ROTATION = 0.0000000 <DEGREE>
MAP_RESOLUTION = 326.9999786
MAP_SCALE = 0.1812682
MINIMUM_LATITUDE = -2.5000000 <DEGREE>
MAXIMUM_LATITUDE = 2.5000000 <DEGREE>
WESTERNMOST_LONGITUDE = -5.0000000 <DEGREE>
EASTERNMOST_LONGITUDE = 0.0000000 <DEGREE>
LINE_PROJECTION_OFFSET = 817.1448417 <PIXEL>
SAMPLE_PROJECTION_OFFSET = 817.2648722 <PIXEL>
COORDINATE_SYSTEM_TYPE = "BODY-FIXED ROTATING"
COORDINATE_SYSTEM_NAME = "PLANETOCENTRIC"
END_OBJECT = IMAGE_MAP_PROJECTION
END
PDS_VERSION_ID = PDS3
RECORD_TYPE = UNDEFINED
LABEL_REVISION_NOTE = "2003-11-19, S. Slavney
(GEO);
2005-09-25, S. Murchie
(JHU/APL);
2007-03-09, E. Malaret (ACT
Corp.);
2007-09-14, C. Hash (ACT Corp);
2022-04-28 G. Romeo, F. Seelos,
K. Hancock,
R. Poffenbarger
(JHU/APL);"
^ENVI_HEADER =
"T1018_MRRDE_00N358_0327_4.HDR"
^IMAGE =
"T1018_MRRDE_00N358_0327_4.IMG"
/* Multispectral Reduced Data Record (MRDR) Product Identification
*/
DATA_SET_ID =
"MRO-M-CRISM-5-RDR-MULTISPECTRAL-V1.0"
PRODUCT_ID =
"T1018_MRRDE_00N358_0327_4"
/*(
TNNNN_MRRss_yydxxx_rrrr_v )*/
/*( NNNN = tile
number )*/
/*( ss = subtype of image
product )*/
/*( yy = latitude of upper left
corner )*/
/*( d = N or S for north or south
latitude )*/
/*( xxx = east longitude of upper
left corner )*/
/*( rrrr = resolution in
pixels/degree )*/
/*( v = version
number )*/
INSTRUMENT_HOST_NAME = "MARS RECONNAISSANCE
ORBITER"
SPACECRAFT_ID = MRO
INSTRUMENT_NAME = "COMPACT RECONNAISSANCE
IMAGING
SPECTROMETER FOR MARS"
INSTRUMENT_ID = CRISM
TARGET_NAME = MARS
PRODUCT_TYPE = MAP_PROJECTED_MULTISPECTRAL_RDR
PRODUCT_CREATION_TIME = 2022-07-15T17:36:07
START_TIME = "N/A"
STOP_TIME = "N/A"
SPACECRAFT_CLOCK_START_COUNT = "N/A"
SPACECRAFT_CLOCK_STOP_COUNT = "N/A"
PRODUCT_VERSION_ID = "4"
PRODUCER_INSTITUTION_NAME = "JOHNS HOPKINS UNIVERSITY
APPLIED PHYSICS
LABORATORY"
SOFTWARE_NAME =
"crism_mapping_execute_flow"
SOFTWARE_VERSION_ID = "1.03.62"
MRO:WAVELENGTH_FILE_NAME = "N/A"
/* This Map Projected Multispectral RDR label describes one data
file: */
/* 1. A multiple-band image file of calibrated RDR data in
radiance, */
/* reflectance, or quantities derived therein, or related
ancillary information. */
/* This RDR represents one latitude-longitude bin in a global
map. */
/* See the Map Projection Object below for bin coordinates and
resolution. */
/* See the CRISM Data Products SIS for more detailed
description. */
/* Description of MAP PROJECTED MULTISPECTRAL RDR REFLECTANCE
IMAGE file */
/* ENVI header
description */
/* The ENVI header is a separate ASCII file that includes
basic */
/* image data file characteristics and allows the image data to
be */
/* loaded directly into the ENVI image processing software
available */
/* bands
list. */
OBJECT = ENVI_HEADER
HEADER_TYPE = "ENVI"
INTERCHANGE_FORMAT = "ASCII"
BYTES = 1727
DESCRIPTION = "This text file can be used by
ENVI image
processing software to read in the image."
END_OBJECT = ENVI_HEADER
OBJECT = IMAGE
LINES = 1636
LINE_SAMPLES = 1636
SAMPLE_TYPE = PC_REAL
SAMPLE_BITS = 32
BANDS = 19
BAND_STORAGE_TYPE = BAND_SEQUENTIAL
BAND_NAME = ( "Target ID",
"Segment ID (Counter)",
"VNIR (S-detector) Sample",
"VNIR (S-detector) Line",
"IR (L-detector) Sample",
"IR (L-detector) Line",
"INA at areoid - deg",
"EMA at areoid - deg",
"Phase angle - deg",
"Latitude - areocentric - deg
N",
"Longitude - areocentric - deg
E",
"INA at surface from MOLA -
deg",
"EMA at surface from MOLA -
deg",
"Slope magnitude from MOLA -
deg",
"MOLA slope azimuth - deg clkwise
from N",
"Elevation - meters relative to
MOLA",
"Thermal inertia - J m^-2 K^-1
s^-0.5",
"Bolometic albedo",
"Local solar time - hours")
MISSING_CONSTANT = 65535
END_OBJECT = IMAGE
/* Map projection information about this RDR is in the
IMAGE_MAP_PROJECTION */
/* object
below. */
OBJECT = IMAGE_MAP_PROJECTION
^DATA_SET_MAP_PROJECTION = "MRR_MAP.CAT"
MAP_PROJECTION_TYPE = "EQUIRECTANGULAR"
A_AXIS_RADIUS = 3396.190000000000
<KILOMETER>
B_AXIS_RADIUS = 3396.190000000000
<KILOMETER>
C_AXIS_RADIUS = 3396.190000000000
<KILOMETER>
POSITIVE_LONGITUDE_DIRECTION = EAST
CENTER_LATITUDE = 0.0000000 <DEGREE>
CENTER_LONGITUDE = -2.5000000 <DEGREE>
LINE_FIRST_PIXEL = 1 <PIXEL>
LINE_LAST_PIXEL = 1636 <PIXEL>
SAMPLE_FIRST_PIXEL = 1 <PIXEL>
SAMPLE_LAST_PIXEL = 1636 <PIXEL>
MAP_PROJECTION_ROTATION = 0.0000000 <DEGREE>
MAP_RESOLUTION = 326.9999786
MAP_SCALE = 0.1812682
MINIMUM_LATITUDE = -2.5000000 <DEGREE>
MAXIMUM_LATITUDE = 2.5000000 <DEGREE>
WESTERNMOST_LONGITUDE = -5.0000000 <DEGREE>
EASTERNMOST_LONGITUDE = 0.0000000 <DEGREE>
LINE_PROJECTION_OFFSET = 817.1448417 <PIXEL>
SAMPLE_PROJECTION_OFFSET = 817.2648722 <PIXEL>
COORDINATE_SYSTEM_TYPE = "BODY-FIXED ROTATING"
COORDINATE_SYSTEM_NAME = "PLANETOCENTRIC"
END_OBJECT = IMAGE_MAP_PROJECTION
END
PDS_VERSION_ID = PDS3
RECORD_TYPE = UNDEFINED
LABEL_REVISION_NOTE = "2003-11-19, S. Slavney
(GEO);
2005-09-25, S. Murchie
(JHU/APL);
2007-03-09, E. Malaret (ACT
Corp.);
2007-09-14, C. Hash (ACT Corp);
2022-04-28 G. Romeo, F. Seelos,
K. Hancock,
R. Poffenbarger
(JHU/APL);"
^ENVI_HEADER =
"T1018_MRRSU_00N358_0327_4.HDR"
^IMAGE = "T1018_MRRSU_00N358_0327_4.IMG"
/* Multispectral Reduced Data Record (MRDR) Product Identification
*/
DATA_SET_ID =
"MRO-M-CRISM-5-RDR-MULTISPECTRAL-V1.0"
PRODUCT_ID =
"T1018_MRRSU_00N358_0327_4"
/*(
TNNNN_MRRss_yydxxx_rrrr_v )*/
/*( NNNN = tile
number )*/
/*( ss = subtype of image
product )*/
/*( yy = latitude of upper left
corner )*/
/*( d = N or S for north or south
latitude )*/
/*( xxx = east longitude of upper
left corner )*/
/*( rrrr = resolution in
pixels/degree )*/
/*( v = version
number )*/
INSTRUMENT_HOST_NAME = "MARS RECONNAISSANCE
ORBITER"
SPACECRAFT_ID = MRO
INSTRUMENT_NAME = "COMPACT RECONNAISSANCE
IMAGING
SPECTROMETER FOR MARS"
INSTRUMENT_ID = CRISM
TARGET_NAME = MARS
PRODUCT_TYPE = MAP_PROJECTED_MULTISPECTRAL_RDR
PRODUCT_CREATION_TIME = 2022-07-15T17:36:07
START_TIME = "N/A"
STOP_TIME = "N/A"
SPACECRAFT_CLOCK_START_COUNT = "N/A"
SPACECRAFT_CLOCK_STOP_COUNT = "N/A"
PRODUCT_VERSION_ID = "4"
PRODUCER_INSTITUTION_NAME = "JOHNS HOPKINS UNIVERSITY
APPLIED PHYSICS
LABORATORY"
SOFTWARE_NAME =
"crism_mapping_execute_flow"
SOFTWARE_VERSION_ID = "1.03.62"
MRO:WAVELENGTH_FILE_NAME = "N/A"
/* This Map Projected Multispectral RDR label describes one data
file: */
/* 1. A multiple-band image file of calibrated RDR data in
radiance, */
/* reflectance, or quantities derived therein, or related
ancillary information. */
/* This RDR represents one latitude-longitude bin in a global
map. */
/* See the Map Projection Object below for bin coordinates and
resolution. */
/* See the CRISM Data Products SIS for more detailed
description. */
/* Description of MAP PROJECTED MULTISPECTRAL RDR REFLECTANCE
IMAGE file */
/* MRO:PHOTOMETRIC_CORR_FLAG = "ON" */
/* MRO:ATMOSPHERIC_CORR_FLAG = "ON" */
/* MRO:RATIO_SHIFT_CORR_FLAG = "ON" */
/* MRO:EMPIRICAL_GEOM_NORM_FLAG = "OFF" */
/* MRO:EMPIRICAL_SMILE_CORR_FLAG = "ON" */
/* MRO:SENSOR_SPACE_TRANSFORM_FLAG = "ON" */
/* ENVI header
description */
/* The ENVI header is a separate ASCII file that includes
basic */
/* image data file characteristics and allows the image data to
be */
/* loaded directly into the ENVI image processing software
available */
/* bands
list. */
OBJECT = ENVI_HEADER
HEADER_TYPE = "ENVI"
INTERCHANGE_FORMAT = "ASCII"
BYTES = 1720
DESCRIPTION = "This text file can be used by
ENVI image
processing software to read in the image."
END_OBJECT = ENVI_HEADER
OBJECT = IMAGE
LINES = 1636
LINE_SAMPLES = 1636
SAMPLE_TYPE = PC_REAL
SAMPLE_BITS = 32
BANDS = 60
BAND_STORAGE_TYPE = BAND_SEQUENTIAL
BAND_NAME = ( "R770",
"RBR",
"BD530_2",
"SH600_2",
"SH770",
"BD640_2",
"BD860_2",
"BD920_2",
"RPEAK1",
"BDI1000VIS",
"R440",
"IRR1",
"R530",
"R600",
"BDI1000IR",
"OLINDEX3",
"R1330",
"BD1300",
"LCPINDEX2",
"HCPINDEX2",
"VAR",
"ISLOPE1",
"BD1400",
"BD1435",
"BD1500_2",
"ICER1_2",
"BD1750_2",
"BD1900_2",
"BD1900R2",
"BDI2000",
"BD2100_2",
"BD2165",
"BD2190",
"MIN2200",
"BD2210_2",
"D2200",
"BD2230",
"BD2250",
"MIN2250",
"BD2265",
"BD2290",
"D2300",
"BD2355",
"SINDEX2",
"ICER2_2",
"MIN2295_2480",
"MIN2345_2537",
"BD2500_2",
"BD3000",
"BD3100",
"BD3200",
"BD3400_2",
"CINDEX2",
"BD2600",
"IRR2",
"IRR3",
"R1080",
"R1506",
"R2529",
"R3920")
MISSING_CONSTANT = 65535
END_OBJECT = IMAGE
/* Map projection information about this RDR is in the
IMAGE_MAP_PROJECTION */
/* object
below. */
OBJECT = IMAGE_MAP_PROJECTION
^DATA_SET_MAP_PROJECTION = "MRR_MAP.CAT"
MAP_PROJECTION_TYPE = "EQUIRECTANGULAR"
A_AXIS_RADIUS = 3396.190000000000
<KILOMETER>
B_AXIS_RADIUS = 3396.190000000000
<KILOMETER>
C_AXIS_RADIUS = 3396.190000000000
<KILOMETER>
POSITIVE_LONGITUDE_DIRECTION = EAST
CENTER_LATITUDE = 0.0000000 <DEGREE>
CENTER_LONGITUDE = -2.5000000 <DEGREE>
LINE_FIRST_PIXEL = 1 <PIXEL>
LINE_LAST_PIXEL = 1636 <PIXEL>
SAMPLE_FIRST_PIXEL = 1 <PIXEL>
SAMPLE_LAST_PIXEL = 1636 <PIXEL>
MAP_PROJECTION_ROTATION = 0.0000000 <DEGREE>
MAP_RESOLUTION = 326.9999786
MAP_SCALE = 0.1812682
MINIMUM_LATITUDE = -2.5000000 <DEGREE>
MAXIMUM_LATITUDE = 2.5000000 <DEGREE>
WESTERNMOST_LONGITUDE = -5.0000000 <DEGREE>
EASTERNMOST_LONGITUDE = 0.0000000 <DEGREE>
LINE_PROJECTION_OFFSET = 817.1448417 <PIXEL>
SAMPLE_PROJECTION_OFFSET = 817.2648722 <PIXEL>
COORDINATE_SYSTEM_TYPE = "BODY-FIXED ROTATING"
COORDINATE_SYSTEM_NAME = "PLANETOCENTRIC"
END_OBJECT = IMAGE_MAP_PROJECTION
END
PDS_VERSION_ID = PDS3
RECORD_TYPE = FIXED_LENGTH
RECORD_BYTES = 20
FILE_RECORDS = 72
LABEL_REVISION_NOTE = "2003-11-19, S. Slavney
(GEO);
2005-09-25, S. Murchie
(JHU/APL);
2007-03-09, E. Malaret (ACT
Corp.);
2007-09-14, C. Hash (ACT Corp);
2022-04-28 G. Romeo, F. Seelos,
K. Hancock,
R. Poffenbarger
(JHU/APL);"
^TABLE =
"T1018_MRRWV_00N358_0327_4.TAB"
DATA_SET_ID =
"MRO-M-CRISM-5-RDR-MULTISPECTRAL-V1.0"
PRODUCT_ID =
"T1018_MRRWV_00N358_0327_4"
/*(
TNNNN_MRRss_yydxxx_rrrr_v )*/
/*( NNNN = tile
number )*/
/*( ss = subtype of image
product )*/
/*( yy = latitude of upper left
corner )*/
/*( d = N or S for north or south
latitude )*/
/*( xxx = east longitude of upper
left corner )*/
/*( rrrr = resolution in
pixels/degree )*/
/*( v = version
number )*/
INSTRUMENT_HOST_NAME = "MARS RECONNAISSANCE
ORBITER"
SPACECRAFT_ID = MRO
INSTRUMENT_NAME = "COMPACT RECONNAISSANCE
IMAGING
SPECTROMETER FOR MARS"
INSTRUMENT_ID = CRISM
TARGET_NAME = MARS
PRODUCT_TYPE = MAP_PROJECTED_MULTISPECTRAL_RDR
PRODUCT_CREATION_TIME = 2022-07-15T17:36:07
START_TIME = "N/A"
STOP_TIME = "N/A"
SPACECRAFT_CLOCK_START_COUNT = "N/A"
SPACECRAFT_CLOCK_STOP_COUNT = "N/A"
PRODUCT_VERSION_ID = "1"
PRODUCER_INSTITUTION_NAME = "JOHNS HOPKINS UNIVERSITY
APPLIED PHYSICS LABORATORY"
SOFTWARE_NAME =
"crism_mapping_execute_flow"
SOFTWARE_VERSION_ID = "1.03.62"
/* A listfile including detector row numbers and wavelengths in
the */
/* I/F and Lambert albedo images. */
OBJECT = TABLE
NAME = "CRISM MRDR WAVELENGTH
TABLE"
INTERCHANGE_FORMAT = "ASCII"
ROWS = 72
COLUMNS = 3
ROW_BYTES = 20
DESCRIPTION = "CRISM MRDR wavelength table "
OBJECT = COLUMN
COLUMN_NUMBER = 1
NAME = SPECT_ID
DATA_TYPE = ASCII_INTEGER
START_BYTE = 1
BYTES = 1
DESCRIPTION = "Spectrometer identifier; 0 = IR; 1 =
VNIR"
END_OBJECT = COLUMN
OBJECT = COLUMN
COLUMN_NUMBER = 2
NAME = ROWNUM
DATA_TYPE = ASCII_INTEGER
START_BYTE = 3
BYTES = 4
DESCRIPTION = "detector row number (0-479)"
END_OBJECT = COLUMN
OBJECT = COLUMN
COLUMN_NUMBER = 3
NAME = SAMPL_WAV
DATA_TYPE = ASCII_REAL
START_BYTE = 8
BYTES = 11
DESCRIPTION = "Standard sampling center wavelength in
nm"
UNIT = "NM"
END_OBJECT = COLUMN
END_OBJECT = TABLE
END
PDS_VERSION_ID = PDS3
RECORD_TYPE = FIXED_LENGTH
RECORD_BYTES = 2560
FILE_RECORDS = 294300
LABEL_REVISION_NOTE =
"2012-03-06, H. Taylor, F. Seelos (JHU/APL)
Initial TER/MTRDR labels for CRISM Data Users'
Workshop;
2014-01-09, G. Romeo, J. Aiello, F. Seelos
(JHU/APL)
Complete TER/MTRDR label set for preliminary
PDS review;
2014-04-08, G. Romeo, J. Aiello, R. Espiritu,
F. Seelos (JHU/APL)
TER/MTRDR label set revisions completed for PDS
peer review;
2014-08-14, G. Romeo, J. Aiello, F. Seelos
(JHU/APL)
PDS peer review TER/MTRDR label set liens
retired;"
^ENVI_HEADER =
"FRT00002F7F_07_IF168J_TER3.HDR"
^IMAGE = "FRT00002F7F_07_IF168J_TER3.IMG"
/* Joined Targeted Empirical Record Identification
*/
DATA_SET_ID =
"MRO-M-CRISM-4-RDR-TARGETED-V1.0"
PRODUCT_ID =
"FRT00002F7F_07_IF168J_TER3"
/*
cccnnnnnnnn_xx_ooaaas_TERv */
/* ccc = Class
Type */
/* nnnnnnnn =
Observation ID, hexadecimal */
/* xx = counter this
observation (hex) */
/* ooaaa = Image
type, Macro number */
/* s = Sensor ID (J
for Joined) */
/* v = Version
number */
INSTRUMENT_HOST_NAME = "MARS
RECONNAISSANCE ORBITER"
SPACECRAFT_ID = MRO
INSTRUMENT_NAME = "COMPACT
RECONNAISSANCE IMAGING
SPECTROMETER FOR
MARS"
INSTRUMENT_ID = CRISM
TARGET_NAME = MARS
PRODUCT_TYPE = TARGETED_RDR
PRODUCT_CREATION_TIME = 2015-06-10T16:38:51
START_TIME =
2006-11-11T13:21:36.054
STOP_TIME =
2006-11-11T13:23:59.788
SPACECRAFT_CLOCK_START_COUNT =
"2/0847718514.58200"
SPACECRAFT_CLOCK_STOP_COUNT =
"2/0847718658.40771"
ORBIT_NUMBER = 1374
OBSERVATION_TYPE = "FRT"
OBSERVATION_ID =
"16#00002F7F#"
MRO:OBSERVATION_NUMBER = 16#07#
MRO:ACTIVITY_ID = "IF168"
MRO:SENSOR_ID = "J"
/* Detector and FPE temperature refer to IR
component of observation */
MRO:DETECTOR_TEMPERATURE = -163.287
MRO:OPTICAL_BENCH_TEMPERATURE = -52.315
MRO:SPECTROMETER_HOUSING_TEMP = -75.764
MRO:SPHERE_TEMPERATURE = -52.275
MRO:FPE_TEMPERATURE = -0.375
PRODUCT_VERSION_ID = "3"
PRODUCER_INSTITUTION_NAME = "JOHNS HOPKINS
UNIVERSITY
APPLIED PHYSICS
LABORATORY"
SOFTWARE_NAME =
"mtrdr_pipeline"
SOFTWARE_VERSION_ID = "1.0"
SOURCE_PRODUCT_ID = (
"FRT00002F7F_07_DE168L_DDR1",
"FRT00002F7F_07_DE168S_DDR1",
"FRT00002F7F_07_IF168L_TRR3",
"FRT00002F7F_07_IF168S_TRR3",
"CDR410803692813_WA0000000L_3",
"CDR410803692813_WA0000000S_2",
"CDR6_1_0000000000_SW_L_3",
"CDR6_1_0000000000_SW_S_2"
)
/* Targeted RDR Observation and Processing
Parameters */
SOLAR_DISTANCE = 236036552.409150
<KILOMETER>
SOLAR_LONGITUDE = 133.840086
MRO:WAVELENGTH_FILE_NAME =
"FRT00002F7F_07_WV168J_TER3.TAB"
MRO:PHOTOMETRIC_CORR_FLAG = "ON"
MRO:ATMOSPHERIC_CORR_FLAG = "ON"
MRO:RATIO_SHIFT_CORR_FLAG = "ON"
MRO:EMPIRICAL_GEOM_NORM_FLAG = "ON"
MRO:EMPIRICAL_SMILE_CORR_FLAG = "ON"
MRO:SENSOR_SPACE_TRANSFORM_FLAG = "ON"
/* ENVI header description */
/* The ENVI header is a separate ASCII file that
includes basic image */
/* data file characteristics and allows the image
data to be loaded */
/* directly into the ENVI image processing software
available bands */
/*
list. */
OBJECT = ENVI_HEADER
HEADER_TYPE = "ENVI"
INTERCHANGE_FORMAT = "ASCII"
BYTES = 17855
DESCRIPTION = "This text file can
be used by ENVI image
processing software to read in the
image."
END_OBJECT = ENVI_HEADER
/* This Targeted Empirical Record label describes a
multiple-band */
/* image file containing calibrated and corrected
spectral data */
/* in units of corrected I over
F. */
OBJECT = IMAGE
LINES = 540
LINE_SAMPLES = 640
SAMPLE_TYPE = PC_REAL
SAMPLE_BITS = 32
UNIT = "CORRECTED_I_OVER_F"
BANDS = 545
BAND_STORAGE_TYPE = BAND_SEQUENTIAL
END_OBJECT = IMAGE
END
PDS_VERSION_ID = PDS3
RECORD_TYPE = FIXED_LENGTH
RECORD_BYTES = 2560
FILE_RECORDS = 4860
LABEL_REVISION_NOTE =
"2012-03-06, H. Taylor, F. Seelos (JHU/APL)
Initial TER/MTRDR labels for CRISM Data Users' Workshop;
2014-01-09, G. Romeo, J. Aiello, F. Seelos (JHU/APL)
Complete TER/MTRDR label set for preliminary PDS review;
2014-04-08, G. Romeo, J. Aiello, R. Espiritu, F. Seelos
(JHU/APL)
TER/MTRDR label set revisions completed for PDS peer review;
2014-08-14, G. Romeo, J. Aiello, F. Seelos (JHU/APL)
PDS peer review TER/MTRDR label set liens retired;"
^ENVI_HEADER =
"FRT00002F7F_07_IN168J_TER3.HDR"
^IMAGE =
"FRT00002F7F_07_IN168J_TER3.IMG"
/* DDR Identification */
DATA_SET_ID =
"MRO-M-CRISM-4-RDR-TARGETED-V1.0"
PRODUCT_ID =
"FRT00002F7F_07_IN168J_TER3"
/*
cccnnnnnnnn_xx_ooaaas_TERv */
/* ccc = Class
Type */
/* nnnnnnnn = Observation ID
(hex) */
/* xx = counter this observation
(hex) */
/* ooaaa = obs type, macro
number */
/* s = sensor ID (J for
Joined) */
/* v = version
number */
INSTRUMENT_HOST_NAME = "MARS RECONNAISSANCE
ORBITER"
SPACECRAFT_ID = MRO
INSTRUMENT_NAME = "COMPACT RECONNAISSANCE
IMAGING
SPECTROMETER FOR MARS"
INSTRUMENT_ID = CRISM
TARGET_NAME = MARS
PRODUCT_TYPE = TARGETED_RDR
PRODUCT_CREATION_TIME = 2015-06-10T16:40:53
START_TIME = 2006-11-11T13:21:36.054
STOP_TIME = 2006-11-11T13:23:59.788
SPACECRAFT_CLOCK_START_COUNT = "2/0847718514.58200"
SPACECRAFT_CLOCK_STOP_COUNT = "2/0847718658.40771"
ORBIT_NUMBER = 1374
OBSERVATION_TYPE = "FRT"
OBSERVATION_ID = "16#00002F7F#"
MRO:OBSERVATION_NUMBER = 16#07#
MRO:ACTIVITY_ID = "IF168"
MRO:SENSOR_ID = "J"
PRODUCT_VERSION_ID = "3"
PRODUCER_INSTITUTION_NAME = "JOHNS HOPKINS UNIVERSITY
APPLIED PHYSICS LABORATORY"
SOFTWARE_NAME = "mtrdr_pipeline"
SOFTWARE_VERSION_ID = "1.0"
SOURCE_PRODUCT_ID = (
"FRT00002F7F_07_DE168L_DDR1",
"FRT00002F7F_07_DE168S_DDR1",
"FRT00002F7F_07_IF168J_TER3"
)
/* Targeted RDR Observation and Processing Parameters */
SOLAR_DISTANCE = 236036552.409150 <KILOMETER>
SOLAR_LONGITUDE = 133.840086
MRO:PHOTOMETRIC_CORR_FLAG = "ON"
MRO:ATMOSPHERIC_CORR_FLAG = "ON"
MRO:RATIO_SHIFT_CORR_FLAG = "ON"
MRO:EMPIRICAL_GEOM_NORM_FLAG = "ON"
MRO:EMPIRICAL_SMILE_CORR_FLAG = "ON"
MRO:SENSOR_SPACE_TRANSFORM_FLAG = "ON"
/* ENVI header description */
/* The ENVI header is a separate ASCII file that includes basic
image */
/* data file characteristics and allows the image data to be
loaded */
/* directly into the ENVI image processing software available
bands */
/*
list. */
OBJECT = ENVI_HEADER
HEADER_TYPE = "ENVI"
INTERCHANGE_FORMAT = "ASCII"
BYTES = 664
DESCRIPTION = "This text file can be used by
ENVI image
processing software to read in the image."
END_OBJECT = ENVI_HEADER
/* This Targeted Empirical Record label describes a multiple-band
*/
/* image file containing TER/MTRDR data processing information.
*/
OBJECT = IMAGE
LINES = 540
LINE_SAMPLES = 640
SAMPLE_TYPE = PC_REAL
SAMPLE_BITS = 32
DESCRIPTION =
"TER_MTRDR_PROCESSING_INFORMATION"
BANDS = 9
BAND_STORAGE_TYPE = BAND_SEQUENTIAL
BAND_NAME = ( "VNIR/IR Spectral Continuity
Residual",
"VNIR/IR Spatial Gradient
Residual",
"ATM Correction Spectral Shift
Artifact",
"VNIR Sample",
"VNIR Line",
"IR Sample",
"IR Line",
"VNIR/IR Ground Sampling
Offset",
"VNIR/IR Mask" )
END_OBJECT = IMAGE
END
PDS_VERSION_ID = PDS3
RECORD_TYPE = FIXED_LENGTH
RECORD_BYTES = 2560
FILE_RECORDS = 32400
LABEL_REVISION_NOTE =
"2012-03-06, H. Taylor, F. Seelos (JHU/APL)
Initial TER/MTRDR labels for CRISM Data Users' Workshop;
2014-01-09, G. Romeo, J. Aiello, F. Seelos (JHU/APL)
Complete TER/MTRDR label set for preliminary PDS review;
2014-04-08, G. Romeo, J. Aiello, R. Espiritu, F. Seelos (JHU/APL)
TER/MTRDR label set revisions completed for PDS peer review;
2014-08-14, G. Romeo, J. Aiello, F. Seelos (JHU/APL)
PDS peer review TER/MTRDR label set liens retired;"
^ENVI_HEADER = "FRT00002F7F_07_SR168J_TER3.HDR"
^IMAGE = "FRT00002F7F_07_SR168J_TER3.IMG"
/* DDR Identification */
DATA_SET_ID = "MRO-M-CRISM-4-RDR-TARGETED-V1.0"
PRODUCT_ID = "FRT00002F7F_07_SR168J_TER3"
/* cccnnnnnnnn_xx_ooaaas_TERv */
/* ccc = Class Type */
/* nnnnnnnn = Observation ID (hex) */
/* xx = counter this observation (hex) */
/* ooaaa = obs type, macro number */
/* s = sensor ID (J for Joined) */
/* v = version number */
INSTRUMENT_HOST_NAME = "MARS RECONNAISSANCE ORBITER"
SPACECRAFT_ID = MRO
INSTRUMENT_NAME = "COMPACT RECONNAISSANCE IMAGING
SPECTROMETER FOR MARS"
INSTRUMENT_ID = CRISM
TARGET_NAME = MARS
PRODUCT_TYPE = TARGETED_RDR
PRODUCT_CREATION_TIME = 2015-06-11T04:42:23
START_TIME = 2006-11-11T13:21:36.054
STOP_TIME = 2006-11-11T13:23:59.788
SPACECRAFT_CLOCK_START_COUNT = "2/0847718514.58200"
SPACECRAFT_CLOCK_STOP_COUNT = "2/0847718658.40771"
ORBIT_NUMBER = 1374
OBSERVATION_TYPE = "FRT"
OBSERVATION_ID = "16#00002F7F#"
MRO:OBSERVATION_NUMBER = 16#07#
MRO:ACTIVITY_ID = "IF168"
MRO:SENSOR_ID = "J"
PRODUCT_VERSION_ID = "3"
PRODUCER_INSTITUTION_NAME = "JOHNS HOPKINS UNIVERSITY
APPLIED PHYSICS LABORATORY"
SOFTWARE_NAME = "mtrdr_pipeline"
SOFTWARE_VERSION_ID = "1.0"
SOURCE_PRODUCT_ID = (
"FRT00002F7F_07_SU168J_TER3"
)
/* Targeted RDR Observation and Processing Parameters */
SOLAR_DISTANCE = 236036552.409150 <KILOMETER>
SOLAR_LONGITUDE = 133.840086
MRO:PHOTOMETRIC_CORR_FLAG = "ON"
MRO:ATMOSPHERIC_CORR_FLAG = "ON"
MRO:RATIO_SHIFT_CORR_FLAG = "ON"
MRO:EMPIRICAL_GEOM_NORM_FLAG = "ON"
MRO:EMPIRICAL_SMILE_CORR_FLAG = "ON"
MRO:SENSOR_SPACE_TRANSFORM_FLAG = "ON"
/* ENVI header description */
/* The ENVI header is a separate ASCII file that includes basic image */
/* data file characteristics and allows the image data to be loaded */
/* directly into the ENVI image processing software available bands */
/* list. */
OBJECT = ENVI_HEADER
HEADER_TYPE = "ENVI"
INTERCHANGE_FORMAT = "ASCII"
BYTES = 987
DESCRIPTION = "This text file can be used by ENVI image
processing software to read in the image."
END_OBJECT = ENVI_HEADER
/* This Targeted Empirical Record label describes a multiple-band */
/* image file containing refined spectral summary parameters */
/* calculated from calibrated and corrected spectral data. */
OBJECT = IMAGE
LINES = 540
LINE_SAMPLES = 640
SAMPLE_TYPE = PC_REAL
SAMPLE_BITS = 32
DESCRIPTION = "REFINED_SPECTRAL_SUMMARY_PARAMETERS"
BANDS = 60
BAND_STORAGE_TYPE = BAND_SEQUENTIAL
BAND_NAME = ( "R770",
"RBR",
"BD530_2",
"SH600_2",
"SH770",
"BD640_2",
"BD860_2",
"BD920_2",
"RPEAK1",
"BDI1000VIS",
"R440",
"IRR1",
"BDI1000IR",
"OLINDEX3",
"R1330" for v0-v3,
"R1337" for v4,
"BD1300",
"LCPINDEX2",
"HCPINDEX2",
"VAR",
"ISLOPE1",
"BD1400",
"BD1435",
"BD1500_2",
"ICER1_2",
"BD1750_2",
"BD1900_2",
"BD1900R2",
"BDI2000",
"BD2100_2",
"BD2165",
"BD2190",
"MIN2200",
"BD2210_2",
"D2200",
"BD2230",
"BD2250",
"MIN2250",
"BD2265",
"BD2290",
"D2300",
"BD2355",
"SINDEX2",
"ICER2_2",
"MIN2295_2480",
"MIN2345_2537",
"BD2500_2",
"BD3000",
"BD3100",
"BD3200",
"BD3400_2",
"CINDEX2",
"BD2600",
"IRR2",
"IRR3",
"R530",
"R600",
"R1080",
"R1506",
"R2529",
"R3920" )
END_OBJECT = IMAGE
END
PDS_VERSION_ID = PDS3
RECORD_TYPE = FIXED_LENGTH
RECORD_BYTES = 2560
FILE_RECORDS = 32400
LABEL_REVISION_NOTE =
"2012-03-06, H. Taylor, F. Seelos (JHU/APL)
Initial TER/MTRDR labels for CRISM Data Users' Workshop;
2014-01-09, G. Romeo, J. Aiello, F. Seelos (JHU/APL)
Complete TER/MTRDR label set for preliminary PDS review;
2014-04-08, G. Romeo, J. Aiello, R. Espiritu, F. Seelos (JHU/APL)
TER/MTRDR label set revisions completed for PDS peer review;
2014-08-14, G. Romeo, J. Aiello, F. Seelos (JHU/APL)
PDS peer review TER/MTRDR label set liens retired;"
^ENVI_HEADER = "FRT00002F7F_07_SU168J_TER3.HDR"
^IMAGE = "FRT00002F7F_07_SU168J_TER3.IMG"
/* DDR Identification */
DATA_SET_ID = "MRO-M-CRISM-4-RDR-TARGETED-V1.0"
PRODUCT_ID = "FRT00002F7F_07_SU168J_TER3"
/* cccnnnnnnnn_xx_ooaaas_TERv */
/* ccc = Class Type */
/* nnnnnnnn = Observation ID (hex) */
/* xx = counter this observation (hex) */
/* ooaaa = obs type, macro number */
/* s = sensor ID (J for Joined) */
/* v = version number */
INSTRUMENT_HOST_NAME = "MARS RECONNAISSANCE ORBITER"
SPACECRAFT_ID = MRO
INSTRUMENT_NAME = "COMPACT RECONNAISSANCE IMAGING
SPECTROMETER FOR MARS"
INSTRUMENT_ID = CRISM
TARGET_NAME = MARS
PRODUCT_TYPE = TARGETED_RDR
PRODUCT_CREATION_TIME = 2015-06-11T02:24:10
START_TIME = 2006-11-11T13:21:36.054
STOP_TIME = 2006-11-11T13:23:59.788
SPACECRAFT_CLOCK_START_COUNT = "2/0847718514.58200"
SPACECRAFT_CLOCK_STOP_COUNT = "2/0847718658.40771"
ORBIT_NUMBER = 1374
OBSERVATION_TYPE = "FRT"
OBSERVATION_ID = "16#00002F7F#"
MRO:OBSERVATION_NUMBER = 16#07#
MRO:ACTIVITY_ID = "IF168"
MRO:SENSOR_ID = "J"
PRODUCT_VERSION_ID = "3"
PRODUCER_INSTITUTION_NAME = "JOHNS HOPKINS UNIVERSITY
APPLIED PHYSICS LABORATORY"
SOFTWARE_NAME = "mtrdr_pipeline"
SOFTWARE_VERSION_ID = "1.0"
SOURCE_PRODUCT_ID = (
"FRT00002F7F_07_IF168J_TER3"
)
/* Targeted RDR Observation and Processing Parameters */
SOLAR_DISTANCE = 236036552.409150 <KILOMETER>
SOLAR_LONGITUDE = 133.840086
MRO:PHOTOMETRIC_CORR_FLAG = "ON"
MRO:ATMOSPHERIC_CORR_FLAG = "ON"
MRO:RATIO_SHIFT_CORR_FLAG = "ON"
MRO:EMPIRICAL_GEOM_NORM_FLAG = "ON"
MRO:EMPIRICAL_SMILE_CORR_FLAG = "ON"
MRO:SENSOR_SPACE_TRANSFORM_FLAG = "ON"
/* ENVI header description */
/* The ENVI header is a separate ASCII file that includes basic image */
/* data file characteristics and allows the image data to be loaded */
/* directly into the ENVI image processing software available bands */
/* list. */
OBJECT = ENVI_HEADER
HEADER_TYPE = "ENVI"
INTERCHANGE_FORMAT = "ASCII"
BYTES = 987
DESCRIPTION = "This text file can be used by ENVI image
processing software to read in the image."
END_OBJECT = ENVI_HEADER
/* This Targeted Empirical Record label describes a multiple-band */
/* image file containing spectral summary parameters calculated */
/* from calibrated and corrected spectral data. */
OBJECT = IMAGE
LINES = 540
LINE_SAMPLES = 640
SAMPLE_TYPE = PC_REAL
SAMPLE_BITS = 32
DESCRIPTION = "SPECTRAL_SUMMARY_PARAMETERS"
BANDS = 60
BAND_STORAGE_TYPE = BAND_SEQUENTIAL
BAND_NAME = ( "R770",
"RBR",
"BD530_2",
"SH600_2",
"SH770",
"BD640_2",
"BD860_2",
"BD920_2",
"RPEAK1",
"BDI1000VIS",
"R440",
"IRR1",
"BDI1000IR",
"OLINDEX3",
"R1330",
"BD1300",
"LCPINDEX2",
"HCPINDEX2",
"VAR",
"ISLOPE1",
"BD1400",
"BD1435",
"BD1500_2",
"ICER1_2",
"BD1750_2",
"BD1900_2",
"BD1900R2",
"BDI2000",
"BD2100_2",
"BD2165",
"BD2190",
"MIN2200",
"BD2210_2",
"D2200",
"BD2230",
"BD2250",
"MIN2250",
"BD2265",
"BD2290",
"D2300",
"BD2355",
"SINDEX2",
"ICER2_2",
"MIN2295_2480",
"MIN2345_2537",
"BD2500_2",
"BD3000",
"BD3100",
"BD3200",
"BD3400_2",
"CINDEX2",
"BD2600",
"IRR2",
"IRR3",
"R530",
"R600",
"R1080",
"R1506",
"R2529",
"R3920" )
END_OBJECT = IMAGE
END
PDS_VERSION_ID = PDS3
RECORD_TYPE = FIXED_LENGTH
RECORD_BYTES = 30
FILE_RECORDS = 545
LABEL_REVISION_NOTE =
"2012-03-06, H. Taylor, F. Seelos (JHU/APL)
Initial TER/MTRDR labels for CRISM Data Users' Workshop;
2014-01-09, G. Romeo, J. Aiello, F. Seelos (JHU/APL)
Complete TER/MTRDR label set for preliminary PDS review;
2014-04-08, G. Romeo, J. Aiello, R. Espiritu, F. Seelos (JHU/APL)
TER/MTRDR label set revisions completed for PDS peer review;
2014-08-14, G. Romeo, J. Aiello, F. Seelos (JHU/APL)
PDS peer review TER/MTRDR label set liens retired;"
^WAVELENGTH_SOURCE_TABLE = "FRT00002F7F_07_WV168J_TER3.TAB"
/* Map-Projected Targeted RDR Identification */
DATA_SET_ID = "MRO-M-CRISM-4-RDR-TARGETED-V1.0"
PRODUCT_ID = "FRT00002F7F_07_WV168J_TER3"
/* cccnnnnnnnn_xx_ooaaas_TERv */
/* ccc = Class Type */
/* nnnnnnnn = Observation ID, hexadecimal */
/* xx = counter this observation (hex) */
/* ooaaa = Image type, Macro number */
/* s = Sensor ID (J for Joined) */
/* v = Version number */
INSTRUMENT_HOST_NAME = "MARS RECONNAISSANCE ORBITER"
SPACECRAFT_ID = MRO
INSTRUMENT_NAME = "COMPACT RECONNAISSANCE IMAGING
SPECTROMETER FOR MARS"
INSTRUMENT_ID = CRISM
TARGET_NAME = MARS
PRODUCT_TYPE = TARGETED_RDR
PRODUCT_CREATION_TIME = 2015-06-10T16:38:51
START_TIME = 2006-11-11T13:21:36.054
STOP_TIME = 2006-11-11T13:23:59.788
SPACECRAFT_CLOCK_START_COUNT = "2/0847718514.58200"
SPACECRAFT_CLOCK_STOP_COUNT = "2/0847718658.40771"
PRODUCT_VERSION_ID = "3"
PRODUCER_INSTITUTION_NAME = "JOHNS HOPKINS UNIVERSITY
APPLIED PHYSICS LABORATORY"
SOFTWARE_NAME = "mtrdr_pipeline"
SOFTWARE_VERSION_ID = "1.0"
/* A listfile including spectrometer identifier, detector row numbers,*/
/* wavelengths, full width half max, and bad band identifier in the*/
/* Targeted Empirical Record and Map-Projected Targeted RDR images. */
OBJECT = WAVELENGTH_SOURCE_TABLE
NAME = "CRISM JOINED WAVELENGTH TABLE"
INTERCHANGE_FORMAT = "ASCII"
ROWS = 545
COLUMNS = 5
ROW_BYTES = 30
DESCRIPTION = "CRISM JOINED WAVELENGTH table"
OBJECT = COLUMN
COLUMN_NUMBER = 1
NAME = SPECT_ID
DATA_TYPE = ASCII_INTEGER
START_BYTE = 1
BYTES = 2
DESCRIPTION = "Spectrometer identifier; 0 = IR; 1 = VNIR"
END_OBJECT = COLUMN
OBJECT = COLUMN
COLUMN_NUMBER = 2
NAME = ROWNUM
DATA_TYPE = ASCII_INTEGER
START_BYTE = 4
BYTES = 4
DESCRIPTION = "detector row number (0-479)"
END_OBJECT = COLUMN
OBJECT = COLUMN
COLUMN_NUMBER = 3
NAME = SAMPL_WAV
DATA_TYPE = ASCII_REAL
START_BYTE = 9
BYTES = 8
DESCRIPTION = "Standard sampling center wavelength in nm"
UNIT = "NM"
END_OBJECT = COLUMN
OBJECT = COLUMN
COLUMN_NUMBER = 4
NAME = FWHM
DATA_TYPE = ASCII_REAL
START_BYTE = 18
BYTES = 8
DESCRIPTION = "Full Width Half Max in nm"
UNIT = "NM"
END_OBJECT = COLUMN
OBJECT = COLUMN
COLUMN_NUMBER = 5
NAME = BAD_BAND_ID
DATA_TYPE = ASCII_INTEGER
START_BYTE = 27
BYTES = 2
DESCRIPTION = "Bad Band Identifier; 0 = BAD; 1 = GOOD"
END_OBJECT = COLUMN
END_OBJECT = WAVELENGTH_SOURCE_TABLE
END
PDS_VERSION_ID = PDS3
RECORD_TYPE = FIXED_LENGTH
RECORD_BYTES = 3520
FILE_RECORDS = 372129
LABEL_REVISION_NOTE =
"2012-03-06, H. Taylor, F. Seelos (JHU/APL)
Initial TER/MTRDR labels for CRISM Data Users'
Workshop;
2014-01-09, G. Romeo, J. Aiello, F. Seelos
(JHU/APL)
Complete TER/MTRDR label set for preliminary
PDS review;
2014-04-08, G. Romeo, J. Aiello, R. Espiritu,
F. Seelos (JHU/APL)
TER/MTRDR label set revisions completed for PDS
peer review;
2014-08-14, G. Romeo, J. Aiello, F. Seelos
(JHU/APL)
PDS peer review TER/MTRDR label set liens
retired;"
^ENVI_HEADER =
"FRT00002F7F_07_IF168J_MTR3.HDR"
^IMAGE =
"FRT00002F7F_07_IF168J_MTR3.IMG"
/* Map-Projected Targeted RDR Identification */
DATA_SET_ID =
"MRO-M-CRISM-5-RDR-MPTARGETED-V1.0"
PRODUCT_ID = "FRT00002F7F_07_IF168J_MTR3"
/*
cccnnnnnnnn_xx_ooaaas_MTRv */
/* ccc = Class
Type */
/* nnnnnnnn =
Observation ID, hexadecimal */
/* xx = counter this
observation (hex) */
/* ooaaa = Image
type, Macro number */
/* s = Sensor ID (J
for Joined) */
/* v = Version
number */
INSTRUMENT_HOST_NAME = "MARS
RECONNAISSANCE ORBITER"
SPACECRAFT_ID = MRO
INSTRUMENT_NAME = "COMPACT
RECONNAISSANCE IMAGING
SPECTROMETER FOR
MARS"
INSTRUMENT_ID = CRISM
TARGET_NAME = MARS
PRODUCT_TYPE = MPTARGETED_RDR
PRODUCT_CREATION_TIME = 2015-06-11T20:19:43
START_TIME =
2006-11-11T13:21:36.054
STOP_TIME =
2006-11-11T13:23:59.788
SPACECRAFT_CLOCK_START_COUNT =
"2/0847718514.58200"
SPACECRAFT_CLOCK_STOP_COUNT =
"2/0847718658.40771"
ORBIT_NUMBER = 1374
OBSERVATION_TYPE = "FRT"
OBSERVATION_ID =
"16#00002F7F#"
MRO:OBSERVATION_NUMBER = 16#07#
MRO:ACTIVITY_ID = "IF168"
MRO:SENSOR_ID = "J"
/* Detector and FPE temperature refer to IR
component of observation */
MRO:DETECTOR_TEMPERATURE = -163.287
MRO:OPTICAL_BENCH_TEMPERATURE = -52.315
MRO:SPECTROMETER_HOUSING_TEMP = -75.764
MRO:SPHERE_TEMPERATURE = -52.275
MRO:FPE_TEMPERATURE = -0.375
PRODUCT_VERSION_ID = "3"
PRODUCER_INSTITUTION_NAME = "JOHNS HOPKINS
UNIVERSITY
APPLIED PHYSICS
LABORATORY"
SOFTWARE_NAME =
"mtrdr_pipeline"
SOFTWARE_VERSION_ID = "1.0"
SOURCE_PRODUCT_ID = (
"FRT00002F7F_07_IF168J_TER3",
"FRT00002F7F_07_DE168L_DDR1"
)
/* Targeted RDR Observation and Processing
Parameters */
SOLAR_DISTANCE = 236036552.409150
<KILOMETER>
SOLAR_LONGITUDE = 133.840086
MRO:WAVELENGTH_FILE_NAME =
"FRT00002F7F_07_WV168J_MTR3.TAB"
MRO:PHOTOMETRIC_CORR_FLAG = "ON"
MRO:ATMOSPHERIC_CORR_FLAG = "ON"
MRO:RATIO_SHIFT_CORR_FLAG = "ON"
MRO:EMPIRICAL_GEOM_NORM_FLAG = "ON"
MRO:EMPIRICAL_SMILE_CORR_FLAG = "ON"
MRO:SENSOR_SPACE_TRANSFORM_FLAG = "ON"
/* Map projection information about this RDR is in
the */
/* IMAGE_MAP_PROJECTION object
below. */
OBJECT =
IMAGE_MAP_PROJECTION
^DATA_SET_MAP_PROJECTION =
"MTR_MAP.CAT"
MAP_PROJECTION_TYPE = "POLAR
STEREOGRAPHIC"
A_AXIS_RADIUS = 3396.190000000000
<KILOMETER>
B_AXIS_RADIUS = 3396.190000000000
<KILOMETER>
C_AXIS_RADIUS = 3376.200000000000
<KILOMETER>
POSITIVE_LONGITUDE_DIRECTION = EAST
CENTER_LATITUDE = 90.0000000
<DEGREE>
CENTER_LONGITUDE = 0.0000000
<DEGREE>
LINE_FIRST_PIXEL = 1
<PIXEL>
LINE_LAST_PIXEL = 761
<PIXEL>
SAMPLE_FIRST_PIXEL = 1
<PIXEL>
SAMPLE_LAST_PIXEL = 880
<PIXEL>
MAP_PROJECTION_ROTATION = 0.0000000
<DEGREE>
MAP_RESOLUTION = 3293.0387513
MAP_SCALE = 0.0180000
MINIMUM_LATITUDE = 84.8928520
<DEGREE>
MAXIMUM_LATITUDE = 85.2014640
<DEGREE>
WESTERNMOST_LONGITUDE = -22.8965470
<DEGREE>
EASTERNMOST_LONGITUDE = -19.0829150
<DEGREE>
LINE_PROJECTION_OFFSET = -14945.9116667
<PIXEL>
SAMPLE_PROJECTION_OFFSET = 6313.7611111
<PIXEL>
COORDINATE_SYSTEM_TYPE = "BODY-FIXED
ROTATING"
COORDINATE_SYSTEM_NAME =
"PLANETOCENTRIC"
END_OBJECT =
IMAGE_MAP_PROJECTION
/* ENVI header description */
/* The ENVI header is a separate ASCII file that
includes basic image */
/* data file characteristics and allows the image
data to be loaded */
/* directly into the ENVI image processing software
available bands */
/*
list. */
OBJECT = ENVI_HEADER
HEADER_TYPE = "ENVI"
INTERCHANGE_FORMAT = "ASCII"
BYTES = 14781
DESCRIPTION = "This text file can
be used by ENVI image
processing software to read in the
image."
END_OBJECT = ENVI_HEADER
/* This Map-Projected Targeted RDR label describes a
multiple-band */
/* image file containing calibrated and corrected
spectral data */
/* in units of corrected I over
F. */
OBJECT = IMAGE
LINES = 761
LINE_SAMPLES = 880
SAMPLE_TYPE = PC_REAL
SAMPLE_BITS = 32
UNIT = "CORRECTED_I_OVER_F"
BANDS = 489
BAND_STORAGE_TYPE = BAND_SEQUENTIAL
END_OBJECT = IMAGE
END
PDS_VERSION_ID = PDS3
RECORD_TYPE = FIXED_LENGTH
RECORD_BYTES = 3520
FILE_RECORDS = 6849
LABEL_REVISION_NOTE =
"2012-03-06, H. Taylor, F. Seelos (JHU/APL)
Initial TER/MTRDR labels for CRISM Data Users' Workshop;
2014-01-09, G. Romeo, J. Aiello, F. Seelos (JHU/APL)
Complete TER/MTRDR label set for preliminary PDS review;
2014-04-08, G. Romeo, J. Aiello, R. Espiritu, F. Seelos (JHU/APL)
TER/MTRDR label set revisions completed for PDS peer review;
2014-08-14, G. Romeo, J. Aiello, F. Seelos (JHU/APL)
PDS peer review TER/MTRDR label set liens retired;"
^ENVI_HEADER = "FRT00002F7F_07_IN168J_MTR3.HDR"
^IMAGE = "FRT00002F7F_07_IN168J_MTR3.IMG"
/* DDR Identification */
DATA_SET_ID = "MRO-M-CRISM-5-RDR-MPTARGETED-V1.0"
PRODUCT_ID = "FRT00002F7F_07_IN168J_MTR3"
/* cccnnnnnnnn_xx_ooaaas_MTRv */
/* ccc = Class Type */
/* nnnnnnnn = Observation ID (hex) */
/* xx = counter this observation (hex) */
/* ooaaa = obs type, macro number */
/* s = sensor ID (J for Joined) */
/* v = version number */
INSTRUMENT_HOST_NAME = "MARS RECONNAISSANCE ORBITER"
SPACECRAFT_ID = MRO
INSTRUMENT_NAME = "COMPACT RECONNAISSANCE IMAGING
SPECTROMETER FOR MARS"
INSTRUMENT_ID = CRISM
TARGET_NAME = MARS
PRODUCT_TYPE = MPTARGETED_RDR
PRODUCT_CREATION_TIME = 2015-06-11T20:21:43
START_TIME = 2006-11-11T13:21:36.054
STOP_TIME = 2006-11-11T13:23:59.788
SPACECRAFT_CLOCK_START_COUNT = "2/0847718514.58200"
SPACECRAFT_CLOCK_STOP_COUNT = "2/0847718658.40771"
ORBIT_NUMBER = 1374
OBSERVATION_TYPE = "FRT"
OBSERVATION_ID = "16#00002F7F#"
MRO:OBSERVATION_NUMBER = 16#07#
MRO:ACTIVITY_ID = "IF168"
MRO:SENSOR_ID = "J"
PRODUCT_VERSION_ID = "3"
PRODUCER_INSTITUTION_NAME = "JOHNS HOPKINS UNIVERSITY
APPLIED PHYSICS LABORATORY"
SOFTWARE_NAME = "mtrdr_pipeline"
SOFTWARE_VERSION_ID = "1.0"
SOURCE_PRODUCT_ID = (
"FRT00002F7F_07_DE168L_DDR1",
"FRT00002F7F_07_DE168S_DDR1",
"FRT00002F7F_07_IF168J_MTR3"
)
/* Targeted RDR Observation and Processing Parameters */
SOLAR_DISTANCE = 236036552.409150 <KILOMETER>
SOLAR_LONGITUDE = 133.840086
MRO:PHOTOMETRIC_CORR_FLAG = "ON"
MRO:ATMOSPHERIC_CORR_FLAG = "ON"
MRO:RATIO_SHIFT_CORR_FLAG = "ON"
MRO:EMPIRICAL_GEOM_NORM_FLAG = "ON"
MRO:EMPIRICAL_SMILE_CORR_FLAG = "ON"
MRO:SENSOR_SPACE_TRANSFORM_FLAG = "ON"
/* Map projection information about this RDR is in the */
/* IMAGE_MAP_PROJECTION object below. */
OBJECT = IMAGE_MAP_PROJECTION
^DATA_SET_MAP_PROJECTION = "MTR_MAP.CAT"
MAP_PROJECTION_TYPE = "POLAR STEREOGRAPHIC"
A_AXIS_RADIUS = 3396.190000000000 <KILOMETER>
B_AXIS_RADIUS = 3396.190000000000 <KILOMETER>
C_AXIS_RADIUS = 3376.200000000000 <KILOMETER>
POSITIVE_LONGITUDE_DIRECTION = EAST
CENTER_LATITUDE = 90.0000000 <DEGREE>
CENTER_LONGITUDE = 0.0000000 <DEGREE>
LINE_FIRST_PIXEL = 1 <PIXEL>
LINE_LAST_PIXEL = 761 <PIXEL>
SAMPLE_FIRST_PIXEL = 1 <PIXEL>
SAMPLE_LAST_PIXEL = 880 <PIXEL>
MAP_PROJECTION_ROTATION = 0.0000000 <DEGREE>
MAP_RESOLUTION = 3293.0387513
MAP_SCALE = 0.0180000
MINIMUM_LATITUDE = 84.8928520 <DEGREE>
MAXIMUM_LATITUDE = 85.2014640 <DEGREE>
WESTERNMOST_LONGITUDE = -22.8965470 <DEGREE>
EASTERNMOST_LONGITUDE = -19.0829150 <DEGREE>
LINE_PROJECTION_OFFSET = -14945.9116667 <PIXEL>
SAMPLE_PROJECTION_OFFSET = 6313.7611111 <PIXEL>
COORDINATE_SYSTEM_TYPE = "BODY-FIXED ROTATING"
COORDINATE_SYSTEM_NAME = "PLANETOCENTRIC"
END_OBJECT = IMAGE_MAP_PROJECTION
/* ENVI header description */
/* The ENVI header is a separate ASCII file that includes basic image */
/* data file characteristics and allows the image data to be loaded */
/* directly into the ENVI image processing software available bands */
/* list. */
OBJECT = ENVI_HEADER
HEADER_TYPE = "ENVI"
INTERCHANGE_FORMAT = "ASCII"
BYTES = 1418
DESCRIPTION = "This text file can be used by ENVI image
processing software to read in the image."
END_OBJECT = ENVI_HEADER
/* This Map-Projected Targeted RDR label describes a multiple-band */
/* image file containing TER/MTRDR data processing information. */
OBJECT = IMAGE
LINES = 761
LINE_SAMPLES = 880
SAMPLE_TYPE = PC_REAL
SAMPLE_BITS = 32
DESCRIPTION = "TER_MTRDR_PROCESSING_INFORMATION"
BANDS = 9
BAND_STORAGE_TYPE = BAND_SEQUENTIAL
BAND_NAME = ( "VNIR/IR Spectral Continuity Residual",
"VNIR/IR Spatial Gradient Residual",
"ATM Correction Spectral Shift Artifact",
"VNIR Sample",
"VNIR Line",
"IR Sample",
"IR Line",
"VNIR/IR Ground Sampling Offset",
"VNIR/IR Mask" )
END_OBJECT = IMAGE
END
PDS_VERSION_ID = PDS3
RECORD_TYPE = FIXED_LENGTH
RECORD_BYTES = 3520
FILE_RECORDS = 10654
LABEL_REVISION_NOTE =
"2012-03-06, H. Taylor, F. Seelos (JHU/APL)
Initial TER/MTRDR labels for CRISM Data Users' Workshop;
2014-01-09, G. Romeo, J. Aiello, F. Seelos (JHU/APL)
Complete TER/MTRDR label set for preliminary PDS review;
2014-04-08, G. Romeo, J. Aiello, R. Espiritu, F. Seelos (JHU/APL)
TER/MTRDR label set revisions completed for PDS peer review;
2014-08-14, G. Romeo, J. Aiello, F. Seelos (JHU/APL)
PDS peer review TER/MTRDR label set liens retired;"
^ENVI_HEADER = "FRT00002F7F_07_DE168L_MTR1.HDR"
^IMAGE = "FRT00002F7F_07_DE168L_MTR1.IMG"
/* DDR Identification */
DATA_SET_ID = "MRO-M-CRISM-5-RDR-MPTARGETED-V1.0"
PRODUCT_ID = "FRT00002F7F_07_DE168L_MTR1"
/* cccnnnnnnnn_xx_ooaaas_MTRv */
/* ccc = Class Type */
/* nnnnnnnn = Observation ID (hex) */
/* xx = counter this observation (hex) */
/* ooaaa = obs type, macro number */
/* s = sensor ID (J for Joined) */
/* v = version number */
INSTRUMENT_HOST_NAME = "MARS RECONNAISSANCE ORBITER"
SPACECRAFT_ID = MRO
INSTRUMENT_NAME = "COMPACT RECONNAISSANCE IMAGING
SPECTROMETER FOR MARS"
INSTRUMENT_ID = CRISM
TARGET_NAME = MARS
PRODUCT_TYPE = MAP_PROJECTED_DDR
PRODUCT_CREATION_TIME = 2015-06-11T20:21:39
START_TIME = 2006-11-11T13:21:36.055
STOP_TIME = 2006-11-11T13:23:59.789
SPACECRAFT_CLOCK_START_COUNT = "2/847718514:58200"
SPACECRAFT_CLOCK_STOP_COUNT = "2/847718658:40771"
ORBIT_NUMBER = 1374
OBSERVATION_TYPE = "FRT"
OBSERVATION_ID = "16#00002F7F#"
MRO:OBSERVATION_NUMBER = 16#07#
MRO:ACTIVITY_ID = "DE168"
MRO:SENSOR_ID = "L"
PRODUCT_VERSION_ID = "1"
PRODUCER_INSTITUTION_NAME = "JOHNS HOPKINS UNIVERSITY
APPLIED PHYSICS LABORATORY"
SOFTWARE_NAME = "mtrdr_pipeline"
SOFTWARE_VERSION_ID = "1.0"
SOURCE_PRODUCT_ID = (
"FRT00002F7F_07_DE168L_DDR1"
)
/* DDR Instrument and Observation Parameters */
TARGET_CENTER_DISTANCE = 3691.650462 <KILOMETER>
/* distance to Mars center at first frame */
SOLAR_DISTANCE = 236035146.305619 <KILOMETER>
SOLAR_LONGITUDE = 133.839681
/* Map projection information about this RDR is in the */
/* IMAGE_MAP_PROJECTION object below. */
OBJECT = IMAGE_MAP_PROJECTION
^DATA_SET_MAP_PROJECTION = "MTR_MAP.CAT"
MAP_PROJECTION_TYPE = "POLAR STEREOGRAPHIC"
A_AXIS_RADIUS = 3396.190000000000 <KILOMETER>
B_AXIS_RADIUS = 3396.190000000000 <KILOMETER>
C_AXIS_RADIUS = 3376.200000000000 <KILOMETER>
POSITIVE_LONGITUDE_DIRECTION = EAST
CENTER_LATITUDE = 90.0000000 <DEGREE>
CENTER_LONGITUDE = 0.0000000 <DEGREE>
LINE_FIRST_PIXEL = 1 <PIXEL>
LINE_LAST_PIXEL = 761 <PIXEL>
SAMPLE_FIRST_PIXEL = 1 <PIXEL>
SAMPLE_LAST_PIXEL = 880 <PIXEL>
MAP_PROJECTION_ROTATION = 0.0000000 <DEGREE>
MAP_RESOLUTION = 3293.0387513
MAP_SCALE = 0.0180000
MINIMUM_LATITUDE = 84.8928520 <DEGREE>
MAXIMUM_LATITUDE = 85.2014640 <DEGREE>
WESTERNMOST_LONGITUDE = -22.8965470 <DEGREE>
EASTERNMOST_LONGITUDE = -19.0829150 <DEGREE>
LINE_PROJECTION_OFFSET = -14945.9116667 <PIXEL>
SAMPLE_PROJECTION_OFFSET = 6313.7611111 <PIXEL>
COORDINATE_SYSTEM_TYPE = "BODY-FIXED ROTATING"
COORDINATE_SYSTEM_NAME = "PLANETOCENTRIC"
END_OBJECT = IMAGE_MAP_PROJECTION
/* ENVI header description */
/* The ENVI header is a separate ASCII file that includes basic image */
/* data file characteristics and allows the image data to be loaded */
/* directly into the ENVI image processing software available bands */
/* list. */
OBJECT = ENVI_HEADER
HEADER_TYPE = "ENVI"
INTERCHANGE_FORMAT = "ASCII"
BYTES = 1601
DESCRIPTION = "This text file can be used by ENVI image
processing software to read in the image."
END_OBJECT = ENVI_HEADER
/* This map-projected DDR label describes one data file: */
/* 1. A multiple-band backplane image file with wavelength-independent, */
/* spatial pixel-dependent geometric and timing information. */
/* See the CRISM Data Products SIS for more detailed description. */
OBJECT = IMAGE
LINES = 761
LINE_SAMPLES = 880
SAMPLE_TYPE = PC_REAL
SAMPLE_BITS = 32
BANDS = 14
BAND_STORAGE_TYPE = BAND_SEQUENTIAL
BAND_NAME = ("INA at areoid, deg", "EMA at areoid, deg",
"Phase angle, deg",
"Latitude, areocentric, deg N",
"Longitude, areocentric, deg E",
"INA at surface from MOLA, deg",
"EMA at surface from MOLA, deg",
"Slope magnitude from MOLA, deg",
"MOLA slope azimuth, deg clkwise from N",
"Elevation, meters relative to MOLA",
"Thermal inertia, J m^-2 K^-1 s^-0.5",
"Bolometic albedo",
"Local solar time, hours",
"Spare")
END_OBJECT = IMAGE
END
PDS_VERSION_ID = PDS3
RECORD_TYPE = FIXED_LENGTH
RECORD_BYTES = 3520
FILE_RECORDS = 45660
LABEL_REVISION_NOTE =
"2012-03-06, H. Taylor, F. Seelos (JHU/APL)
Initial TER/MTRDR labels for CRISM Data Users' Workshop;
2014-01-09, G. Romeo, J. Aiello, F. Seelos (JHU/APL)
Complete TER/MTRDR label set for preliminary PDS review;
2014-04-08, G. Romeo, J. Aiello, R. Espiritu, F. Seelos (JHU/APL)
TER/MTRDR label set revisions completed for PDS peer review;
2014-08-14, G. Romeo, J. Aiello, F. Seelos (JHU/APL)
PDS peer review TER/MTRDR label set liens retired;"
^ENVI_HEADER = "FRT00002F7F_07_SR168J_MTR3.HDR"
^IMAGE = "FRT00002F7F_07_SR168J_MTR3.IMG"
/* DDR Identification */
DATA_SET_ID = "MRO-M-CRISM-5-RDR-MPTARGETED-V1.0"
PRODUCT_ID = "FRT00002F7F_07_SR168J_MTR3"
/* cccnnnnnnnn_xx_ooaaas_MTRv */
/* ccc = Class Type */
/* nnnnnnnn = Observation ID (hex) */
/* xx = counter this observation (hex) */
/* ooaaa = obs type, macro number */
/* s = sensor ID (J for Joined) */
/* v = version number */
INSTRUMENT_HOST_NAME = "MARS RECONNAISSANCE ORBITER"
SPACECRAFT_ID = MRO
INSTRUMENT_NAME = "COMPACT RECONNAISSANCE IMAGING
SPECTROMETER FOR MARS"
INSTRUMENT_ID = CRISM
TARGET_NAME = MARS
PRODUCT_TYPE = MPTARGETED_RDR
PRODUCT_CREATION_TIME = 2015-06-11T20:20:38
START_TIME = 2006-11-11T13:21:36.054
STOP_TIME = 2006-11-11T13:23:59.788
SPACECRAFT_CLOCK_START_COUNT = "2/0847718514.58200"
SPACECRAFT_CLOCK_STOP_COUNT = "2/0847718658.40771"
ORBIT_NUMBER = 1374
OBSERVATION_TYPE = "FRT"
OBSERVATION_ID = "16#00002F7F#"
MRO:OBSERVATION_NUMBER = 16#07#
MRO:ACTIVITY_ID = "IF168"
MRO:SENSOR_ID = "J"
PRODUCT_VERSION_ID = "3"
PRODUCER_INSTITUTION_NAME = "JOHNS HOPKINS UNIVERSITY
APPLIED PHYSICS LABORATORY"
SOFTWARE_NAME = "mtrdr_pipeline"
SOFTWARE_VERSION_ID = "1.0"
SOURCE_PRODUCT_ID = (
"FRT00002F7F_07_SU168J_MTR3"
)
/* Targeted RDR Observation and Processing Parameters */
SOLAR_DISTANCE = 236036552.409150 <KILOMETER>
SOLAR_LONGITUDE = 133.840086
MRO:PHOTOMETRIC_CORR_FLAG = "ON"
MRO:ATMOSPHERIC_CORR_FLAG = "ON"
MRO:RATIO_SHIFT_CORR_FLAG = "ON"
MRO:EMPIRICAL_GEOM_NORM_FLAG = "ON"
MRO:EMPIRICAL_SMILE_CORR_FLAG = "ON"
MRO:SENSOR_SPACE_TRANSFORM_FLAG = "ON"
/* Map projection information about this RDR is in the */
/* IMAGE_MAP_PROJECTION object below. */
OBJECT = IMAGE_MAP_PROJECTION
^DATA_SET_MAP_PROJECTION = "MTR_MAP.CAT"
MAP_PROJECTION_TYPE = "POLAR STEREOGRAPHIC"
A_AXIS_RADIUS = 3396.190000000000 <KILOMETER>
B_AXIS_RADIUS = 3396.190000000000 <KILOMETER>
C_AXIS_RADIUS = 3376.200000000000 <KILOMETER>
POSITIVE_LONGITUDE_DIRECTION = EAST
CENTER_LATITUDE = 90.0000000 <DEGREE>
CENTER_LONGITUDE = 0.0000000 <DEGREE>
LINE_FIRST_PIXEL = 1 <PIXEL>
LINE_LAST_PIXEL = 761 <PIXEL>
SAMPLE_FIRST_PIXEL = 1 <PIXEL>
SAMPLE_LAST_PIXEL = 880 <PIXEL>
MAP_PROJECTION_ROTATION = 0.0000000 <DEGREE>
MAP_RESOLUTION = 3293.0387513
MAP_SCALE = 0.0180000
MINIMUM_LATITUDE = 84.8928520 <DEGREE>
MAXIMUM_LATITUDE = 85.2014640 <DEGREE>
WESTERNMOST_LONGITUDE = -22.8965470 <DEGREE>
EASTERNMOST_LONGITUDE = -19.0829150 <DEGREE>
LINE_PROJECTION_OFFSET = -14945.9116667 <PIXEL>
SAMPLE_PROJECTION_OFFSET = 6313.7611111 <PIXEL>
COORDINATE_SYSTEM_TYPE = "BODY-FIXED ROTATING"
COORDINATE_SYSTEM_NAME = "PLANETOCENTRIC"
END_OBJECT = IMAGE_MAP_PROJECTION
/* ENVI header description */
/* The ENVI header is a separate ASCII file that includes basic image */
/* data file characteristics and allows the image data to be loaded */
/* directly into the ENVI image processing software available bands */
/* list. */
OBJECT = ENVI_HEADER
HEADER_TYPE = "ENVI"
INTERCHANGE_FORMAT = "ASCII"
BYTES = 1741
DESCRIPTION = "This text file can be used by ENVI image
processing software to read in the image."
END_OBJECT = ENVI_HEADER
/* This Map-Projected Targeted RDR label describes a multiple-band */
/* image file containing refined spectral summary parameters */
/* calculated from calibrated and corrected spectral data. */
OBJECT = IMAGE
LINES = 761
LINE_SAMPLES = 880
SAMPLE_TYPE = PC_REAL
SAMPLE_BITS = 32
DESCRIPTION = "REFINED_SPECTRAL_SUMMARY_PARAMETERS"
BANDS = 60
BAND_STORAGE_TYPE = BAND_SEQUENTIAL
BAND_NAME = ( "R770",
"RBR",
"BD530_2",
"SH600_2",
"SH770",
"BD640_2",
"BD860_2",
"BD920_2",
"RPEAK1",
"BDI1000VIS",
"R440",
"IRR1",
"BDI1000IR",
"OLINDEX3",
"R1330",
"BD1300",
"LCPINDEX2",
"HCPINDEX2",
"VAR",
"ISLOPE1",
"BD1400",
"BD1435",
"BD1500_2",
"ICER1_2",
"BD1750_2",
"BD1900_2",
"BD1900R2",
"BDI2000",
"BD2100_2",
"BD2165",
"BD2190",
"MIN2200",
"BD2210_2",
"D2200",
"BD2230",
"BD2250",
"MIN2250",
"BD2265",
"BD2290",
"D2300",
"BD2355",
"SINDEX2",
"ICER2_2",
"MIN2295_2480",
"MIN2345_2537",
"BD2500_2",
"BD3000",
"BD3100",
"BD3200",
"BD3400_2",
"CINDEX2",
"BD2600",
"IRR2",
"IRR3",
"R530",
"R600",
"R1080",
"R1506",
"R2529",
"R3920" )
END_OBJECT = IMAGE
END
PDS_VERSION_ID = PDS3
RECORD_TYPE = FIXED_LENGTH
RECORD_BYTES = 3520
FILE_RECORDS = 45660
LABEL_REVISION_NOTE =
"2012-03-06, H. Taylor, F. Seelos (JHU/APL)
Initial TER/MTRDR labels for CRISM Data Users' Workshop;
2014-01-09, G. Romeo, J. Aiello, F. Seelos (JHU/APL)
Complete TER/MTRDR label set for preliminary PDS review;
2014-04-08, G. Romeo, J. Aiello, R. Espiritu, F. Seelos (JHU/APL)
TER/MTRDR label set revisions completed for PDS peer review;
2014-08-14, G. Romeo, J. Aiello, F. Seelos (JHU/APL)
PDS peer review TER/MTRDR label set liens retired;"
^ENVI_HEADER = "FRT00002F7F_07_SU168J_MTR3.HDR"
^IMAGE = "FRT00002F7F_07_SU168J_MTR3.IMG"
/* DDR Identification */
DATA_SET_ID = "MRO-M-CRISM-5-RDR-MPTARGETED-V1.0"
PRODUCT_ID = "FRT00002F7F_07_SU168J_MTR3"
/* cccnnnnnnnn_xx_ooaaas_MTRv */
/* ccc = Class Type */
/* nnnnnnnn = Observation ID (hex) */
/* xx = counter this observation (hex) */
/* ooaaa = obs type, macro number */
/* s = sensor ID (J for Joined) */
/* v = version number */
INSTRUMENT_HOST_NAME = "MARS RECONNAISSANCE ORBITER"
SPACECRAFT_ID = MRO
INSTRUMENT_NAME = "COMPACT RECONNAISSANCE IMAGING
SPECTROMETER FOR MARS"
INSTRUMENT_ID = CRISM
TARGET_NAME = MARS
PRODUCT_TYPE = MPTARGETED_RDR
PRODUCT_CREATION_TIME = 2015-06-11T20:20:11
START_TIME = 2006-11-11T13:21:36.054
STOP_TIME = 2006-11-11T13:23:59.788
SPACECRAFT_CLOCK_START_COUNT = "2/0847718514.58200"
SPACECRAFT_CLOCK_STOP_COUNT = "2/0847718658.40771"
ORBIT_NUMBER = 1374
OBSERVATION_TYPE = "FRT"
OBSERVATION_ID = "16#00002F7F#"
MRO:OBSERVATION_NUMBER = 16#07#
MRO:ACTIVITY_ID = "IF168"
MRO:SENSOR_ID = "J"
PRODUCT_VERSION_ID = "3"
PRODUCER_INSTITUTION_NAME = "JOHNS HOPKINS UNIVERSITY
APPLIED PHYSICS LABORATORY"
SOFTWARE_NAME = "mtrdr_pipeline"
SOFTWARE_VERSION_ID = "1.0"
SOURCE_PRODUCT_ID = (
"FRT00002F7F_07_IF168J_MTR3"
)
/* Targeted RDR Observation and Processing Parameters */
SOLAR_DISTANCE = 236036552.409150 <KILOMETER>
SOLAR_LONGITUDE = 133.840086
MRO:PHOTOMETRIC_CORR_FLAG = "ON"
MRO:ATMOSPHERIC_CORR_FLAG = "ON"
MRO:RATIO_SHIFT_CORR_FLAG = "ON"
MRO:EMPIRICAL_GEOM_NORM_FLAG = "ON"
MRO:EMPIRICAL_SMILE_CORR_FLAG = "ON"
MRO:SENSOR_SPACE_TRANSFORM_FLAG = "ON"
/* Map projection information about this RDR is in the */
/* IMAGE_MAP_PROJECTION object below. */
OBJECT = IMAGE_MAP_PROJECTION
^DATA_SET_MAP_PROJECTION = "MTR_MAP.CAT"
MAP_PROJECTION_TYPE = "POLAR STEREOGRAPHIC"
A_AXIS_RADIUS = 3396.190000000000 <KILOMETER>
B_AXIS_RADIUS = 3396.190000000000 <KILOMETER>
C_AXIS_RADIUS = 3376.200000000000 <KILOMETER>
POSITIVE_LONGITUDE_DIRECTION = EAST
CENTER_LATITUDE = 90.0000000 <DEGREE>
CENTER_LONGITUDE = 0.0000000 <DEGREE>
LINE_FIRST_PIXEL = 1 <PIXEL>
LINE_LAST_PIXEL = 761 <PIXEL>
SAMPLE_FIRST_PIXEL = 1 <PIXEL>
SAMPLE_LAST_PIXEL = 880 <PIXEL>
MAP_PROJECTION_ROTATION = 0.0000000 <DEGREE>
MAP_RESOLUTION = 3293.0387513
MAP_SCALE = 0.0180000
MINIMUM_LATITUDE = 84.8928520 <DEGREE>
MAXIMUM_LATITUDE = 85.2014640 <DEGREE>
WESTERNMOST_LONGITUDE = -22.8965470 <DEGREE>
EASTERNMOST_LONGITUDE = -19.0829150 <DEGREE>
LINE_PROJECTION_OFFSET = -14945.9116667 <PIXEL>
SAMPLE_PROJECTION_OFFSET = 6313.7611111 <PIXEL>
COORDINATE_SYSTEM_TYPE = "BODY-FIXED ROTATING"
COORDINATE_SYSTEM_NAME = "PLANETOCENTRIC"
END_OBJECT = IMAGE_MAP_PROJECTION
/* ENVI header description */
/* The ENVI header is a separate ASCII file that includes basic image */
/* data file characteristics and allows the image data to be loaded */
/* directly into the ENVI image processing software available bands */
/* list. */
OBJECT = ENVI_HEADER
HEADER_TYPE = "ENVI"
INTERCHANGE_FORMAT = "ASCII"
BYTES = 1741
DESCRIPTION = "This text file can be used by ENVI image
processing software to read in the image."
END_OBJECT = ENVI_HEADER
/* This Map-Projected Targeted RDR label describes a multiple-band */
/* image file containing spectral summary parameters calculated */
/* from calibrated and corrected spectral data. */
OBJECT = IMAGE
LINES = 761
LINE_SAMPLES = 880
SAMPLE_TYPE = PC_REAL
SAMPLE_BITS = 32
DESCRIPTION = "SPECTRAL_SUMMARY_PARAMETERS"
BANDS = 60
BAND_STORAGE_TYPE = BAND_SEQUENTIAL
BAND_NAME = ( "R770",
"RBR",
"BD530_2",
"SH600_2",
"SH770",
"BD640_2",
"BD860_2",
"BD920_2",
"RPEAK1",
"BDI1000VIS",
"R440",
"IRR1",
"BDI1000IR",
"OLINDEX3",
"R1330",
"BD1300",
"LCPINDEX2",
"HCPINDEX2",
"VAR",
"ISLOPE1",
"BD1400",
"BD1435",
"BD1500_2",
"ICER1_2",
"BD1750_2",
"BD1900_2",
"BD1900R2",
"BDI2000",
"BD2100_2",
"BD2165",
"BD2190",
"MIN2200",
"BD2210_2",
"D2200",
"BD2230",
"BD2250",
"MIN2250",
"BD2265",
"BD2290",
"D2300",
"BD2355",
"SINDEX2",
"ICER2_2",
"MIN2295_2480",
"MIN2345_2537",
"BD2500_2",
"BD3000",
"BD3100",
"BD3200",
"BD3400_2",
"CINDEX2",
"BD2600",
"IRR2",
"IRR3",
"R530",
"R600",
"R1080",
"R1506",
"R2529",
"R3920" )
END_OBJECT = IMAGE
END
PDS_VERSION_ID = PDS3
RECORD_TYPE = FIXED_LENGTH
RECORD_BYTES = 30
FILE_RECORDS = 489
LABEL_REVISION_NOTE =
"2012-03-06, H. Taylor, F. Seelos (JHU/APL)
Initial TER/MTRDR labels for CRISM Data Users' Workshop;
2014-01-09, G. Romeo, J. Aiello, F. Seelos (JHU/APL)
Complete TER/MTRDR label set for preliminary PDS review;
2014-04-08, G. Romeo, J. Aiello, R. Espiritu, F. Seelos (JHU/APL)
TER/MTRDR label set revisions completed for PDS peer review;
2014-08-14, G. Romeo, J. Aiello, F. Seelos (JHU/APL)
PDS peer review TER/MTRDR label set liens retired;"
^WAVELENGTH_SOURCE_TABLE = "FRT00002F7F_07_WV168J_MTR3.TAB"
/* Map-Projected Targeted RDR Identification */
DATA_SET_ID = "MRO-M-CRISM-5-RDR-MPTARGETED-V1.0"
PRODUCT_ID = "FRT00002F7F_07_WV168J_MTR3"
/* cccnnnnnnnn_xx_ooaaas_MTRv */
/* ccc = Class Type */
/* nnnnnnnn = Observation ID, hexadecimal */
/* xx = counter this observation (hex) */
/* ooaaa = Image type, Macro number */
/* s = Sensor ID (J for Joined) */
/* v = Version number */
INSTRUMENT_HOST_NAME = "MARS RECONNAISSANCE ORBITER"
SPACECRAFT_ID = MRO
INSTRUMENT_NAME = "COMPACT RECONNAISSANCE IMAGING
SPECTROMETER FOR MARS"
INSTRUMENT_ID = CRISM
TARGET_NAME = MARS
PRODUCT_TYPE = MPTARGETED_RDR
PRODUCT_CREATION_TIME = 2015-06-11T20:19:43
START_TIME = 2006-11-11T13:21:36.054
STOP_TIME = 2006-11-11T13:23:59.788
SPACECRAFT_CLOCK_START_COUNT = "2/0847718514.58200"
SPACECRAFT_CLOCK_STOP_COUNT = "2/0847718658.40771"
PRODUCT_VERSION_ID = "3"
PRODUCER_INSTITUTION_NAME = "JOHNS HOPKINS UNIVERSITY
APPLIED PHYSICS LABORATORY"
SOFTWARE_NAME = "mtrdr_pipeline"
SOFTWARE_VERSION_ID = "1.0"
/* A listfile including spectrometer identifier, detector row numbers,*/
/* wavelengths, full width half max, and bad band identifier in the*/
/* Targeted Empirical Record and Map-Projected Targeted RDR images. */
OBJECT = WAVELENGTH_SOURCE_TABLE
NAME = "CRISM JOINED WAVELENGTH TABLE"
INTERCHANGE_FORMAT = "ASCII"
ROWS = 489
COLUMNS = 5
ROW_BYTES = 30
DESCRIPTION = "CRISM JOINED WAVELENGTH table"
OBJECT = COLUMN
COLUMN_NUMBER = 1
NAME = SPECT_ID
DATA_TYPE = ASCII_INTEGER
START_BYTE = 1
BYTES = 2
DESCRIPTION = "Spectrometer identifier; 0 = IR; 1 = VNIR"
END_OBJECT = COLUMN
OBJECT = COLUMN
COLUMN_NUMBER = 2
NAME = ROWNUM
DATA_TYPE = ASCII_INTEGER
START_BYTE = 4
BYTES = 4
DESCRIPTION = "detector row number (0-479)"
END_OBJECT = COLUMN
OBJECT = COLUMN
COLUMN_NUMBER = 3
NAME = SAMPL_WAV
DATA_TYPE = ASCII_REAL
START_BYTE = 9
BYTES = 8
DESCRIPTION = "Standard sampling center wavelength in nm"
UNIT = "NM"
END_OBJECT = COLUMN
OBJECT = COLUMN
COLUMN_NUMBER = 4
NAME = FWHM
DATA_TYPE = ASCII_REAL
START_BYTE = 18
BYTES = 8
DESCRIPTION = "Full Width Half Max in nm"
UNIT = "NM"
END_OBJECT = COLUMN
OBJECT = COLUMN
COLUMN_NUMBER = 5
NAME = BAD_BAND_ID
DATA_TYPE = ASCII_INTEGER
START_BYTE = 27
BYTES = 2
DESCRIPTION = "Bad Band Identifier; 0 = BAD; 1 = GOOD"
END_OBJECT = COLUMN
END_OBJECT = WAVELENGTH_SOURCE_TABLE
END
PDS_VERSION_ID
= PDS3
LABEL_REVISION_NOTE
= "2005-12-22, P. Cavender;
2006-09-18, MRO CRISM:HWT line length fix;
2009-04-03, Scott Murchie; modified
table 2 to contain hyperspectral survey,
and put old table 2 into table 3
2009-08-07, C. Hash; modified table 2
to be a superset of table 1."
/*
Level 6 CDR (Calibration Data Record) Identification */
DATA_SET_ID
= "MRO-M-CRISM-4/6-CDR-V1.0"
PRODUCT_ID
= "CDR6_9_0947778566_WV_L_0"
PRODUCT_TYPE
= CDR
SPACECRAFT_ID
= MRO
INSTRUMENT_ID
= CRISM
START_TIME
= 2010-01-12T15:48:55
STOP_TIME
= NULL
SPACECRAFT_CLOCK_START_COUNT
= "9/0947778566"
SPACECRAFT_CLOCK_STOP_COUNT
= NULL
PRODUCT_CREATION_TIME
= 2010-02-19T18:58:00
MRO:SENSOR_ID
= "L"
PRODUCT_VERSION_ID
= "0"
/*
Description of CDR6 TABLE file */
OBJECT
= FILE
^TABLE = "CDR6_9_0947778566_WV_L_0.TAB"
RECORD_TYPE = FIXED_LENGTH
RECORD_BYTES = 13
FILE_RECORDS = 480
OBJECT = TABLE
NAME = "WAVELENGTH TABLE"
INTERCHANGE_FORMAT = "ASCII"
ROWS = 4804
COLUMNS = 5
ROW_BYTES = 13
DESCRIPTION = "Wavelength Table"
OBJECT = COLUMN
COLUMN_NUMBER = 1
NAME = IR_ROW
DATA_TYPE = ASCII_INTEGER
START_BYTE = 1
BYTES = 3
DESCRIPTION = "IR detector row; low numbers are at the long
wavelength end"
END_OBJECT = COLUMN
OBJECT = COLUMN
COLUMN_NUMBER = 2
NAME = IR_FILTER_0
DATA_TYPE = ASCII_INTEGER
START_BYTE = 5
BYTES = 1
DESCRIPTION = "IR wavelength table 0; in housekeeping file
when SPECT_ID=0 this column is applicable
when FILTER=0; if value is 0 then data from
that row of the detector is not returned; if
value is 1 then data from that row of the
detector is returned"
END_OBJECT = COLUMN
OBJECT = COLUMN
COLUMN_NUMBER = 3
NAME = IR_FILTER_1
DATA_TYPE = ASCII_INTEGER
START_BYTE = 7
BYTES = 1
DESCRIPTION = "IR wavelength table 1; in housekeeping file
when SPECT_ID=0 this column is applicable
when FILTER=1; if value is 0 then data from
that row of the detector is not returned; if
value is 1 then data from that row of the
detector is returned"
END_OBJECT = COLUMN
OBJECT = COLUMN
COLUMN_NUMBER = 4
NAME = IR_FILTER_2
DATA_TYPE = ASCII_INTEGER
START_BYTE = 9
BYTES = 1
DESCRIPTION = "IR wavelength table 2; in housekeeping file
when SPECT_ID=0 this column is applicable
when FILTER=2; if value is 0 then data from
that row of the detector is not returned; if
value is 1 then data from that row of the
detector is returned"
END_OBJECT = COLUMN
OBJECT = COLUMN
COLUMN_NUMBER = 5
NAME = IR_FILTER_3
DATA_TYPE = ASCII_INTEGER
START_BYTE = 11
BYTES = 1
DESCRIPTION = "IR wavelength table 3; in housekeeping file
when SPECT_ID=0 this column is applicable
when FILTER=3; if value is 0 then data from
that row of the detector is not returned; if
value is 1 then data from that row of the
detector is returned"
END_OBJECT = COLUMN
END_OBJECT = TABLE
END_OBJECT
= FILE
END
PDS_VERSION_ID
= PDS3
LABEL_REVISION_NOTE
= "2006-04-11 D. Humm (APL), modified;
version 0 prelim Rob Green cal <2500 nm
and 5x5 >2500 nm; version 1 D. Humm,
replace all non-scene with 65535.;
version 2 2006-09-21 D. Humm,
final ground Rob Green cal
<2500 nm and 5x5 >2500 nm;
version 3 2007-01-23 D. Humm,
adjust by 1.5-3 nm wavelength
shift as a function of column #
supplied by Rob Green 2007-01-03"
/*(
NOTE: Comments in this label that are delimited with parentheses, )*/
/*( for
example: )*/
/*( comment )*/
/*( are
notes to the data provider. These comments should be removed )*/
/*(
from the final label. Comments without parentheses, for example: )*/
/* comment */
/*( are
intended to be part of the final label. )*/
/*
Level 4 CDR (Calibration Data Record) Identification */
DATA_SET_ID
= "MRO-M-CRISM-4/6-CDR-V1.0"
PRODUCT_ID
= "CDR410803692813_WA0000000L_3"
/*( CDR4Ptttttttttt_pprbeeewsn_v )*/
/*( P = partition of sclk time )*/
/*( tttttttttt = s/c start or mean time )*/
/*( pp = calib. type from SIS table 2-8 )*/
/*( r = frame rate identifier, 0-4 )*/
/*( b = binning identifier, 0-3 )*/
/*( eee = exposure time parameter, 0-480 )*/
/*( w = wavelength filter, 0-3 )*/
/*( s = side: 1 or 2, or 0 if N/A )*/
/*( n = sensor ID: S, L, or J )*/
/*( v = version )*/
PRODUCT_TYPE
= CDR
SPACECRAFT_ID
= MRO
INSTRUMENT_ID
= CRISM
START_TIME
= 2005-06-19T23:59:59.999
STOP_TIME
= NULL
SPACECRAFT_CLOCK_START_COUNT
= "1/0803692813"
SPACECRAFT_CLOCK_STOP_COUNT
= NULL
OBSERVATION_TIME
= NULL
PRODUCT_CREATION_TIME
= 2007-01-23T23:26:00
OBSERVATION_TYPE
= NULL
OBSERVATION_ID
= NULL
MRO:OBSERVATION_NUMBER
= NULL
MRO:ACTIVITY_ID
= NULL
SOURCE_PRODUCT_ID
= NULL
MRO:SENSOR_ID
= "L"
PRODUCT_VERSION_ID
= "3"
/* CDR
Instrument and Observation Parameters */
SAMPLING_MODE_ID
= "HYPERSPEC"
MRO:WAVELENGTH_FILE_NAME
= "CDR410803692813_WA0000000L_3.IMG"
MRO:DETECTOR_TEMPERATURE
= NULL
MRO:OPTICAL_BENCH_TEMPERATURE
= NULL
MRO:SPECTROMETER_HOUSING_TEMP
= NULL
MRO:SPHERE_TEMPERATURE
= NULL
SHUTTER_MODE_ID
= "OPEN"
LIGHT_SOURCE_NAME
= "NONE"
MRO:CALIBRATION_LAMP_STATUS
= "OFF"
MRO:CALIBRATION_LAMP_LEVEL
= 0
MRO:FRAME_RATE
= NULL
PIXEL_AVERAGING_WIDTH
= 1 /*( pixel bin size, across track ) */
MRO:EXPOSURE_PARAMETER
= NULL
MRO:WAVELENGTH_FILTER
= "0"
/* This
Level 4 CDR label describes one calibration data file. The file */
/* is a
mutiple-band, single-frame image file derived from ground data. */
/* It
consists of a binary image followed by a list of row numbers */
/*
corresponding to the wavelength filter. */
/* The
WA level 4 CDR gives the center wavelength in nm of each pixel, */
/*
assuming a given spatial binning and wavelength filter. */
/*
Description of CDR IMAGE file */
OBJECT
= FILE
^IMAGE = "CDR410803692813_WA0000000L_3.IMG"
/*
offset is in file records, which is just (imgbands*imglines) + 1 */
^ROWNUM_TABLE = ("CDR410803692813_WA0000000L_3.IMG",439 )
RECORD_TYPE = FIXED_LENGTH
RECORD_BYTES = 2560 /* one row now, not one frame to save space in table */
FILE_RECORDS = 439 /* compute by ROUND ((imgbands * imglines * */
/* line_samples * samplebits/8 + */
/* tablerows * tablerowbytes) / */
/* record_bytes + 0.5 ) */
OBJECT = IMAGE
LINES = 1
LINE_SAMPLES = 640
SAMPLE_TYPE = PC_REAL
SAMPLE_BITS = 32
BANDS = 438
BAND_NAME = NULL
BAND_STORAGE_TYPE = LINE_INTERLEAVED
DESCRIPTION = "Center wavelength in nm for each
detector pixel"
UNIT = "NM"
END_OBJECT = IMAGE
/* be
sure to pad this object to a full record (2560/bin bytes here) */
OBJECT = ROWNUM_TABLE
NAME = "SELECTED ROWS FROM DETECTOR"
INTERCHANGE_FORMAT = "BINARY"
ROWS = 438
COLUMNS = 1
ROW_BYTES = 2
DESCRIPTION = "The detector is subsampled in the spectral direction
by selecting specific rows to be downlinked. This
table provides a list of the rows selected for all
frames in this multidimensional image cube."
OBJECT = COLUMN
NAME = DETECTOR_ROW_NUMBER
DATA_TYPE = MSB_UNSIGNED_INTEGER
BIT_MASK = 2#0000000111111111#
START_BYTE = 1
BYTES = 2
DESCRIPTION = "Detector row number from which the data was taken."
END_OBJECT = COLUMN
END_OBJECT = ROWNUM_TABLE
END_OBJECT
= FILE
END
PDS_VERSION_ID
= PDS3
LABEL_REVISION_NOTE
= "2009-04-07, S. Murchie (JHU/APL);"
/* LDR
Identification */
DATA_SET_ID
= "MRO-M-CRISM-6-LDR-V1.0"
PRODUCT_ID
= "LMB00002B61_0B_DE227S_LDR0"
/*
cccnnnnnnnn_xx_ooaaas_LDRv */
/* ccc
= Class Type */
/*
nnnnnnnn = Observation ID (hex) */
/* xx =
counter this observation (hex) */
/*
ooaaa = obs type, macro number */
/* s =
sensor ID (S or L) */
/* v =
version number */
INSTRUMENT_HOST_NAME
= "MARS RECONNAISSANCE ORBITER"
SPACECRAFT_ID
= MRO
INSTRUMENT_NAME
= "COMPACT RECONNAISSANCE IMAGING
SPECTROMETER FOR MARS"
INSTRUMENT_ID
= CRISM
TARGET_NAME
= MARS
PRODUCT_TYPE
= LDR
PRODUCT_CREATION_TIME
= 2009-09-03T19:50:25
START_TIME
= 2009-07-11T09:12:06.267
STOP_TIME
= 2009-07-11T09:14:30.001
SPACECRAFT_CLOCK_START_COUNT
= "6/931770748:44476"
SPACECRAFT_CLOCK_STOP_COUNT
= "6/931770892:27045"
ORBIT_NUMBER
= 0
OBSERVATION_TYPE
= "LMB"
OBSERVATION_ID
= "16#00002B61#"
MRO:OBSERVATION_NUMBER
= 16#0B#
MRO:ACTIVITY_ID
= "DE227"
MRO:SENSOR_ID
= "S"
PRODUCT_VERSION_ID
= "0"
SOURCE_PRODUCT_ID
= {
"mro.tsc",
"mro_v14.tf",
"MRO_CRISM_FK_0000_000_N_01.TF",
"MRO_CRISM_IK_0000_000_N_10.TI",
"naif0009.tls",
"pck00008.tpc",
"mro_sc_psp_090707_090713.bc",
"spck_2009_191_r_1.bc",
"spck_2009_192_r_1.bc",
"de410.bsp",
"mro_cruise.bsp",
"mro_ab.bsp",
"mro_psp.bsp",
"mro_psp1.bsp",
"mro_psp2.bsp",
"mro_psp_rec.bsp"
}
PRODUCER_INSTITUTION_NAME
= "APPLIED PHYSICS LABORATORY"
SOFTWARE_NAME
= "crism_ldr"
SOFTWARE_VERSION_ID
= "1.0"
/* LDR
Instrument and Observation Parameters */
SOLAR_DISTANCE
= 213229293.617318 <KM>
SOLAR_LONGITUDE
= 301.331137 <DEGREES>
MRO:FRAME_RATE
= 3.75 <HZ>
PIXEL_AVERAGING_WIDTH
= 10
MRO:INSTRUMENT_POINTING_MODE
= "DYNAMIC POINTING"
/* This
LDR label describes one data file: */
/* 1. A
multiple-band backplane image file with wavelength-independent, */
/*
spatial pixel-dependent geometric and timing information. */
/* See
the CRISM Data Products SIS for more detailed description. */
OBJECT
= FILE
^IMAGE = "LMB00002B61_0B_DE227S_LDR0.IMG"
RECORD_TYPE = FIXED_LENGTH
RECORD_BYTES = 256
FILE_RECORDS = 8100
OBJECT = IMAGE
LINES = 540
LINE_SAMPLES = 64
SAMPLE_TYPE = PC_REAL
SAMPLE_BITS = 32
BANDS = 15
BAND_STORAGE_TYPE = BAND_SEQUENTIAL
BAND_NAME = ("INA at areoid, deg",
"EMA at areoid, deg",
"Phase angle, deg",
"Latitude, areocentric, deg N",
"Longitude, areocentric, deg E",
"INA at surface from MOLA, deg",
"EMA at surface from MOLA, deg",
"Elevation, meters relative to areoid",
"Elevation, meters relative to MOLA",
"Local Solar Time, hours",
"Ephemeris Time of observation, seconds past noon January 1, 2000",
"Sub-Solar Latitude, areocentric, deg N",
"Sub-Solar Longitude, areocentric, deg E",
"Sub-Spacecraft Latitude, areocentric, deg N",
"Sub-Spacecraft Longitude, areocentric, deg E)"
END_OBJECT = IMAGE
END_OBJECT
= FILE
END
PDS_VERSION_ID
= PDS3
LABEL_REVISION_NOTE
= "2006-02-25, S.Murchie (APL)"
/* This
browse product provides an overview of the MRO CRISM EDRs */
/* from
a single observation */
^HTML_DOCUMENT
= "FRT00004ECA_BROWSE_EDR0.HTML"
DATA_SET_ID
= "MRO-M-CRISM-2-EDR-V1.0"
PRODUCT_ID
= "FRT00004ECA_BROWSE_EDR0"
/* EDR
browse product */
/*
cccnnnnnnnn_BROWSE_EDRv */
/* ccc
= Class Type */
/*
nnnnnnnn = Observation ID (hex) */
/* v =
Version number */
INSTRUMENT_HOST_NAME
= "MARS RECONNAISSANCE ORBITER"
SPACECRAFT_ID
= MRO
INSTRUMENT_NAME
= "COMPACT RECONNAISSANCE IMAGING
SPECTROMETER FOR MARS"
INSTRUMENT_ID
= CRISM
TARGET_NAME
= MARS
PRODUCT_TYPE
= BROWSE
PRODUCT_CREATION_TIME
= 2007-04-25T11:17:50.529
PRODUCER_INSTITUTION_NAME
= "JOHNS HOPKINS UNIVERSITY
APPLIED PHYSICS LABORATORY"
SOFTWARE_NAME
= "pipe_crism_create_browse"
SOFTWARE_VERSION_ID
= "1.0"
/* The
following information is relevant to an entire observation */
ORBIT_NUMBER
= NULL
OBSERVATION_TYPE
= "FRT"
OBSERVATION_ID
= "16#00004ECA#"
PRODUCT_VERSION_ID
= "0"
SOLAR_DISTANCE
= NULL <KM>
/*
These times are from the beginning of the first EDR of the observation */
/* to
the end of the last EDR of the observation */
START_TIME
= 2007-03-23T02:59:55.113681
STOP_TIME
= 2007-03-23T03:06:55.910109
SPACECRAFT_CLOCK_START_COUNT
= "2/0859086014.03181"
SPACECRAFT_CLOCK_STOP_COUNT
= "2/0859086434.55376"
OBJECT
= HTML_DOCUMENT
DOCUMENT_NAME = "EDR BROWSE OVERVIEW"
RECORD_TYPE = UNDEFINED
PUBLICATION_DATE = 2007-04-25
DOCUMENT_TOPIC_TYPE = "HTML NAVIGATION"
INTERCHANGE_FORMAT = ASCII
DOCUMENT_FORMAT = HTML
DESCRIPTION = "This document provides an overview of the MRO
CRISM EDRs from a single observation."
END_OBJECT
= HTML_DOCUMENT
END
PDS_VERSION_ID
= PDS3
LABEL_REVISION_NOTE
= "2003-11-19, S. Slavney (GEO);
2005-02-01, C. Hash (ACT);
2006-01-04, C. Hash (ACT);"
/* EDR
Identification */
DATA_SET_ID
= "MRO-M-CRISM-2-EDR-V1.0"
PRODUCT_ID
= "FRT00004ECA_07_SC166L_RAW0"
/*
cccnnnnnnnn_xx_ooaaas_RAWv */
/* ccc
= Class Type */
/*
nnnnnnnn = Observation ID (hex) */
/* xx =
counter within observation (hex) */
/*
ooaaa = obs type, macro number */
/* s =
sensor ID (S or L) */
/* v =
version number */
INSTRUMENT_HOST_NAME
= "MARS RECONNAISSANCE ORBITER"
SPACECRAFT_ID
= MRO
INSTRUMENT_NAME
= "COMPACT RECONNAISSANCE IMAGING
SPECTROMETER FOR MARS"
INSTRUMENT_ID
= CRISM
TARGET_NAME
= MARS
PRODUCT_TYPE
= BROWSE
PRODUCT_CREATION_TIME
= 2007-04-06T13:22:26
START_TIME
= 2007-03-23T03:02:31.910417
STOP_TIME
= 2007-03-23T03:04:39.644669
SPACECRAFT_CLOCK_START_COUNT
= "2/0859086170.55396"
SPACECRAFT_CLOCK_STOP_COUNT
= "2/0859086298.37980"
ORBIT_NUMBER
= "NULL"
OBSERVATION_TYPE
= "FRT"
OBSERVATION_ID
= "16#00004ECA#"
MRO:OBSERVATION_NUMBER
= 16#07#
MRO:ACTIVITY_ID
= "SC166"
MRO:SENSOR_ID
= "L"
PRODUCT_VERSION_ID
= "0"
PRODUCER_INSTITUTION_NAME
= "JOHNS HOPKINS UNIVERSITY
APPLIED PHYSICS LABORATORY"
SOFTWARE_NAME
= "pipe_edrslice"
SOFTWARE_VERSION_ID
= "4.3"
/* EDR
Instrument and Observation Parameters */
/* for
first frame */
TARGET_CENTER_DISTANCE
= NULL <KM>
SOLAR_DISTANCE
= NULL <KM>
SHUTTER_MODE_ID
= OPEN
LIGHT_SOURCE_NAME
= "NONE"
MRO:CALIBRATION_LAMP_STATUS
= "OFF"
MRO:CALIBRATION_LAMP_LEVEL
= "N/A"
PIXEL_AVERAGING_WIDTH
= 1
MRO:INSTRUMENT_POINTING_MODE
= "DYNAMIC POINTING"
SCAN_MODE_ID
= SHORT
MRO:FRAME_RATE
= 3.75 <HZ>
MRO:EXPOSURE_PARAMETER
= 301
SAMPLING_MODE_ID
= "HYPERSPEC"
COMPRESSION_TYPE
= "NONE"
MRO:WAVELENGTH_FILTER
= 0
MRO:WAVELENGTH_FILE_NAME
= "CDR6_1_0000000000_WV_L_1.TAB"
MRO:PIXEL_PROC_FILE_NAME
= "CDR6_1_0000000000_PP_L_1.TAB"
MRO:LOOKUP_TABLE_FILE_NAME
= "CDR6_1_0000000000_LK_J_0.TAB"
/*
These parameters describe the browse image as a PDS document. */
^DOCUMENT
= "FRT00004ECA_07_SC166L_RAW0.PNG"
OBJECT
= DOCUMENT
DOCUMENT_NAME = "FRT00004ECA_07_SC166L_RAW0"
DOCUMENT_FORMAT = PNG
DOCUMENT_TOPIC_TYPE = "BROWSE IMAGE"
INTERCHANGE_FORMAT = BINARY
PUBLICATION_DATE = 2007-04-06
SOURCE_PRODUCT_ID = "FRT00004ECA_07_SC166L_EDR0"
LINES = 480
LINE_SAMPLES = 640
SAMPLE_TYPE = MSB_UNSIGNED_INTEGER
SAMPLE_BITS = 8
DERIVED_MINIMUM = 0
DERIVED_MAXIMUM = 250
OFFSET = -145.522
SCALING_FACTOR = 0.299
MISSING_CONSTANT = 255
DESCRIPTION = "This file is a scaled median image of raw DN level
in a CRISM EDR. The x-y coordinates of the image
are spatial and in sensor space (not map-
projected), where x = detector column and y = frame
number within an EDR. The encoded 8-bit value at
each x-y location is the scaled median of the
values at all wavelengths."
END_OBJECT
= DOCUMENT
END
PDS_VERSION_ID = PDS3
RECORD_TYPE = UNDEFINED
LABEL_REVISION_NOTE =
"2012-03-06, H. Taylor, F. Seelos (JHU/APL)
Initial TER/MTRDR labels for CRISM Data Users'
Workshop;
2014-01-09, G. Romeo, J. Aiello, F. Seelos
(JHU/APL)
Complete TER/MTRDR label set for preliminary
PDS review;
2014-04-08, G. Romeo, J. Aiello, R. Espiritu,
F. Seelos (JHU/APL)
TER/MTRDR label set revisions completed for PDS
peer review;
2014-08-14, G. Romeo, J. Aiello, F. Seelos
(JHU/APL)
PDS peer review TER/MTRDR label set liens
retired;"
^PNG_DOCUMENT =
"FRT00002F7F_07_BRTANJ_TER3.PNG"
^ENVI_HEADER =
"FRT00002F7F_07_BRTANJ_TER3.HDR"
^IMAGE =
"FRT00002F7F_07_BRTANJ_TER3.IMG"
/* Targeted RDR Browse Product Identification */
DATA_SET_ID =
"MRO-M-CRISM-4-RDR-TARGETED-V1.0"
PRODUCT_ID =
"FRT00002F7F_07_BRTANJ_TER3"
/*
cccnnnnnnnn_xx_ooaaas_TERv */
/* ccc = Class
Type */
/* nnnnnnnn =
Observation ID, hexadecimal */
/* ooaaa = Image
type, browse type */
/* xx = counter this
observation (hex) */
/* s = Sensor ID (J
for Joined) */
/* v = Version
number */
INSTRUMENT_HOST_NAME = "MARS
RECONNAISSANCE ORBITER"
SPACECRAFT_ID = MRO
INSTRUMENT_NAME = "COMPACT
RECONNAISSANCE IMAGING
SPECTROMETER FOR
MARS"
INSTRUMENT_ID = CRISM
TARGET_NAME = MARS
PRODUCT_TYPE = TARGETED_BROWSE
PRODUCT_CREATION_TIME = 2015-06-11T04:43:17
START_TIME = 2006-11-11T13:21:36.054
STOP_TIME =
2006-11-11T13:23:59.788
SPACECRAFT_CLOCK_START_COUNT =
"2/0847718514.58200"
SPACECRAFT_CLOCK_STOP_COUNT =
"2/0847718658.40771"
ORBIT_NUMBER = 1374
OBSERVATION_TYPE = "FRT"
OBSERVATION_ID =
"16#00002F7F#"
MRO:OBSERVATION_NUMBER = 16#07#
MRO:ACTIVITY_ID = "IF168"
MRO:SENSOR_ID = "J"
/* Detector and FPE temperature refer to IR
component of observation */
MRO:DETECTOR_TEMPERATURE = -163.287
MRO:OPTICAL_BENCH_TEMPERATURE = -52.315
MRO:SPECTROMETER_HOUSING_TEMP = -75.764
MRO:SPHERE_TEMPERATURE = -52.275
MRO:FPE_TEMPERATURE = -0.375
PRODUCT_VERSION_ID = "3"
PRODUCER_INSTITUTION_NAME = "JOHNS HOPKINS
UNIVERSITY
APPLIED PHYSICS
LABORATORY"
SOFTWARE_NAME =
"mtrdr_pipeline"
SOFTWARE_VERSION_ID = "1.0"
/* Targeted RDR Observation and Processing
Parameters */
SOLAR_DISTANCE = 236036552.409150
<KILOMETER>
SOLAR_LONGITUDE = 133.840086
MRO:PHOTOMETRIC_CORR_FLAG = "ON"
MRO:ATMOSPHERIC_CORR_FLAG = "ON"
MRO:RATIO_SHIFT_CORR_FLAG = "ON"
MRO:EMPIRICAL_GEOM_NORM_FLAG = "ON"
MRO:EMPIRICAL_SMILE_CORR_FLAG = "ON"
MRO:SENSOR_SPACE_TRANSFORM_FLAG = "ON"
/* These parameters describe the browse image as a
PDS document. */
/* The browse IMG and PNG products are identical in
the RED, GREEN, */
/* and BLUE channels. The PNG product includes an
additional ALPHA */
/* transparency channel in which the non-scene
pixels are marked */
/* as
transparent. */
OBJECT = PNG_DOCUMENT
DOCUMENT_NAME =
"FRT00002F7F_07_BRTANJ_TER3"
DOCUMENT_FORMAT = PNG
DOCUMENT_TOPIC_TYPE = "BROWSE IMAGE"
INTERCHANGE_FORMAT = BINARY
PUBLICATION_DATE = 2013-12-15
DESCRIPTION = "An enhanced visible
to infrared false color
representation of the scene."
END_OBJECT = PNG_DOCUMENT
/* ENVI header description */
/* The ENVI header is a separate ASCII file that
includes basic image */
/* data file characteristics and allows the image
data to be loaded */
/* directly into the ENVI image processing software
available bands */
/*
list. */
OBJECT = ENVI_HEADER
HEADER_TYPE = "ENVI"
INTERCHANGE_FORMAT = "ASCII"
BYTES = 479
DESCRIPTION = "This text file can
be used by ENVI image
processing software to read in the
image."
END_OBJECT = ENVI_HEADER
/* This Targeted Empirical Record label describes a
multiple-band */
/* image file containing a byte scaled browse
product derived from */
/* selected refined spectral summary
parameters. */
OBJECT = IMAGE
LINES = 540
LINE_SAMPLES = 640
SAMPLE_TYPE = LSB_UNSIGNED_INTEGER
SAMPLE_BITS = 8
DESCRIPTION = "TAN_BROWSE_PRODUCT"
BANDS = 3
BAND_STORAGE_TYPE = BAND_SEQUENTIAL
BAND_SEQUENCE = "(RED, GREEN,
BLUE)"
BAND_NAME = ( "R2529",
"R1330", "R770")
/* The following information to scale from real
numbers to an */
/* 8-bit integer for this type of browse
image. */
DERIVED_MINIMUM = ( 0, 0, 0)
DERIVED_MAXIMUM = ( 254, 254, 254 )
OFFSET = ( 1.0480E-01, 1.4055E-01,
1.6392E-01)
SCALING_FACTOR = ( 1.7353E-03, 1.2948E-03,
1.1004E-03)
END_OBJECT = IMAGE
END
PDS_VERSION_ID = PDS3
RECORD_TYPE = UNDEFINED
LABEL_REVISION_NOTE =
"2012-03-06, H. Taylor, F. Seelos (JHU/APL)
Initial TER/MTRDR labels for CRISM Data Users'
Workshop;
2014-01-09, G. Romeo, J. Aiello, F. Seelos
(JHU/APL)
Complete TER/MTRDR label set for preliminary
PDS review;
2014-04-08, G. Romeo, J. Aiello, R. Espiritu,
F. Seelos (JHU/APL)
TER/MTRDR label set revisions completed for PDS
peer review;
2014-08-14, G. Romeo, J. Aiello, F. Seelos
(JHU/APL)
PDS peer review TER/MTRDR label set liens
retired;"
^PNG_DOCUMENT =
"FRT00002F7F_07_BRTANJ_MTR3.PNG"
^ENVI_HEADER =
"FRT00002F7F_07_BRTANJ_MTR3.HDR"
^IMAGE =
"FRT00002F7F_07_BRTANJ_MTR3.IMG"
/* Map-Projected Targeted RDR Browse Product
Identification */
DATA_SET_ID =
"MRO-M-CRISM-5-RDR-MPTARGETED-V1.0"
PRODUCT_ID =
"FRT00002F7F_07_BRTANJ_MTR3"
/*
cccnnnnnnnn_xx_ooaaas_MTRv */
/* ccc = Class
Type */
/* nnnnnnnn =
Observation ID, hexadecimal */
/* ooaaa = Image
type, browse type */
/* xx = counter this
observation (hex) */
/* s = Sensor ID (J
for Joined) */
/* v = Version
number */
INSTRUMENT_HOST_NAME = "MARS
RECONNAISSANCE ORBITER"
SPACECRAFT_ID = MRO
INSTRUMENT_NAME = "COMPACT
RECONNAISSANCE IMAGING
SPECTROMETER FOR
MARS"
INSTRUMENT_ID = CRISM
TARGET_NAME = MARS
PRODUCT_TYPE = MPTARGETED_BROWSE
PRODUCT_CREATION_TIME = 2015-06-11T20:21:31
START_TIME =
2006-11-11T13:21:36.054
STOP_TIME =
2006-11-11T13:23:59.788
SPACECRAFT_CLOCK_START_COUNT =
"2/0847718514.58200"
SPACECRAFT_CLOCK_STOP_COUNT =
"2/0847718658.40771"
ORBIT_NUMBER = 1374
OBSERVATION_TYPE = "FRT"
OBSERVATION_ID =
"16#00002F7F#"
MRO:OBSERVATION_NUMBER = 16#07#
MRO:ACTIVITY_ID = "IF168"
MRO:SENSOR_ID = "J"
/* Detector and FPE temperature refer to IR
component of observation */
MRO:DETECTOR_TEMPERATURE = -163.287
MRO:OPTICAL_BENCH_TEMPERATURE = -52.315
MRO:SPECTROMETER_HOUSING_TEMP = -75.764
MRO:SPHERE_TEMPERATURE = -52.275
MRO:FPE_TEMPERATURE = -0.375
PRODUCT_VERSION_ID = "3"
PRODUCER_INSTITUTION_NAME = "JOHNS HOPKINS
UNIVERSITY
APPLIED PHYSICS
LABORATORY"
SOFTWARE_NAME =
"mtrdr_pipeline"
SOFTWARE_VERSION_ID = "1.0"
/* Targeted RDR Observation and Processing
Parameters */
SOLAR_DISTANCE = 236036552.409150
<KILOMETER>
SOLAR_LONGITUDE = 133.840086
MRO:PHOTOMETRIC_CORR_FLAG = "ON"
MRO:ATMOSPHERIC_CORR_FLAG = "ON"
MRO:RATIO_SHIFT_CORR_FLAG = "ON"
MRO:EMPIRICAL_GEOM_NORM_FLAG = "ON"
MRO:EMPIRICAL_SMILE_CORR_FLAG = "ON"
MRO:SENSOR_SPACE_TRANSFORM_FLAG = "ON"
/* These parameters describe the browse image as a
PDS document. */
/* The browse IMG and PNG products are identical in
the RED, GREEN, */
/* and BLUE channels. The PNG product includes an
additional ALPHA */
/* transparency channel in which the non-scene
pixels are marked */
/* as
transparent. */
OBJECT = PNG_DOCUMENT
DOCUMENT_NAME =
"FRT00002F7F_07_BRTANJ_MTR3"
DOCUMENT_FORMAT = PNG
DOCUMENT_TOPIC_TYPE = "BROWSE IMAGE"
INTERCHANGE_FORMAT = BINARY
PUBLICATION_DATE = 2013-12-15
DESCRIPTION = "An enhanced visible
to infrared false color
representation of the scene."
END_OBJECT = PNG_DOCUMENT
/* ENVI header description */
/* The ENVI header is a separate ASCII file that
includes basic image */
/* data file characteristics and allows the image
data to be loaded */
/* directly into the ENVI image processing software
available bands */
/*
list. */
OBJECT = ENVI_HEADER
HEADER_TYPE = "ENVI"
INTERCHANGE_FORMAT = "ASCII"
BYTES = 1233
DESCRIPTION = "This text file can
be used by ENVI image
processing software to read in the
image."
END_OBJECT = ENVI_HEADER
/* This Map-Projected Targeted RDR label describes a
multiple-band */
/* image file containing a byte scaled browse
product derived from */
/* selected refined spectral summary
parameters. */
OBJECT = IMAGE
LINES = 761
LINE_SAMPLES = 880
SAMPLE_TYPE = LSB_UNSIGNED_INTEGER
SAMPLE_BITS = 8
DESCRIPTION = "TAN_BROWSE_PRODUCT"
BANDS = 3
BAND_STORAGE_TYPE = BAND_SEQUENTIAL
BAND_SEQUENCE = "(RED, GREEN,
BLUE)"
BAND_NAME = ( "R2529",
"R1330", "R770")
/* The following information to scale from real
numbers to an */
/* 8-bit integer for this type of browse
image. */
DERIVED_MINIMUM = ( 0, 0, 0)
DERIVED_MAXIMUM = ( 254, 254, 254 )
OFFSET = ( 1.0480E-01, 1.4055E-01,
1.6392E-01)
SCALING_FACTOR = ( 1.7353E-03, 1.2948E-03,
1.1004E-03)
END_OBJECT = IMAGE
/* Map projection information about this RDR is in
the */
/* IMAGE_MAP_PROJECTION object
below. */
OBJECT =
IMAGE_MAP_PROJECTION
^DATA_SET_MAP_PROJECTION =
"MTR_MAP.CAT"
MAP_PROJECTION_TYPE = "POLAR
STEREOGRAPHIC"
A_AXIS_RADIUS = 3396.190000000000
<KILOMETER>
B_AXIS_RADIUS = 3396.190000000000
<KILOMETER>
C_AXIS_RADIUS = 3376.200000000000
<KILOMETER>
POSITIVE_LONGITUDE_DIRECTION = EAST
CENTER_LATITUDE = 90.0000000
<DEGREE>
CENTER_LONGITUDE = 0.0000000
<DEGREE>
LINE_FIRST_PIXEL = 1
<PIXEL>
LINE_LAST_PIXEL = 761
<PIXEL>
SAMPLE_FIRST_PIXEL = 1
<PIXEL>
SAMPLE_LAST_PIXEL = 880
<PIXEL>
MAP_PROJECTION_ROTATION = 0.0000000
<DEGREE>
MAP_RESOLUTION = 3293.0387513
MAP_SCALE = 0.0180000
MINIMUM_LATITUDE = 84.8928520
<DEGREE>
MAXIMUM_LATITUDE = 85.2014640
<DEGREE>
WESTERNMOST_LONGITUDE = -22.8965470
<DEGREE>
EASTERNMOST_LONGITUDE = -19.0829150
<DEGREE>
LINE_PROJECTION_OFFSET = -14945.9116667
<PIXEL>
SAMPLE_PROJECTION_OFFSET = 6313.7611111
<PIXEL>
COORDINATE_SYSTEM_TYPE = "BODY-FIXED
ROTATING"
COORDINATE_SYSTEM_NAME =
"PLANETOCENTRIC"
END_OBJECT =
IMAGE_MAP_PROJECTION
END
PDS_VERSION_ID = PDS3
RECORD_TYPE = UNDEFINED
LABEL_REVISION_NOTE = "2003-11-19, S. Slavney
(GEO);
2005-09-25, S. Murchie
(JHU/APL);
2007-03-09, E. Malaret (ACT
Corp.);
2007-09-14, C. Hash (ACT Corp);
2022-04-28 G. Romeo, F. Seelos,
K. Hancock,
R. Poffenbarger
(JHU/APL);"
^PNG_DOCUMENT =
"T1018_MRRTRU_00N358_0327_4.PNG"
^ENVI_HEADER =
"T1018_MRRTRU_00N358_0327_4.HDR"
^IMAGE =
"T1018_MRRTRU_00N358_0327_4.IMG"
/* Multispectral Reduced Data Record (MRDR) Product Identification
*/
DATA_SET_ID =
"MRO-M-CRISM-5-RDR-MULTISPECTRAL-V1.0"
PRODUCT_ID =
"T1018_MRRTRU_00N358_0327_4"
/*(
TNNNN_MRRss_yydxxx_rrrr_v )*/
/*( NNNN = tile
number )*/
/*( ss = subtype of image
product )*/
/*( yy = latitude of upper left
corner )*/
/*( d = N or S for north or south
latitude )*/
/*( xxx = east longitude of upper
left corner )*/
/*( rrrr = resolution in
pixels/degree )*/
/*( v = version
number )*/
INSTRUMENT_HOST_NAME = "MARS RECONNAISSANCE
ORBITER"
SPACECRAFT_ID = MRO
INSTRUMENT_NAME = "COMPACT RECONNAISSANCE
IMAGING
SPECTROMETER FOR MARS"
INSTRUMENT_ID = CRISM
TARGET_NAME = MARS
PRODUCT_TYPE = MAP_PROJECTED_MULTISPECTRAL_RDR
PRODUCT_CREATION_TIME = 2022-09-30
START_TIME = "N/A"
STOP_TIME = "N/A"
SPACECRAFT_CLOCK_START_COUNT = "N/A"
SPACECRAFT_CLOCK_STOP_COUNT = "N/A"
PRODUCT_VERSION_ID = "4"
PRODUCER_INSTITUTION_NAME = "JOHNS HOPKINS UNIVERSITY
APPLIED PHYSICS
LABORATORY"
SOFTWARE_NAME =
"crism_mapping_execute_flow"
SOFTWARE_VERSION_ID = "1.03.94"
MRO:WAVELENGTH_FILE_NAME = "N/A"
/* This Map Projected Multispectral RDR label describes one data
file: */
/* 1. A multiple-band image file of calibrated RDR data in
radiance, */
/* reflectance, or quantities derived therein, or related
ancillary information. */
/* This RDR represents one latitude-longitude bin in a global
map. */
/* See the Map Projection Object below for bin coordinates and
resolution. */
/* See the CRISM Data Products SIS for more detailed
description. */
/* Description of MAP PROJECTED MULTISPECTRAL RDR REFLECTANCE
IMAGE file */
/* MRO:PHOTOMETRIC_CORR_FLAG = "ON" */
/* MRO:ATMOSPHERIC_CORR_FLAG = "ON" */
/* MRO:RATIO_SHIFT_CORR_FLAG = "ON" */
/* MRO:EMPIRICAL_GEOM_NORM_FLAG = "OFF" */
/* MRO:EMPIRICAL_SMILE_CORR_FLAG = "ON" */
/* MRO:SENSOR_SPACE_TRANSFORM_FLAG = "ON" */
/* These parameters describe the browse image as a PDS document.
*/
OBJECT = PNG_DOCUMENT
DOCUMENT_NAME = "T1018_MRRTRU_00N358_0327_4"
DOCUMENT_FORMAT = PNG
DOCUMENT_TOPIC_TYPE = "BROWSE IMAGE"
INTERCHANGE_FORMAT = BINARY
PUBLICATION_DATE = 2022-09-30
SOURCE_PRODUCT_ID = "T1018_MRRTRU_00N358_0327_4"
SAMPLE_TYPE = LSB_UNSIGNED_INTEGER
SAMPLE_BITS = 8
BANDS = 4
BAND_SEQUENCE = ( "RED", "GREEN",
"BLUE", "ALPHA")
BAND_NAME = ( "R600", "R530",
"R440" "ALPHA")
/* The following information is to be used to scale from real */
/* numbers to an 8-bit integer for this type of browse image. */
DERIVED_MINIMUM = ( 0, 0, 0, 0 )
DERIVED_MAXIMUM = ( 254, 254, 254, 255 )
OFFSET = ( 1.0668E-01, 6.6755E-02, 3.4955E-02,
0.0000E+00)
SCALING_FACTOR = ( 2.9744E-04, 1.2229E-04, 5.4318E-05,
1.0000E+00)
DESCRIPTION = "An enhanced natural color
representation of the
scene with wavelengths selected across the visible
spectrum."
END_OBJECT = PNG_DOCUMENT
/* ENVI header
description */
/* The ENVI header is a separate ASCII file that includes
basic */
/* image data file characteristics and allows the image data to
be */
/* loaded directly into the ENVI image processing software
available */
/* bands
list. */
OBJECT = ENVI_HEADER
HEADER_TYPE = "ENVI"
INTERCHANGE_FORMAT = "ASCII"
BYTES = 1231
DESCRIPTION = "This text file can be used by
ENVI image
processing software to read in the image."
END_OBJECT = ENVI_HEADER
OBJECT = IMAGE
LINES = 1636
LINE_SAMPLES = 1636
SAMPLE_TYPE = LSB_UNSIGNED_INTEGER
SAMPLE_BITS = 8
BANDS = 3
BAND_STORAGE_TYPE = BAND_SEQUENTIAL
BAND_SEQUENCE = "(RED, GREEN, BLUE)"
BAND_NAME = ( "R600", "R530",
"R440")
/* The following information is to be used to scale from real */
/* numbers to an 8-bit integer for this type of browse image. */
DERIVED_MINIMUM = ( 0, 0, 0)
DERIVED_MAXIMUM = ( 254, 254, 254 )
OFFSET = ( 1.0668E-01, 6.6755E-02, 3.4955E-02)
SCALING_FACTOR = ( 2.9744E-04, 1.2229E-04, 5.4318E-05)
MISSING_CONSTANT = 255
END_OBJECT = IMAGE
/* Map projection information about this RDR is in the
IMAGE_MAP_PROJECTION */
/* object
below. */
OBJECT = IMAGE_MAP_PROJECTION
^DATA_SET_MAP_PROJECTION = "MRR_MAP.CAT"
MAP_PROJECTION_TYPE = "EQUIRECTANGULAR"
A_AXIS_RADIUS = 3396.190000000000
<KILOMETER>
B_AXIS_RADIUS = 3396.190000000000
<KILOMETER>
C_AXIS_RADIUS = 3396.190000000000
<KILOMETER>
POSITIVE_LONGITUDE_DIRECTION = EAST
CENTER_LATITUDE = 0.0000000 <DEGREE>
CENTER_LONGITUDE = -2.5000000 <DEGREE>
LINE_FIRST_PIXEL = 1 <PIXEL>
LINE_LAST_PIXEL = 1636 <PIXEL>
SAMPLE_FIRST_PIXEL = 1 <PIXEL>
SAMPLE_LAST_PIXEL = 1636 <PIXEL>
MAP_PROJECTION_ROTATION = 0.0000000 <DEGREE>
MAP_RESOLUTION = 326.9999786
MAP_SCALE = 0.1812682
MINIMUM_LATITUDE = -2.5000000 <DEGREE>
MAXIMUM_LATITUDE = 2.5000000 <DEGREE>
WESTERNMOST_LONGITUDE = -5.0000000 <DEGREE>
EASTERNMOST_LONGITUDE = 0.0000000 <DEGREE>
LINE_PROJECTION_OFFSET = 817.1448417 <PIXEL>
SAMPLE_PROJECTION_OFFSET = 817.2648722 <PIXEL>
COORDINATE_SYSTEM_TYPE = "BODY-FIXED ROTATING"
COORDINATE_SYSTEM_NAME = "PLANETOCENTRIC"
END_OBJECT = IMAGE_MAP_PROJECTION
END
Dave Humm and Scott Murchie
Updated 2/1/2018
(Describes the TRDR
calibration pipeline, v3)
Darks will
be taken bracketing every targeted measurement as part of the macro for that
targeted measurement. Darks will be taken every 5 minutes in mapping mode.
Onboard
integrating sphere calibration data will be taken
with the IR lamp at
nominally fixed intervals in time. The plan is to take sphere calibrations
once every 1.5 orbits, bracketing scene observations with a dayside and
nightside sphere observation. The idea is that the IR detector will be
relatively warm (by a degree or so, maybe much less) on the dayside and
relatively cool on the nightside. To correct the radiometric calibration for
detector temperature, we interpolate in indicated detector temperature between
the dayside and nightside sphere calibrations. In some cases, we will skip an
extra orbit or two between the dayside and nightside due to restrictions on
scheduling. The primary sphere lamp is lamp 1, the IR-controlled “cross-slit”
lamp, and these data are used for all calibrations (as of 12/16/2008).
Integrating sphere data with lamp 2, the VNIR-controlled “along-slit” lamp,
will be taken on the same schedule for redundancy. As of 12/28/2010, the
dayside and nightside calibration observations are taken, and the software has
the capacity to interpolate between them, but that capacity is not used. Only
one sphere observation is used to calibrate a given scene. The temperature
changes have not proven significant, and using just one sphere observation
reduces the injection of noise.
Bias
calibration data, darks with multiple integration times, will be taken at
nominally fixed intervals for the IR detector only. Currently, the default is
to take a bias set with every integrating sphere calibration measurement. There is a specific
macro for the bias calibration.
Focal
plane lamp data are taken
occasionally. The focal plane lamp data are not used in the
calibration algorithm, so this is just for verification and engineering
checkout. There is a specific macro for the focal plane lamp calibration.
A
nadir-pointed hyperspectral swath of a featureless region of Mars is taken at a
nominally fixed interval. Currently, the plan is to take these data monthly.
These data will be used to flat-field the VNIR detector at all wavelengths and
the IR detector at wavelengths where there are no sharp atmospheric spectral
features. As of 12/28/2010 (the “TRR3 calibration”), hundreds of flat field
swathes had been taken, and a median of all of them was used for flat-fielding.
- Use
pixel processing table and LUT tables
to convert 8-bit data to 12-bit if data are 8-bit. See section 2.2.
- Use
pixel processing table to convert 12-bit data to 14-bit data. See section 2.2.
- Subtract
bias calculated from nearest available flight bias calibration data set.
For IR only. Apply to scene images and darks. See sections 2.3 and 3.1.
- Subtract
darks from scene images. VNIR only. Use a weighted average of darks
taken before and after the target image, with the weighting factors
derived from the relative time at which each dark was taken with respect
to the scene image. See sections 2.3 and 3.2.
- Make
detector quadrant ghost correction applying coefficients from ground
calibration to each quadrant within each image. For IR, apply to darks as
well. See section 2.4.
- Subtract
median of masked pixels in each image frame. For VNIR only. The IR
correction is done later in the pipeline. See section 2.5.
- Apply
a priori bad pixel mask to all images, replacing bad pixels with a linear
spatial nearest-neighbor interpolation. For VNIR there’s a single dead
pixel only in full-resolution images, defined by a CDR. For IR, we
calculate the bad pixel mask for each image using the set of associated
dark and bias images. Replace saturated pixels with 65535. See section 2.7.
- Apply
overall detector nonlinearity correction to scene images. For IR, apply
to darks as well. See section 2.8.
- Divide
by integration time to get counts/millisecond. See sections 2.9 and 3.2.
- Subtract
processed darks from processed scene images. Use a weighted average of
darks taken before and after the scene image, with the weighting factors
derived from the relative time at which each dark was taken with respect
to the scene image. For IR only. See section 2.10.
- Subtract
median of masked pixels in each image frame. For IR only. The VNIR
correction is done earlier in the pipeline. See section 2.11.
- Apply
stray light subtraction using stray light pixels within each image. VNIR
only. For IR, the sphere radiance is adjusted to account for stray light
and there is no explicit correction. The formula for the VNIR correction
is complex. See section 3.4.
- Apply
subtraction of 2nd order leaked light in Zone 3 of IR detector
using Zone 1 and 2 counts from same image and ground-derived
coefficients. For IR only. See section 3.5.
- Apply
shutter mirror nonrepeatability correction to ground integrating sphere radiance. This corrects the
ground-measured radiance of the integrating sphere to the shutter mirror
position in the flight calibration sphere data. Uses flight calibration
sphere data to correct ground sphere radiance. No effect on flight scene
or calibration images, but it does use data from the flight calibration
image, so it must be performed in sequence after the previous calibration
steps. See section 3.4.
- Calculate
spectroradiometric responsivity using nearest available flight integrating
sphere data and
ground sphere radiance. This spectrum is a function of wavelength pixel
and spatial pixel. For VNIR detector rows 185-215 (short wavelengths),
the responsivity is simply read from a CDR, not calculated from a sphere
image, because the sphere is too dim. See section 3.5.
- Apply
binning to
responsivity for the different modes. See section 2.14.
- Divide
corrected counts/second in the scene images by the binned responsivity to
get radiance at the instrument aperture. Note that before the radiance is
calculated, the scene data sets should be processed using steps 1-14
above. See section 2.14.
- Divide
radiance image by image of external flat field. See section 2.14.
- Apply ex
post facto bad pixel removal algorithm to scene images. See section 2.15.
- Replace
non-scene pixels with the value 65535. See section 2.15.
Radiometric
calibration to units of radiance follows the equation
RDx,l,r = Mx,l,Hz( ( Kx,l,Hz( D14l( DNx,l,TaV,TaW,TaI,TaJ,Ta2,Hz,t,r
) - BiaTx,l,TaV,TaW,TaI,TaJ,Hz,t
)/t - Bkgdx,l,TaI,Ta2,Hz - Scatx,l,TaV,TaI,Ta2,Hz,r ) / ( RSTx,l,TaV,TaI,Ta2 * FFx,l,Hz ) )
Diffuse
spectral reflectivity (I/F) is calculated by
IFx,l = p · RDx,l,r / ( SFx,l / r2 )
Subscripts include:
·
x, spatial
position in a row on the focal plane, in detector elements
·
l, wavelength
in spectral direction on the focal plane, in detector elements or nm
·
Hz,
frame rate, wavelength table, and binning mode
·
TaI,
IR detector temperature in K for scene measurement
·
TaV,
VNIR detector temperature in K for scene measurement
·
Ta2,
spectrometer housing temperature in K
·
Tc3,
temperature of the integrating sphere in K for flight calibration
measurement
·
TaJ,
IR focal plane board temperature in K for scene measurement
·
TaW,
VNIR focal plane board temperature in K for scene measurement
·
t, integration
time in seconds
·
s, choice
of sphere bulb, side 1 or 2
Temperatures
are given for scene measurements, bias measurements, calibration measurements,
or first and second dark measurements according to the lowercase subscripts a,
b, c, d, and e respectively. So, for example, TaI would be the IR
detector temperature for the scene image, TdI would be the IR
detector temperature for the “before” dark image, TeI for the
“after” dark image, TcI would be the IR detector temperature for the
associated flight calibration images, and TbI would be the IR
detector temperature for the associated bias measurement. The algorithm uses
temperatures from the low-rate telemetry. The temperatures are taken once per
second and a 10-point median smoothing is applied.
Subscripts indicate which terms in the equation are dependent on which
parameters. This includes both explicit and implicit dependence, and excludes
when an implicit dependence has been explicitly subtracted out. For example,
the Bkgdx,l,TaI,Ta2,Hz term
includes background from the IR glow of the inside walls of the spectrometer,
so it depends on the spectrometer temperature Ta2. Bkgdx,l,TaI,Ta2,Hz
is calculated from dark images with
spectrometer temperatures Td2 and Te2, but the
calculation is designed to give the level of the background for the target
measurement spectrometer temperature Ta2. The explicit dependence
on Td2 and Te2 has been subtracted out, leaving an
implicit dependence on Ta2, so Ta2 is in the subscript.
Description
of the terms of the equation:
D14l( ) converts from raw DN to 14-bit DN.
BiaTx,l,TaV,TaW,TaI,TaJ,Hz,t is the detector bias (DN at zero
integration time).
Kx,l,Hz( ) flags saturated
pixels and applies the detector ghost, VNIR dark column subtract, initial bad
pixel, and detector nonlinearity corrections.
Bkgdx,l,TaI,Ta2,Hz is the dark
subtraction term calculated from shutter-closed measurements and IR dark column
subtract.
Scatx,l,TaV,TaI,Ta2,Hz,r is the stray light
subtraction, including diffuse scatter for VNIR and 2nd order light for IR.
RSTx,l,TaV,TaI,Ta2 is the responsivity
calculated from flight onboard sphere calibration images.
Mx,l,Hz( ) applies the
detector mask and the final scene bad pixel correction.
FFx,l,Hz is the flat field.
RDx,l,r is the observed
spectral radiance in W/(m2 micrometer sr) at the instrument
aperture.
SFx,l is solar spectral irradiance for a
normally illuminated surface 1 AU from the Sun, convolved to the CRISM
spectral profiles.
r is the distance of
Mars from the Sun in astronomical units.
IFx,l is the I/F of the scene (unitless), a
measure of diffuse reflectivity.
Definition
of the terms of the equation:
The
value 65535 is treated as a flag and any pixel with that value does not receive
any further calibration. Pixels with the value 65535 may be replaced as part
of the ex post facto bad pixel correction, however. See Section Error! Reference
source not found..
D14l( DNx,l,TaV,TaI,Ta2,Hz,t,r ) = Offsetl + ILUTl ( DNx,l,TaV,TaI,Ta2,Hz,t,r ) / Gainl
This
is conversion from raw DN (raw DN has fast lossless compression undone) to 14-bit
DN. See section 2.2.
BiaTx,l,TaI,TaJ,Hz,t = Biasx,l,TbI,TbJ,Hz - a0I
· Hv(rowl+1-(502/480) · (480-integ(t)))
+ bI,Hz · ( TaI - TbI
) - bJ,Hz · ( TaJ - TbJ
)
for IR
and
BiaTx,l,TaV,TaW,Hz,t = ( aea · Biasx,l,TdV,TdW,Hz,t + aad · Biasx,l,TeV,TeW,Hz,t ) / ( aad + aea )
+ bV,Hz · [ aea · ( TaV
- TdV ) + aad · ( TeV
- TaV ) ] / ( aad + aea )
+
bW,Hz · [ aea · ( TaW
- TdW ) + aad · ( TeW
- TaW ) ] / ( aad + aea )
for
VNIR is the temperature-corrected bias subtraction. The masked pixel
subtraction renders the detector temperature correction redundant, but it is
still performed. See section 2.3 and section 3.1.
Kx,l,Hz( ) = FHz( S( Bx,l,Hz(H( ) ) ) ) for IR and
Kx,l,Hz( ) = FHz( S( Bx,l,Hz(H( ) - medianx,l ( DN14bx1...xn,l0...ls,TaV,TaW,Hz,t,r
) ) ) ) for VNIR
applies
the detector ghost correction, applies the masked pixel (dark column) subtract
for VNIR only, applies the a priori bad pixel correction, flags saturated
pixels, and applies the detector nonlinearity correction.
H(
DN14ax,l,TaV,TaI,Ta2,Hz,t,r ) = DN14ax,l,TaV,TaI,Ta2,Hz,t,r – Sn=0n=3 G( DN14ax0+n·d,l,TaV,TaI,Ta2,Hz,t,r
)
applies
the detector quadrant ghost correction.
Bx,l,Hz( ) is the a priori bad pixel removal function.
S(
DN14dx,l,TaV,TaI,Ta2,Hz,t,r ) = 65565 if DN14cx,l,TaV,TaI,Ta2,Hz,t,r > DN14cmaxI for IR or DN14cmaxV
for VNIR.
Bkgdx,l,TaI,Ta2,Hz = Bkgdx,l,TdI,TeI,Td2,Te2,Hz,ta1,td1,te1 is the dark-subtraction term. It is zero for VNIR. The
parameters in the subscripts on the right-hand side are explicitly used to
calculate a value of the background that should be implicitly dependent only on
the parameters in the subscripts on the left-hand side. The dark-subtraction
term in the calibration equation also includes an IR masked pixel (dark column)
correction term. Note those masked pixels themselves have dark subtraction
applied before they are used for the masked pixel correction.
Scatx,l,TaI,Ta2,Hz,r = Sn=1n=6 kx,l,n,Hz · RT14ix,l’=yn,Hz,TaI,Ta2,Hz,r
for IR comprises the stray light correction for second
order.
Scatx,l,TaI,Ta2,Hz,r = { <RT14hhx1…xn,l,TaV,TaI,Ta2,Hz,r> ∙ SWhhx,TaV,TaI,Ta2,Hz
} for l <
563 nm and
{
<RT14hhx1…xn,l,TaV,TaI,Ta2,Hz,r>
∙ CShhx,l,TaV,TaI,Ta2,Hz
} for l > 563 nm
for VNIR
comprises the stray light correction for scattered light.
RSTx,l,TaI,Ta2 = ( RSPjx,l,TcI,Tc2 · ( TaI – TfI
) + RSPjx,l,TfI,Tf2 · ( TcI – TaI ) ) / ( TcI – TfI
)
for
IR, where TcI and TfI are the IR detector temperatures
for the dayside and nightside sphere calibrations
respectively. As of
12/30/2008, this capability is in the code but is not being utilized. We just
use the nearest IR flight integrating sphere data twice.
RSTx,l,TaV,Ta2 = RSPjx,l,TcV,Tc2 · ( mx,l + nx,l · TaV + px,l ·
TaV2 ) / ( mx,l + nx,l ·
TcV + px,l · TcV2
)
for VNIR is the temperature-corrected CRISM responsivity
calculated from the flight onboard sphere calibration measurements. As of 12/30/2008, m=1, n=0,
and p=0, so the correction is not applied. See section 3.4, section 3.5, and section
FFx,l,Hz = FL x,l,Hz + EP x,l,Hz · log( RTjx,l,TaV,TaI,Ta2,Hz,r / RSPlx,l,TaV,TaI,Ta2,Hz )
where
FL x,l,Hz is the radiance image
of an external flat field scene, run through the whole calibration pipeline and
then normalized so the scene pixels in each row average to 1. See section 3.3 and section Error! Reference source not
found.. As of 1/28/2009, EPx,l is zero, so it is a straight flat field
with no allowance for pixel-dependent nonlinearity.
Mx,l,Hz( ) replaces non-scene
pixels with the value 65535. For IR, it also applies the ex post facto bad
pixel correction.
RDx,l,r is the observed
spectral radiance in W/(m2 micrometer sr) at the instrument aperture
for scene or EPF measurements.
IFx,l is I/F, a measure of the observed
diffuse reflectivity of the Martian surface as a function of wavelength. The
normalization is such that the I/F of a normally illuminated perfect white
Lambertian surface is 1. See section 2.18.
Before
any calibration steps are taken, the lossless fast compression is undone, yielding raw DN.
The
first term in the calibration equation, DNx,l,Hz,,t, is raw DN
for some column x and row l, taken at some frame
rate Hz with exposure time t. Raw DN levels are in EDRs named according to the
convention cccnnnnnnnn_xx_aaaaas_EDRv.IMG where ccc=class of observation
(targeted, multispectral windows, etc.), nnnnnnnn=observation ID in hex, xx=counter of
EDRs within that observation, aaaaa=activity type, s=sensor ID, and v=version
number.
Some
raw DN values may be 65535. These are unphysical values used as flags for data
dropout pixels. For later steps in the calibration algorithm, the value 65535
will be used to flag saturated and non-scene pixels. Whenever the value of
65535 is encountered, the calibration algorithm assumes it is a flag, not a
true DN, and simply passes the value through rather than applying the
calibration calculation to that pixel. The ex post facto bad pixel correction
(Section Error! Reference
source not found.) is an exception and replaces 65535 with values calculated from
neighboring pixels.
Ø
Although
raw DN has the lossless fast compression undone, it is still always
written to an EDR compressed from a
14-bit state. This compression is performed in the DPU before lossless fast
compression. Raw DN is restored to 14 bits using a pixel processing table
which has one line per detector row, with 3 elements per line. This step
occurs after the EDRs are generated, as part of the conversion of the EDRs to
radiance units.
The
conversion needs to know:
Ø
Which
one of 8 look-up tables was used to convert 12 to 8 bits on that line, if the
data are 8 bits
Ø
An
inverted version of the lookup table used for each line, to convert back to 12
bits
Ø
A
gain, by which the 12-bit DN should be divided
Ø
An
offset, which should be added to the gain-corrected DN
For
8-bit raw DN (lossy compression on), there are two
steps to the conversion, converting raw DN to 12-bit DN12, and converting
12-bit DN12 to 14-bit DN14. For 12-bit raw DN (lossy compression off), the
first step is skipped.
The
formula for generating 12-bit DN12 is
DN12x,l,TaV,TaW,TaI,TaJ,Ta2,Hz,t,r = ILUTl ( DNx,l,TaV,TaW,TaI,TaJ,Ta2,Hz,t,r )
for
8-bit raw DN, and
DN12x,l,TaV,TaW,TaI,TaJ,Ta2,Hz,t,r = DNx,l,TaV,TaW,TaI,TaJ,Ta2,Hz,t,r
for
12-bit raw DN. ILUTl is the inverse of the
original look-up table used by the flight DPU to perform the lossy compression. In addition to
the above formulas, the values of 65535 in the data drop-out pixels are simply
passed forward as always.
The
formula for converting 12-bit DN12 to 14-bit DN14 is
DN14x,l,TaV,TaW,TaI,TaJ,Ta2,Hz,t,r = Offsetl + DN12x,l,TaV,TaW,TaI,TaJ,Ta2,Hz,t,r
/
Gainl
The
offset, gain, and lookup tables are all given row-by-row, and tables are valid
over specified time ranges.
Which
LUTs were used for each row is maintained as the last column in the level 6
pixel processing CDR, named CDR6_#_##########_PP_n_v.TAB,
where #=spacecraft time SCLK partition at the beginning time of validity of the
CDR, ##########=spacecraft time SCLK at the beginning time of validity of the
CDR, n=sensor ID and v=version number. The LUTs themselves are maintained as
CDR6_1_0000000000_LK_n_v.TAB, and the conversion back to 14 bits uses the
inverse lookup table, maintained as CDR6_1_0000000000_LI_n_v.TAB. The gains are
maintained as the second column of the level 6 pixel processing CDR, and the
offsets are maintained as the third column of the level 6 pixel processing CDR.
Next the bias is removed from the data. The bias subtraction formula
for the IR is
DN14ax,l,TaI,Ta2,Hz,t,r = DN14x,l,TaJ,Ta2,Hz,t,r + a0I · Hv(rowl+1-(502/480)
· (480-integ(t)))
– Biasx,l,TbI,TbJ,Hz - bI,Hz · ( TaI - TbI
) - bJ,Hz · ( TaJ - TbJ
)
The superscript “a” indicates the first step in the
calibration algorithm has been applied, and we continue through the alphabet
for subsequent steps of the calibration algorithm. As discussed earlier, any
values of 65535 are treated as flags and simply passed through in this step
with no further calibration performed on them.
Bias
is different and more complicated for the IR detector as compared to the VNIR
detector. Bias is the DN level extrapolated to zero exposure time, in image
form, taken at a particular frame rate. This represents an electronics bias
added to the measured signal, to prevent near-zero DNs from going negative (and
being clipped) due to superimposed noise. In detector-level testing it was
found that bias has a nearly fixed pattern pixel to pixel, but that its
magnitude varies weakly with temperature and strongly with frame rate.
In
flight, bias for the IR detector is derived from a dedicated calibration,
performed periodically, in which, at each frame rate, a burst of 10 images is
taken with the shutter closed at each of several short exposure times. These
data are taken at IR detector temperature TbI. After making a
correction for a step in the bias that is a function of integration time
parameter, the DN values are fit linearly on a pixel-by-pixel basis and the
exposure time=0 y-intercept image is used as the bias estimate. This process
is described in section 3.1.
The
IR bias images Biasx,l,TbI,TbJ,Hz are corrected for the step function -a0I · Hv(rowl+1-(502/480) · (480-integ(t))). This term results from details of the readout of the
image in the electronics. It is entirely predetermined, and contains the
entire dependence of the bias on the integration time. The constant a0 is
determined from ground calibration data, Hv() is the Heaviside function, rowl is the detector row number (counting from zero), and integ(t)
is the integration time parameter. The value of t in ms is calculated from the
integration time parameter integ using the formula t = 1000 · ( 502 – floor((502/480)
· (480-integ)))/(502 · rate) ), where
floor() is the function that creates an integer from a real number by rounding
down.
Since the bias images Biasx,l,TbI,TbJ,Hz do not include the step function, it is subtracted explicitly in
the equation above.
The
IR bias images Biasx,l,TbI,TbJ,Hz are stored as level 4 calibration data records (CDRs) named CDR4#tttttttttt_BIrbeeewsL_v.IMG,
where #=spacecraft SCLK partition for the mean time at which that bias data was
taken, tttttttttt=mean spacecraft time SCLK for that bias data, r=frame rate,
b=binning,
eee=exposure time parameter, w=wavelength filter, s=0, L=detector (IR), and v=version
number. The calibration software uses the partition # and the mean SCLK
tttttttttt to calculate encoded SCLK for the bias measurement. It uses the
SCLK given in the .TAB list file that goes with each frame of the EDR along with a
partition # from the .LBL file that goes with that EDR to calculate encoded
SCLK for that EDR. It then uses the CDR4 file with the value of encoded SCLK
that is closest to the value of encoded SCLK for the scene measurement. The
keyword “MRO:EXPOSURE_PARAMETER” in the .LBL file is the integration time
parameter.
The
bias calibration may be taken at an IR detector temperature TbI
different from that of the data being corrected, TaI. The term bI,Hz·(TaI-TbI) represents the scalar
difference between two modeled values of averaged, temperature-dependent bias.
This scalar value is intended to correct the bias image for small temperature
differences between the time of its acquisition and the time of the data being
corrected. The coefficients bI,Hz are given in a level 6
CDR named CDR6_#_0000000000_DB_L_v.TAB. Separate coefficients are defined for
the 4 detector quadrants, but as of this writing (11/4/2005) the values are the
same for all the quadrants so there is no subscript to represent the quadrant
dependence.
The
bias calibration may be taken at an IR focal plane electronics board
temperature TbJ different from that of the data being corrected, TaJ.
The term bJ,Hz·(TaJ-TbJ) represents the scalar difference
between two modeled values of averaged, temperature-dependent bias. This scalar
value is intended to correct the bias image for small temperature differences
between the time of its acquisition and the time of the data being corrected.
The coefficients bJ,Hz are given in a level 6
CDR named CDR6_#_0000000000_EB_L_v.TAB. Separate coefficients are defined for
the 4 detector quadrants, but as of this writing (11/4/2005) the values are the
same for all the quadrants so there is no subscript to represent the quadrant
dependence.
For
the VNIR images, the dark current and thermal photons are nil, so the bias is
directly measured when the shutter is closed (the dark measurements taken
before and after a scene or calibration image). For the IR, a separate bias
subtraction is necessary because there is background due to dark current and
thermal photons, and it is necessary to separate that background from the bias
in order to make an accurate linearity correction.
The
bias subtraction formula for VNIR is
DN14ax,l,TaV,Hz,t,r = DN14x,l,Hz,TaV,TaW,t,r
– ( aea·Biasx,l,TdV,TdW,Hz,t + aad·Biasx,l,TeV,TeW,Hz,t ) / (aad + aea)
-
bV,Hz · [ aea · ( TaV - TdV ) + aad · ( TeV -
TaV
) ] / (aad + aea)
-
bW,Hz · [ aea · ( TaW - TdW ) + aad · ( TeW -
TaW
) ] / (aad + aea)
The a coefficients in the VNIR equation are time-weighting coefficients. The two
VNIR bias images are linearly interpolated in time to the time of the scene
image. The variable t represents integration time, not clock time, so a new
variable, ta1 indicates clock time. The value of ta1 is
the mean value of encoded SCLK for that image specifically. It is derived from
the instrument timetag value in the header of each image, calculated by the
CRISM instrument clock, frequently updated by the spacecraft clock, and
corrected using the partition number to be encoded SCLK instead of just SCLK.
Calculations on a local computer may not have the SPICE information available to convert
SCLK to encoded SCLK. One may use SCLK for this calculation as long as the
partition number does not change. Just like for the temperatures, ta1
indicates timetag for the scene image, td1 and te1 the
dark images, tb1 the bias images, and tc1 the calibration
images.
aad = ta1- td1
and aea = te1 - ta1
The
VNIR bias images Biasx,l,TdV,TdW,Hz,t and Biasx,l,TeV,TeW,Hz,t are calculated from the VNIR bias EDRs by taking the mean DN
value in each detector element across all the images in an EDR, with the two
largest and two smallest DN values thrown out. The results are stored as level
4 calibration data records (CDRs) named CDR4#tttttttttt_BIrbeeewsS_v.IMG,
where #=spacecraft SCLK partition for the beginning of time of validity of the
data product, tttttttttt= spacecraft time SCLK for the beginning of time of
validity of the data product, r=frame rate, b=binning, eee=exposure time
parameter, w=wavelength filter, s=0, S=detector (VNIR), and v=version number. The calibration
software uses the partition # and the mean SCLK to calculate encoded SCLK for
the bias measurement. It uses the SCLK given in the .TAB list file that goes
with each frame of the EDR along with a partition
# given in the .LBL file that goes with that EDR to calculate encoded SCLK for
that EDR. It then uses the CDR4 file with the value of encoded SCLK that is
closest to the value of encoded SCLK for the scene measurement. A description
of the calculation of Biasx,l,TdV,TdW,Hz,t and Biasx,l,TeV,TeW,Hz,t is given in section 3.2.
The
VNIR coefficients bV,Hz are given in CDR6_#_0000000000_DB_n_v.TAB,
and the VNIR coefficients bW,Hz are given in
CDR6_#_0000000000_EB_n_v.TAB. The VNIR temperature correction is with respect
to the temperatures TdV, TeV of the VNIR detector and TdW,
TeW of the VNIR focal plane electronics board during the before and
after darks respectively.
The
above description of the bias correction applies to the scene images, which
have temperatures TaI, TaJ and TaV, TaW.
The bias correction is also applied to dark images for the IR, and the formula
is the same except TaI, TaJ are replaced by TdI,
TdJ. It is also applied to the calibration images for both IR and
VNIR, and likewise TaI, TaJ are replaced by TcI,
TcJ and TaV, TaW by TcV, TcW.
Next,
electronics ghosts are removed from the data. There are two types of ghosts,
each at the percent level, that add to the measured DN but do not represent
real signal.
The
first type of electronics ghost is a weak, negative image of any one of the
four 160-column wide quadrants in each other quadrant.
|
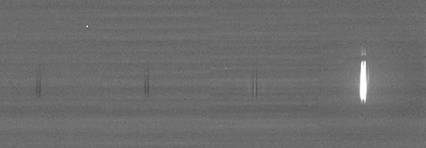
|
Weak electronics ghost negative images of the quadrant 4 signal
in each other quadrant.
|
Each
quadrant produces the same ghost image in all 4 quadrants. We include the
self-ghosting because it makes the subsequent nonlinearity correction smaller.
For VNIR, the ghost is a nonlinear function of the signal. For IR, the ghost
is a linear function of the signal, but with an nonzero intercept when
extrapolated to zero signal indicating that the ghost would be nonlinear at
small signal levels if we had data there. For VNIR or IR, the ghost has the
same function G(DN) for all 4 quadrants whether one changes the quadrant in
which the source is located or the quadrant in which the ghost appears.
To
remove the detector quadrant ghost, we subtract the ghost calculated from the
signal in each of the 4 quadrants from each pixel. The quadrant the pixel
itself is in is included, so the self-ghosting is subtracted.
DN14bx,l,TaV,Hz,t,r = DN14ax,l,TaV,Hz,t,r – Sn=0n=3 GV( DN14ax0+n·d,l,TaV,Hz,t,r )
for
VNIR and
DN14bx,l,TaI,Ta2,Hz,t,r = DN14ax,l,TaI,Ta2,Hz,t,r – Sn=0n=3 GI( DN14ax0+n·d,l,TaI,Ta2,Hz,t,r )
for
IR, where d = the width of a
quadrant (160 for full resolution images), and x0 = x modulo d, the position in the first quadrant corresponding to the position
of x in the current quadrant. G() is the ghost function, which is different
for VNIR and IR but does not depend on frame rate or any other parameter. The coefficients in the
ghost function G() are given in a level 6 CDR named:
CDR6_#_0000000000_GH_n_v.TAB.
The
above functions define the ghost removal function H(), so that
DN14bx,l,TaV,Hz,t,r = H( DN14ax,l,TaV,Hz,t,r ) for VNIR
and
DN14bx,l,TaI,Ta2,Hz,t,r = H( DN14ax,l,TaI,Ta2,Hz,t,r ) for IR.
Treatment
of pixels flagged with 65535 in ghost removal correction:
These
pixels are passed on to the next step in the calibration algorithm with no
processing. For the right hand side of the equation above, DN14ax0+n·d,l,TaI,Ta2,Hz,t,r is set equal to zero,
so these pixels have zero contribution.
After
the temperature corrections were implemented, it was determined that there was
a frame-to-frame noise in the bias that generated horizontal lines in the VNIR
image. This noise could not be modeled. The only way to eliminate it was to
subtract the median of a set of detector pixels covered by a physical mask and
therefore completely unilluminated, even by scattered light. The median is
taken over a set of columns x1…xn along the edge of the
detector, and over all detector wavelengths l1…ls.
VNIR:
DN14bbx,l,TaV,Hz,t,r = DN14bx,l,TaV,Hz,t,r - medianx,l ( DN14bx1...xn,l0...ls,TaV,TaW,Hz,t,r )
The columns used for dark column subtraction for a given pixel binning b
and wavelength table w are specified in the DM level 4 CDR
CDR410000000000_DM0b000w0S_v.IMG.
The dark column subtract makes some of the corrections in
Section 2.3 redundant. The corrections for dependence of the bias on
temperature of the detector and temperature of the focal plane electronics
apply equally to every pixel in the detector, so they are canceled out in the
masked pixel correction step.
The a
priori bad pixel mask uses the bias, sphere, and background flight calibration
images to calculate pixels that are potentially saturated in the scene or
sphere image, dead, or excessively noisy in the scene or sphere image. These
pixels are replaced by linear spatial interpolation from neighboring good
pixels at the same wavelength.
The a
priori bad pixel mask for each scene image is calculated entirely from
calibration images and scene brightness models. In addition, at the end of the
calibration an ex post facto bad pixel mask is calculated from the calibrated
scene radiance image and applied to it. See section 2.15.
- Noisy
pixels. For each detector element (“pixel” for the current discussion,
but this is a column and wavelength bin on the detector, *not* a spatial
pixel on Mars which has multiple wavelengths), we take the standard
deviation of the DN value in multiple nominally identical images, with the
largest two and smallest two DN values thrown out. If that standard
deviation is greater than 15 DN, the pixel is “bad”. This is calculated
for each pixel within each EDR for all bias EDRs (multiple integration times
for IR) including the sphere bias EDRs, and for all IR background EDRs,
including those for the sphere EDRs. If a pixel is bad in even one of
these EDRs, it is included in the bad pixel mask. Note the “bad pixel
bias” EDRs are *not* used to calculate noisy pixels.
- Dead
pixels. Bias and background subtract are applied to sphere calibration
images, and any pixel that is <5% (this criterion is given in the VL
CDR CDR6_1_0000000000_VL_n_0.TAB) of the median of its
wavelength band is deemed “dead” and added to the bad pixel mask.
- Potentially
saturated pixels. The AS CDR CDR6_1_0000000000_AS_n_0.TAB contains a model of the
maximum DN level expected from any scene image, and the same for any
sphere calibration image. This was derived from models of the scene
radiance, sphere radiance, and instrument responsivity, allowing for the
integration times used in the different types of images. For sphere and
scene, bias and dark current (for VNIR, dark current is assumed to be
zero) calculated from the “bad pixel bias” EDRs is added to the AS CDR
value. If the result exceeds 93% of the saturation value of the detector
(the 93% criterion and the saturation values are given in the VL CDR),
then that pixel is declared bad and added to the bad pixel mask. In
practice, almost all of the saturated pixels in the image are identified
as potentially saturated pixels and replaced.
Binning:
Noisy
pixels are usually calculated from images with the same spatial binning as the
scene. In cases where the noisy pixels are calculated from higher spatial
resolution images (sphere biases, for example), the binned pixel is bad if any
of the individual pixels are bad (“OR binning”). When dead pixels are binned,
the binned pixel is bad only if all the individual pixels are bad (“AND
binning”). Potentially saturated pixels are always calculated at the full
spatial resolution of 640 columns. They are always OR binned. This is why a
special “bad pixel bias” EDR or set of EDRs is defined, to ensure the
potentially saturated pixels are always calculated at full resolution. The
binning done in the CRISM electronics is at the digital level, and the binned
pixel will have an inaccurate DN value if any of the sub-pixels are saturated.
A detail: The “binning” done in the CRISM electronics is averaging, not
summing.
The
bad pixel masks are stored as images for each frame rate in the files named
CDR4#tttttttttt_BPrbeeewsn_v.IMG.
The file CDR6_#_0000000000_PD_n_v.TAB contains a list of the bad pixel mask
image CDR4 filenames. The bad pixel mask CDR for a scene image contains bad
pixels for the ex post facto bad pixel correction as well as the a priori bad
pixel correction.
In
addition to the BP CDR written for the scene image, BP CDRs are also written
for the bias, sphere, and background images that are written to the BI, SP, and
BK CDRs respectively. They can be distinguished by the spacecraft clock value
tttttttttt in the filename. The value put in the BP CDR filename is the
spacecraft clock value at the time the bias, sphere, or background EDR was
taken. For the IR bias, there are several EDRs, and we use the midpoint of the
EDRs for the spacecraft clock value. The bias BP CDRs flag only the noisy
pixels for the given bias EDRs. The sphere BP CDRs flag the noisy, dead, and
potentially saturated (for that sphere image, not for the scene) pixels for a
given SP CDR. The BP CDRs written for the IR background images include all the
a priori bad pixels for the scene image, except if there are noisy pixels in
one background image that are not in the other, they will be in only one of the
background BK CDRs. The set of pixels that are bad pixels in one or the other
of the two BP CDRs for the background images that go with a scene gives the
full set of a priori bad pixels applied to that scene. Note this includes
scene bias and scene background noisy pixels, dead pixels, and potentially
saturated scene pixels. It does not include noisy and potentially saturated
sphere pixels, which have been corrected in the sphere image, and the corrected
values have been used to calibrate the scene image. If one wants to look at
just the a priori bad pixel mask for the IR, one must use the background BP
CDRs. The BP CDR for the scene itself also contains many bad pixels from the
IR ex post facto bad pixel correction, described in section 2.15.
The
a priori bad pixel mask is applied to an image by replacing each bad pixel with
the average of the two pixels in adjacent columns (spatial pixels) in the same
row (wavelength pixel). If two or more pixels in the same row and adjacent
columns are bad, they are replaced using a linear interpolation of the two
nearest good pixels in that row. The bad pixel mask is applied after bias
subtraction and detector ghost removal. Pixels with value 65535 are not
replaced.
Special
cases:
- When
the bad pixel is the first or last column of the scene mask, so that the
nearest neighbor on one side is not a scene pixel, the bad pixel will be
replaced by the neighboring pixel in the adjacent column that is part of
the scene, and the neighboring pixel not part of the scene will not be
used. If two or more pixels in the same row and adjacent columns are bad,
including the first or last column, they will be replaced by the nearest
good pixel in that row.
- When
the bad pixel is in the stray light mask, it will not be used. If all of
the stray light pixels in a given row are bad, then they are replaced by a
linear interpolation of the two pixels in adjacent rows in the same
column. If two or more stray light pixels in adjacent rows are bad, they
will be replaced using a linear interpolation of the two nearest good
pixels in that column. See section 2.10.
In
the above rules, a “good” pixel is one not in the bad pixel mask and also with
a value not equal to 65535.
The
stray light mask defines columns close enough to the edge of the detector to be
outside the image of the spectrometer entrance slit but far enough away from
the edges of the detector to be unmasked. They sample any stray light that is
uniform in character. The stray light pixels are defined as columns x1…xn
and the values are as follows: 8-27, 4-13, 2-4, and 1 for the IR detector with
1x, 2x, 5x, and 10x binning respectively. For VNIR, there are stray light columns on both
sides of the detector: 12-23 and 627-639 for 1x binning, 6-11 and 314-319 for
2x binning, 3 and 126-127 for 5x binning, and 1 and 63 for 10x binning. The
values are given in a level 4 calibration data record (CDR) named CDR410000000000_DM0b000w0n_v.IMG,
where b=binning, w=wavelength filter, n=detector, and v=version number.
Applying
the calculations described in the calculation above is defined as B(), the bad
pixel removal function, so we have
DN14cx,l,TaV,TaI,Ta2,Hz,t,r = Bx,l,Hz( DN14bbx,l,TaV,TaI,Ta2,Hz,t,r )
The
bad pixel mask is not applied to bias images written to the BI CDRs, because it
is calculated from the bias images and applied after the bias subtraction.
However, the sphere bad pixel mask, including noisy, dead, and saturated
pixels, is applied to the sphere calibration images before the SP CDR is
written. Likewise, the IR background bad pixel mask, including almost all the
scene bad pixels, is applied to the background image before the BK CDR is
written.
Each
RDR generated from an EDR will have ancillary
information that includes the name of the bad pixel mask CDR4 file used as part of the
generation of that RDR, so users who wish to reject the bad pixels entirely
have the information to do so. All of the bad pixels are flagged by this
method. However, the calibration algorithm will replace the bad pixels with interpolated
values, not reject them.
Saturated
pixels do not represent accurate data values, so we intended to flag them by
replacing them with the value 65535. The saturated pixels are processed up to
the level of the detector electronics ghost, because it is more accurate to
apply the saturated value to the ghost correction than to apply zero. In
practice, almost all the saturated pixels are identified in the last section as
potentially saturated pixels and interpolated across, and those are not
identified as saturated in this step and replaced by a value of 65535.
The
saturated pixel removal function replaces DN14cx,l,TaV,Hz,t,r with the value 65535
if DN14cx,l,TaV,Hz,t,r > DN14cmaxV,x,Hz for VNIR, and replaces DN14cx,l,TaI,Ta2,Hz,t,r with the value 65535 if DN14cx,l,TaI,Ta2,Hz,t,r > DN14cmaxI,x,Hz for
IR. The values DN14cmaxV,x,Hz and DN14cmaxI,x,Hz are given in the level 6 CDR named CDR6_1_0000000000_VL_n_v.TAB, where
n=detector and v=version number. There are different values for different
detector quadrants and frame rates, but the values are close for a given
detector.
The
function S() is defined as the function that flags the saturated pixels as
described above.
DN14dx,l,TaI,Ta2,Hz,t,r = S( DN14cx,l,TaV,TaI,Ta2,Hz,t,r )
Any
pixels flagged with 65535 are not processed by any subsequent step in the
calibration algorithm, but just passed on to the next step unchanged. An
exception is that the ex post facto bad pixel correction does replace them, and
in practice nearly all the 65535 values do get replaced.
We use an empirical model of the detector nonlinearity to correct 14-bit DNs to a signal
related linearly to the sum of contributions from dark current, thermal
background, scattered light, and scene imaged through the slit. This is a
correction for nonlinearity in the responsivity of the instrument. The source
of this nonlinearity is in the detector electronics, as part of the conversion
of electrons to DN. We correct for the fact that conversion efficiency of
electrons to DN increases with DN. The value of DN is converted back to what
it would be in an idealized case with a constant number of electrons per DN.
In detector level testing it was found that, on average, conversion efficiency
varies nearly linearly with the logarithm of bias-corrected DN, and that the
relationship differs slightly between frame rates. This gives the following
model.
Eff
= DN / ( Rate · t ) = e · log(DN) + f
where
Eff is the detector conversion efficiency (DN/electrons) and Rate is the total
rate of production of electrons, including source photons, background photons,
and detector dark current but not including detector bias. The function log()
is the natural or base-e logarithm.
We calculate e and f from DNcrs,
from images taken during spacecraft cruise before arrival at Mars. We used the
spectrometer focal plane lamps as sources. We used different exposure times
(t), and different lamp currents to give different electron production rates
(Rate). The exposure times were known to high accuracy, and by comparing image
DN for different exposure times and lamp currents, we were able to determine
the relative value of (Rate) for each lamp current. Then, we used a linear fit
to y=e·x+f with y=DNcrs/(Rate·t) and x=log(DNcrs) to
give the nonlinearity parameters e and f.
The
parameters e and f are calculated as averages over the whole detector and applied to
the DN level on a pixel by pixel basis. Typically, we use benchtop detector
data and DNgnd is an average over a region with constant filter
performance and constant illumination to sample constant DN. We can also use
DNgnd from data taken with the detector in the instrument, in which
case it is generally an average over a row or a few rows to sample fairly
constant DN. We assume that variations in the nonlinearity parameters from
pixel to pixel within a row are small enough to be addressed in the flat field
correction, as long as the flat field DN is roughly similar to the scene DN.
Note
the calibration pipeline software does have the ability to assign different
values of e and f for each pixel. For f, this is equivalent to the standard flat field, which scales the
image for each pixel. For e, the flat field FF CDR
has a second layer that includes values of e that may be chosen independently for each pixel. As of
1/28/2009, the second layer of the FF CDR is all zeroes, and the only
nonlinearity correction uses the same e over the whole image. The flat field correction is described in
more detail in Section 2.14.
|
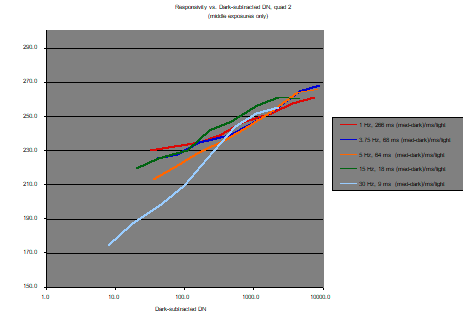
|
Nonlinear relationship of responsivity to radiance level for
VNIR, measured during detector-level testing.
|
Then,
we use the values of e and f from the fit to convert our flight DN back to an idealized DN
which would result from a linear response. That linearized DN is proportional
to (Rad·t), so we solve for (Rad·t) in the model and our correction equation
becomes
DN14gx,l,TaI,Ta2,TaV,Hz,t,r = FHz(
DN14ex,l,TaI,Ta2,TaV,Hz,t,r )
FHz( DN14ex,l,TaI,Ta2,TaV,Hz,t,r ) = DN14ex,l,TaI,Ta2,TaV,Hz,t,r / ( eHz · log(DN14ex,l,TaI,Ta2,TaV,Hz,t,r) + fHz )
where
DN14fx,l,TaI,Ta2,TaV,Hz,t,r is the linearized DN for our actual flight data. The function
log() is the natural or base-e logarithm. As shown, e and f are a function of
frame rate. They are proportional to (Rate·t) but there’s an arbitrary scaling
factor. We scale them so that F(1000)=1. The coefficients e and f are given in a level 6
CDR named CDR6_#_0000000000_LC_n_v.TAB where n=sensor ID and v=version number.
RT14gx,l,TaI,Ta2,TaV,Hz,r = DN14gx,l,TaI,Ta2,TaV,Hz,t,r / t
The
nomenclature RT denotes rate instead of DN for data number, and the integration
time is omitted to indicate that the images are nominally independent of
integration time, but the rest of the subscripts are kept the same. We use t
in milliseconds, so the units of RT are counts/ms.
The
IR detector has dark current and is sensitive to IR background from the walls
of the spectrometer. Now that the DN are bias-subtracted and linearized, this
background must be subtracted before the scene images may be calibrated. The
VNIR detector has no sensitivity to IR glow from the walls of the spectrometer,
and at the –60° C operating temperature there is no significant dark current,
so no background subtraction is necessary for the VNIR channel.
The
background is most strongly influenced by changes in the temperature of the IR
detector. A spectrometer housing temperature only 0.02° C different from the
data being corrected, at relatively warm housing temperatures near -78° C, may
result in a background at the longest IR wavelengths that is different by the
noise-equivalent radiance. Originally, we had planned to interpolate the dark
measurements using the measured spectrometer housing temperatures, but we do
not expect the temperature sensors to be accurate enough. Therefore, the dark
measurements are interpolated based on the time each was taken and the time of
the image being background corrected. The value of ta1 is the mean
value of encoded SCLK for that image specifically. It is derived from the
instrument timetag value in the header of each image, calculated by the CRISM
instrument clock, frequently updated by the spacecraft clock, and corrected
using the partition number to be encoded SCLK instead of just SCLK.
Calculations on a local computer may not have the SPICE information available to convert
SCLK to encoded SCLK. One may use SCLK for this calculation as long as the
partition number does not change. Just like for the temperatures, ta1
indicates timetag for the scene image, td1 and te1 the
dark images, tb1 the bias images, and tc1 the calibration
images.
The
equation for background subtraction is
RT14hx,l,TaI,Ta2,Hz,r = RT14gx,l,TaI,Ta2,Hz,ta1,r – Bkgdx,l,TdI,TeI,Td2,Te2,Hz,ta1,td1,te1
with
Bkgdx,l,TdI,TeI,Td2,Te2,Hz,ta1,td1,te1 = [ 1 / ( te1
– td1 ) ] ·
[ RTD14gx,l,TdI,Td2,Hz,td1 · ( te1
– ta1 ) + RTD14gx,l,TeI,Te2,Hz,te1 · ( ta1
– td1 ) ]
and RTD14gx,l,TdI,Td2,Hz,td1 = DND14gx,l,TdI,Td2,Hz,td / td
for
IR. The term Bkgdx,l,TdI,TeI,Td2,Te2,Hz,ta1,td1,te1 is simply an average
of the dark measurements taken before and after the given scene measurement,
weighted by the inverse of the time difference between each dark measurement
and the given scene measurement.
The
term RTD14gx,l,TdI,Td2,Hz,td1 is simply the14-bit DN/second for the dark measurement taken
before the measurement being background-subtracted, the superscript g
indicating that it has gone through the same set of corrections as the
measurement being background-subtracted. The variable td is the
integration time for that particular dark measurement.
The
images DND14gx,l,TdI,Td2,Hz,td are stored as level 4 calibration data records (CDRs) named CDR4#tttttttttt_BKrbeeewsL_v.IMG,
where #=spacecraft time SCLK partition at the beginning of validity of the CDR,
tttttttttt=spacecraft time SCLK at the beginning of validity of the CDR,
r=frame rate, b=binning, eee=exposure time parameter, w=wavelength filter, s=0, L=detector
(IR), and v=version number. The integration time td, used to calculate RTD14gx,l,TdI,Td2,Hz,td from DND14gx,l,TdI,Td2,Hz,td, may be calculated
from the integration time parameter in the label file
CDR4#tttttttttt_BKrbeeewsL_v.LBL that goes with the .IMG file containing the DND14gx,l,TdI,Td2,Hz,td images.
For
VNIR, there’s no background correction, so it’s just
RT14hx,l,TaV,Hz,r = RT14gx,l,TaV,Hz,r
Masked
pixel (dark column) subtract for IR:
After
the temperature corrections were implemented, it was determined that there was
a frame-to-frame noise in the bias that generated horizontal lines in the IR
image. This noise could not be modeled. The only way to eliminate it was to
subtract the median of a set of detector pixels covered by a physical mask and
therefore completely unilluminated, even by scattered light. The median is
taken over a set of columns x1…xn along the edge of the
detector, and over all detector wavelengths l1…ls.
RT14ix,l,TaI,Ta2,Hz,t,r = RT14hx,l,TaI,Ta2,Hz,r - medianx,l ( RT14hx1...xn,l0...ls,TaI,Ta2,Hz,t,r
)
The columns used for dark column subtraction for a given pixel binning b
and wavelength table w are specified in the DM level 4 CDR
CDR410000000000_DM0b000w0L_v.IMG.
The dark column subtract makes some of the corrections in
Section 2.3 redundant. The corrections for dependence of the bias on
temperature of the detector and temperature of the focal plane electronics
apply equally to every pixel in the detector, so they are canceled out in the
masked pixel correction step.
Scattered
light correction for VNIR:
CRISM
has two known significant sources of optical stray light that must be removed
during the correction of spectrally dispersed light, that is, an integrating
sphere measurement
to a responsivity correction or a Mars scene to radiance:
- Scatter
from optical elements in the spectrometer scatters light and the spatial
direction x and the wavelength direction l. This
is measured directly by the unmasked pixels to the side of the slit image.
The contribution to scattered light resembles glare and is not in focus.
This scattered light is stronger at shorter wavelengths, and an explicit
correction is made only for VNIR. For IR, a small correction is included
implicitly in the radiance calibration SS CDR.
- Second
order light (source wavelength l/2) leaks through zone 3 of the order
sorting filter at l=2760-3960 nm, and an apparent
optical ghost with source wavelength near l/1.8
occurs in a narrow range of l near 2400 nm. The optical
ghost is small, and it has not been detected in flight data, only in
laboratory data. It is not corrected. The second order light occurs only
in the IR, and an explicit correction is made.
The
scattered light pixels are columns close enough to the edge of the detector to
be outside the image of the spectrometer entrance slit but far enough away from
the edges of the detector to be unmasked. They sample any stray light that is
uniform in character. The stray light pixels are defined as columns x1…xn
and the values are as follows: 8-27, 4-13, 2-4, and 1 for the IR detector with
1x, 2x, 5x, and 10x binning respectively. Note the IR stray light pixels are not used in the
calibration algorithm. For VNIR, there were originally stray light columns on
both sides of the detector, but only one side is used: 630-639 for 1x binning,
315-319 for 2x binning, 126-127 for 5x binning, and 63 for 10x binning. The
VNIR stray light pixels are used in the calibration algorithm. These values
are given in a level 4 calibration data record (CDR) named CDR4#0000000000_DMrbeeewsn_v.IMG,
where #=spacecraft time SCLK partition at the beginning of validity of the CDR,
tttttttttt=spacecraft time, r=frame rate, b=binning, eee=exposure time
parameter, w=wavelength filter s=0, n=detector, and v=version number.
The
scattered light is corrected for a VNIR pixel by estimating the scattered light
from the other pixels in the same frame (note a frame is column x wavelength
for a single line of the Mars image) and subtracting that estimated scattered
light.
There
are several possible straightforward methods to estimate the VNIR scattered
light:
1. Simply take an average
value in the stray light pixels for each wavelength band in a frame and
subtract it from the pixel in every column for that wavelength band in that
frame. This technique would be accurate in theory if the scattered light were
perfectly uniform with radiance independent of angle, like a Lambertian
surface. In this case the stray light pixels would accurately monitor the same
amount of scattered light as the pixels in the image at each wavelength.
However, in practice this method is inaccurate because scattered light is
peaked with scattering angle. The function varies but usually is close to an
inverse power of the scattering angle, often the inverse square of the
scattering angle. This causes two problems with just subtracting the stray
light pixel.
a. The scene is not
uniform with column number, and pixels with other bright pixels nearby have
more scattered light than pixels with only dim pixels nearby. One scattered
light value for a wavelength bin can’t cover all the columns.
b. The scattered light
pixels are on the edge of the detector and so they only get scattered light
from one side, while scene pixels near the center of the detector get scattered
light from both sides. In practice, for a uniformly bright scene, all scene pixels
except those very close to the edge of the detector have scattered light of
more than twice that recorded by the stray light pixels. Whether it’s 2x,
2.5x, or 3x depends on how many stray light pixels are included in the
average. The stray light pixels further away from the illuminated scene and
closer to the edge of the detector have lower signal and a larger factor must
be used if they are included.
2. The VNIR bands go down
to very short wavelength, where the already dim direct signal is further
reduced by a cut-on order sorting filter, leaving only the scattered light
coming from longer wavelengths. The nominal wavelength of VNIR band 0 for
CRISM multispectral mapping images (band 2 for hyperspectral images) is 378
nm. The short-wavelength CRISM VNIR order sorting filter is made of Schott
glass GG375, with nominal cut-on longward of 375 nm. For each CRISM frame, one
can simply take the multispectral band 0 value (or the mean of bands 1-3 for
hyperspectral images) and subtract it from all the pixels in that frame in the
same column. This method samples the variation in stray light with column
number. However, it suffers from the following problems.
a. The stray light varies
with wavelength, because the image brightness varies with wavelength and the
stray light is locally peaked. Therefore, the scattered light sampled by
multispectral band 0 is generally smaller overall than the scattered light in
the rest of the frame.
b. Different parts of the
scene can have considerably different spectra. For example, dust and rocks are
reddish and ice is white. For frames with some columns of ice and some columns
of rock, even the relative values of the scattered light in different columns
of multispectral band 0 don’t accurately measure the relative values of the
scattered light in different columns of the longer wavelengths.
3. Except for the very
edges of the detector, the source of the scattered light in a frame is well
sampled by the frame itself, because the scattered light is locally peaked.
One could simply model the scattered light by convolving each single VNIR CRISM
frame with a scattering function, derived from lab data, representing the
approximately inverse theta squared dependence of the scattered light for large
scattering angle theta. The scattering function would have an approximately
inverse lambda squared dependence on the source wavelength. Because the CRISM
dichroic beamsplitter is an important source of scattered light and it’s
tilted, the scattering function may be anamorphic (have a different scaling in
the spatial direction and wavelength direction). The scattering function would
be smoothed and capped at small values of theta corresponding to just a few
pixels away from the pixel being corrected, because the purpose of the
correction is to correct scattered light, not alter the point spread function of
the instrument. This method is accurate in theory, and does not require the
scattered light pixels. However, we were concerned about the following
possible problems.
a. If the scattering
function is not accurate, artifacts might be generated in the scene images.
For example, if the scattered light is overcorrected at smaller angles and
undercorrected at larger angles, one might see a dark and then bright band next
to a bright/dark boundary in a scene. Note that such an artifact would be
introduced only in the cross-track direction in a Mars image, because the
correction is applied independently to each detector frame, corresponding to a
single line in the Mars image.
b. This method uses all
the pixels in a given frame to calculate one pixel, so it is more
computationally intensive than other calculations in the calibration algorithm.
The
production scattered light subtraction algorithm incorporates elements of
method 3, but we did not try the straightforward and naïve method 3 as
described above. It might be interesting to do a trial with method 3 to see if
the VNIR scattered light subtraction algorithm could be simplified, but the
existing method, although complicated, works very well.
We
started with method 1, simple subtraction of the stray light pixel. Then,
discovering the scattered light was undersubtracted, we scaled it by a factor
of 2. Then, it became clear the subtraction was inaccurate for nonuniform
scenes, and we scaled the value in the stray light pixel for each band with the
signal in multispectral band 0 (bands 1-3 for hyperspectral) relative to the
stray light pixel in multispectral band 0.
This
hybrid version of methods 1 and 2 was not working for scenes that had both rock
and ice and it didn’t account well for spectral smile, so for longer wavelength
bands the scattered light function for each band was further scaled to a
convolution of an empirical scattering function, optimized to minimize
artifacts in nonuniform Mars scenes, with the brightness of the pixels in the
columns of that band (approximating the brightness of the source of scattered
light). This differs from method 3 in that it’s just a one-dimensional
convolution, limited to the pixels in a single band, rather than using the
pixels in the entire frame. Although multispectral band 0 was still explicitly
in the algorithm, for the longer wavelength bands the scaling effectively replaced
it with the convolution of the band being corrected with the one-dimensional
scattering function.
The
resulting method was fairly effective, but in scenes that had ice near the
stray light pixels, the spectrum of the scattered light subtraction was the
spectrum of the ice, which was not appropriate for the rock areas of scenes
with mixed ice and rock. Therefore, the stray light pixels were corrected by
dividing by the mean of scene pixels near the edge where the stray light pixels
were located. This resulted in realistic VNIR spectra of both rock and ice,
even in mixed ice-rock scenes, and the spectra were insensitive to whether
there was rock or ice near the stray light pixel. Obvious artifacts were dramatically
reduced from uncorrected spectra.
The
VNIR scattered light algorithm explicitly uses the following data:
A. The scattered light
pixels in each band
B. Multispectral band 0
(bands 1-3 for hyperspectral)
C. The scene pixels in
each band convolved with a one-dimensional scattering function
D. Scene pixels near the
edge of the detector close to the scattered light pixel in each band
The
exact parameters of the algorithm were determined by much empirical
optimization on CRISM target mode and mapping mode scenes, but there was not
much analysis of the meaning of layering the different corrections on top of
each other. The algorithm as implemented is effectively method 2 scaled with
wavelength by method 1 at the short wavelengths, and it is my feeling (D. Humm,
12/23/2008) that it is effectively method 3 at the long wavelengths, except it
uses a 1-dimensional scattering function instead of the actual 2-dimensional
scattering function. At the long wavelengths, the scattered light pixel
wavelength dependence is effectively canceled out by ratioing it to the average
of nearby scene pixels, and the multispectral band 0 spatial function is effectively
canceled out by scaling it to the convolved scene pixels in the band being
corrected. Although the relative wavelength and spatial dependence of methods
1 and 2 are canceled out, they still contribute an overall scaling factor to
the calculated scattered light.
The
equation for VNIR scattered light correction is different for short and long
wavelengths. Note the brackets < > in the equations below all refer to
taking a simple mean over some range of columns.
For
detector rows 185-215 (roughly, l < 563 nm)
RT14ix,l,TaV,TaI,Ta2,Hz,r = RT14hx,l,TaV,TaI,Ta2,Hz,r – { <RT14hxa…xb,l,TaV,TaI,Ta2,Hz,r> ∙ SWhx,TaV,TaI,Ta2,Hz
}
where
SWhx,TaV,TaI,Ta2,Hz
= RT14hx,l0,TaV,TaI,Ta2,Hz,r / <RT14hxa…xb,l0,TaV,TaI,Ta2,Hz,r>
with
l0 corresponding to
detector row 187 (roughly l = 378 nm) and xa...xb
the stray light columns (from a=630 to b=639 for 1x binning, a=315 to b=319 for
2x binning, a=126 to b=127 for 5x binning, and a=b=63 for 10x binning, given in
the DM CDR), and the brackets { } represent a 15-point downtrack moving mean
for each column and wavelength, with the two highest and two lowest points
discarded. The moving mean with points discarded is used to ensure that the
stray light correction doesn’t inject noise from the stray light pixels into
the image. Note that for hyperspectral images, a mean of the stray light
columns in detector rows 186, 187, and 188 is taken instead of just row 187.
This
is the hybrid of methods 1 and 2, taking the scattered light function from a
short-wavelength row and scaling it to the value of the scattered light pixel
in the row being corrected.
For
detector rows 216-291 (roughly, l > 563 nm)
RT14ix,l,TaV,TaI,Ta2,Hz,r = RT14hx,l,TaV,TaI,Ta2,Hz,r – { <RT14hxa…xb,l,TaV,TaI,Ta2,Hz,r> ∙ CShx,l,TaV,TaI,Ta2,Hz }
where
CShx,l,TaV,TaI,Ta2,Hz = SWhx,TaV,TaI,Ta2,Hz
∙ ( CBhx,l,TaV,TaI,Ta2,Hz,r / CBhx,l0,TaV,TaI,Ta2,Hz,r )
∙ (<RT14hxc…xd,l0,TaV,TaI,Ta2,Hz,r> / <RT14hxc…xd,l,TaV,TaI,Ta2,Hz,r>)
and
CBhx,l,TaV,TaI,Ta2,Hz,r = Sk RT14hxk,l,TaV,TaI,Ta2,Hz,r ∙ Bx
/ ( 1 + ( (x-xk) / 10 )2 )
with
Bx
= 1 / ( Sk 1 / ( 1 + ( (x-xk)
∙ binning / 10 )2 ) )
CBhx,l,TaV,TaI,Ta2,Hz,r is just the
convolution of a single band in a single frame with the function
1
/ ( 1 + (
(x-xk) ∙ binning / 10 )2 ), and Bx is
the normalization factor for that function. The columns xc…xd
are the scene full-resolution columns c=540 to d=619 (columns c=270 to d=309
for 2x binning, c=108 to d=123 for 5x , and c=54 to d=61 for 10x) near the
stray light pixels, and [ (x-xk) ∙ binning ] is the number of
columns from xk to x in full-resolution, unbinned pixel units. The
symbol Sk indicates a sum over
scene columns only, not including the extra stray light and dark columns at the
edge of the detector. Note the normalization factor Bx depends
on x because it depends on how close x is to the edge of the scene. The
brackets { } represent a 15-point downtrack moving mean for each column and
wavelength, with the two highest and two lowest points discarded.
This
is the more complex correction that attempts to mimic method 3 without having
to use all the detector rows of a frame to correct just one row. The factor (
CBhx,l,TaV,TaI,Ta2,Hz,r / CBhx,l0,TaV,TaI,Ta2,Hz,r ) changes the relative value of the scattered light subtraction
from the SWhx,TaV,TaI,Ta2,Hz,r value valid at short
wavelengths to the CBhx,l,TaV,TaI,Ta2,Hz,r value valid at long
wavelengths. The factor (<RT14hxc…xd,l0,TaV,TaI,Ta2,Hz,r> / <RT14hxc…xd,l,TaV,TaI,Ta2,Hz,r>) then divides out
the wavelength dependence of the stray light pixel, using the scene pixels near
the stray light pixel as a proxy for the stray light pixel. The resulting
relative spatial and spectral function for scattered light subtraction at long
wavelengths pretty much all derives from CBhhx,l,TaV,TaI,Ta2,Hz,r, and the <RT14hhxa…xb,l,TaV,TaI,Ta2,Hz,r> ∙ SWhhx,TaV,TaI,Ta2,Hz,r
factor used at short wavelengths only affects the overall scale of the
correction at long wavelengths.
A
special case:
Multispectral
images with spacecraft clock SCLK<850327000 (transition orbit and earlier)
were taken with a different wavelength table, and those images do not have
detector row 187. In that case,
SWhx,TaV,TaI,Ta2,Hz
= SWhx
where
SWhx gives the ratio of response of detector row 187 to
response of the mean of the stray light pixels in detector row 187 for a
uniform scene. SWhx is read from the level 4 calibration
data record (CDR) named CDR410000000000_SCrb000wsS_v.IMG,
where r=frame rate, b=binning, w=wavelength filter s=0, and v=version number. For
detector rows 216-291, the formula for scattered light subtraction is
unchanged. One just substitutes the new value of SWhx,TaV,TaI,Ta2,Hz.
This algorithm isn’t very sensitive to SWhx,TaV,TaI,Ta2,Hz
anyway, except for overall normalization. For detector rows 185-215, the
algorithm changes to one similar to that used at longer wavelengths.
For
multispectral images with SCLK<85032700, detector rows 185-216 (roughly, l < 563 nm), the scattered light subtraction formula is
RT14ix,l,TaV,TaI,Ta2,Hz,r = RT14hx,l,TaV,TaI,Ta2,Hz,r – { <RT14hxa…xb,l,TaV,TaI,Ta2,Hz,r> ∙ CShx,TaV,TaI,Ta2,Hz
}
where
CShx,TaV,TaI,Ta2,Hz
= SWhx,TaV,TaI,Ta2,Hz ∙ ( CBhx,l1,TaV,TaI,Ta2,Hz,r / CBhx,l0,TaV,TaI,Ta2,Hz,r )
∙
(<RT14hxc…xd,l0,TaV,TaI,Ta2,Hz,r> / <RT14hxc…xd,l1,TaV,TaI,Ta2,Hz,r>)
This
is the same as used at longer wavelengths, except CS is no longer a function of
wavelength l, because CB and RT14
are evaluated at wavelength band l1 instead of l. Wavelength band l1 is defined as the shortest wavelength
(smallest detector row number) greater than or equal to detector row 216, the
first detector row that uses the long wavelength scattered light subtraction
formula. This is the wavelength where the short and long wavelength scattered
light subtraction methods match most closely, so it’s the best place to
estimate the value of the short wavelength scattered light when we are missing
detector row 187. Typically, detector row 221 (approx 599 nm) is the shortest
multispectral wavelength matching this criterion. The brackets { } represent a
15-point downtrack moving mean for each column and wavelength, with the two
highest and two lowest points discarded.
The
fact that the above procedure works, with CS independent of wavelength at
shorter wavelengths and a function of wavelength at longer wavelengths gives a
window into why there are two different wavelength regions of scattered light
behavior for the VNIR. The scattered light function is peaked and the source
is much brighter at longer wavelengths. At short wavelengths, the spatial
shape of the scattered light function is relatively independent of wavelength
because the scattered light is mostly coming from the slowly varying tails of
functions that are peaked at long wavelengths. At long wavelengths, the
spatial shape of the scattered light function changes with wavelength because
the scattered light is mostly coming from nearby wavelengths and one is close
to the peak of the scattered light function. This tends to bring out changes
in the spatial shape of scattered light due to scene nonuniformity and spectral
smile.
If
a pixel in one of the scattered light columns has the value 65535, is in the
bad pixel mask, or is identified as one of the cosmic ray pixels, that pixel is
not used. If all the scattered light columns in a given row are bad, the
scattered light column value is filled in by linear interpolation of the
nearest good rows.
The
CRISM IR channel has considerable second order light (source wavelength l/2) from the grating at l=2760-3960 nm. This stray light is sampled by detector pixels
inside the focal plane at the source wavelengths for a given frame of (x,l), so it is subtracted just by defining a matrix containing the
row number of the source of second order light for each detector row that
contains scattered light, and another matrix defining the ratio of second order
stray light signal to source signal. That ratio is measured using a
monochromator in ground calibration. Interpolated values are used for columns
not illuminated in that test. The second order light in a single pixel should
come from at most two pixels near l/2, but to be safe we define 6 row numbers which might all
contribute to the stray light for a given pixel. We assume the second order
light is translated directly along the columns of the detector, which is not
exactly correct (there is some keystone which moves the second order light
slightly from the source column) but should be good enough for stray light
subtraction. The row number images yx,l,n,Hz with n=1-6 give the
detector row numbers of the 6 rows that are second order light sources for each
detector pixel. The coefficient images kx,l,n,Hz with n=1-6 give the
fraction of the direct signal from detector pixel (x,yx,l,n,Hz) contributed to
detector pixel (x,l). Then, the stray
light is subtracted by the formula
RT14jx,l,TaI,Ta2,Hz,r = RT14ix,l,TaI,Ta2,Hz,r – Sn=1n=6 kx,l,n,Hz · RT14ix,l’=yn,Hz,TaI,Ta2,Hz,r
for
the IR. For the VNIR, this correction is not necessary, and the formula is
just
RT14jx,l,TaV,Hz,r = RT14ix,l,TaV,Hz,r
The
calculation of the y images is to uses only the closest wavelengths shorter and
longer than at l/2, calculated from the
production WA CDRs. Detector rows 332-355 (wavelengths approximately 1744-1592
nm) are excluded as source rows because the zone 1/zone 2 order sorting filter
boundary causes them to be inaccurately sampled. Note that for wavelengths in
hyperspectral images outside this range (3184-3488 nm for the pixels being
corrected), the wavelengths are densely sampled near l/2. For the multispectral images and the hyeprspectral images
3184-3488 nm, the wavelengths may be sparsely sampled near l/2, and the correction will not be as accurate.
The
k values are derived
from laboratory monochromator data on the second-order light contamination.
The coefficient values are weighted to apply linear interpolation in wavelength
between the detector rows with closest wavelength shorter and longer than l/2, as given in the y images, to an effective value at l/2.
These
images are stored as level 4 calibration data records (CDRs) named CDR4#0000000000_LLrbeeewsn_v.IMG,
where r=frame rate, b=binning, eee=exposure time parameter, w=wavelength filter, s=1 or 2
depending on whether side 1 or 2 lamps are used, n=detector, and v=version
number. The LL CDRs have the 6 y images and the 6 k images interleaved, starting with the n=1 y image, then the n=1 k image, then the n=2 y image, etc.
If
any pixels in the sum Sn=1n=4 kx,l,n,Hz · RT14ix,l’=yxlnHz,TaI,Ta2,Hz,r have the value
65535.0, they are treated as being zero for the purposes of this calculation.
Responsivity
as a function of wavelength results from three effects:
- The
instrument design including telescope design, efficiency of optical
elements, and quantum efficiency of the detectors.
- Variations
in detector responsivity as a function of detector temperature. The main
effects are a shift in the long wavelength edge for the VNIR detector, and
a movement in the interference fringes that appear on the long wavelength
end of the IR detector.
- Accumulation
of absorbing contaminants on optical surface. The major expected
contaminant is water ice on the detector.
CRISM’s
responsivity is tracked in flight using the internal integrating sphere, run under closed
loop control, using either bulb. This provides a field- and aperture-filling
source with stable radiance. The current plan is to take sphere calibration
measurements with one lamp within a few minutes of every scene measurement, and take
calibration measurements with the other lamp once a month to check the first
lamp. The sphere calibration may also be checked with images from Deimos when
available. The calibration is not expected to be a function of integration
time or frame rate, and all of the sphere calibration images are taken at 1 Hz.
The
instrument responsivity is the ratio of the DN from the in-flight sphere data, corrected
for bias, background, nonlinearity, stray light etc. in the same way the as
scene data, to the sphere radiance, measured on the ground and corrected to a
value appropriate to the in-flight sphere data. The calculation of instrument
responsivity at the time and temperatures of the in-flight sphere radiometric
calibration is described in Section 3.5. The responsivity in
DN/ms/(W/(m2 micrometer sr) ) is RSPjx,l,TcV,TcI,Tc2.
To
apply that responsivity to a scene image to calculate radiance at the
instrument aperture, we must first correct it for the instrument temperatures
in effect during the scene measurement. The algorithm includes corrections for
the detector temperatures TaV and TaI. It is possible
the spectrometer temperature Ta2 could also affect the responsivity
by shifting the beamsplitter reflectivity and transmission in wavelength. In
Section 3.4, this is discussed
regarding the radiometric calibration itself, and we believe we will be taking
radiometric calibration data close enough in time to the scene data that this
effect will be the same in both. In other words, Ta2=Tc2
to the accuracy required by the beamsplitter effect.
As
of 12/30/2008, the responsivity correction for detector temperature is not
applied either for VNIR or IR images. In both cases, the calibration software
does the calculation, but the correction is zero.
The
equation to correct the responsivity for detector temperature is
RSPkx,l,TaV,Ta2 = RSPjx,l,TcV,Tc2 · ( mx,l + nx,l
· TaV
+ px,l · TaV2 ) / ( mx,l + nx,l
· TcV
+ px,l · TcV2 )
for
VNIR, where ( mx,l + nx,l
· TaV
+ px,l · TaV2 ) is a model
of relative responsivity at each element x,l as a function of detector temperature TaV. The
quadratic functions are sufficiently accurate over the range of temperatures
expected, about 2° C for the VNIR detector. If the temperature ranges are
larger, they could be replaced with more descriptive functions, which would
probably be (1+tanh()) for the VNIR.
The
coefficient matrices mx,l , nx,l , and px,l are stored as a level 4 calibration data
record (CDR) named CDR4#0000000000_TDrbeeewsS_v.IMG,
where r=frame rate=0, b=binning=0, eee=exposure time parameter, w=wavelength filter, s=0, S=VNIR
detector, and v=version number. Note that as of 12/30/2008, mx,l=1, nx,l=0, and px,l=0 in the TD CDR, so no correction is
applied.
For
IR, instead of explicitly temperature correcting a single responsivity
measurement, we calculate the responsivity twice using two flight sphere calibration
measurements, one dayside and one nightside. We then linearly interpolate in
IR detector temperature between those two responsivity images to get the
temperature-corrected IR responsivity. For IR
RSPkx,l,TaI,Ta2 = ( RSPjx,l,TcI,Tc2 · ( TaI – TfI
) + RSPjx,l,TfI,Tf2 · ( TcI – TaI ) ) / ( TcI – TfI
)
where
TcI and TfI are the IR detector temperatures for the
dayside and nightside sphere calibrations
respectively. IR detector temperature 2 is the sensor specified in the
software. As of 12/30/2008, the “dayside” and “nightside” sphere calibration
measurements specified in the calibration pipeline are always the same sphere
image, generally the one closest in time to the scene image, so the detector
temperature interpolation is not applied.
As
of 12/30/2008, the responsivity correction for detector temperature is not
applied for either VNIR or IR images. In both cases, the calibration software
does the calculation, but the correction is zero. For the VNIR, the relevant values
in the TD CDR were zero. It was determined that the correction was small and
the values obtained from ground calibration not highly accurate, so we decided
not to apply the correction. For IR, two sphere calibrations are specified in
the software, but the tables generated always use just the single sphere
calibration closest in time twice, so the interpolation with detector
temperature does not get applied. It is possible the use of two sphere
calibrations as described below might reduce Fabry-Perot fringing at long
wavelengths of the detector, but we were concerned about introducing additional
noise by using the second sphere calibration.
This step
is trivial, because we do not expect binning to affect the responsivity. For pixels defined as
“scene” pixels in the detector mask CDR, the responsivity of a binned pixel is
just the mean of the responsivity of the detector elements in that bin.
Pixels not
defined as “scene” pixels in the detector mask CDR have their values replaced
by 65535 at this point. This includes dark and scattered light pixels. The
number of columns in the responsivity image after this step is 640/binning, where binning is 1, 2, 5, or
10. At this point, we also apply the wavelength
table to the responsivity, by simply selecting out the responsivity values at
each wavelength present in the table and throwing away the rest. The number of
rows in the responsivity image after this step is just the number of active
rows in the wavelength table.
The binned
responsivity is called RSPlx,l,TaV,TaI,Ta2,Hz.
The
detector masks are given in level 4 calibration data records (CDRs) named CDR4#0000000000_DMrbeeewsn_v.IMG,
where r=frame rate, b=binning, eee=0, w=wavelength filter, s=0, n=detector, and v=version
number. Each detector mask consists of an image of 8-bit integers, with the
individual bits set equal to 1 for different masks. Bits 0,1,2,3,4,5,6,7
represent no data, scene, dark, dark/scatter transition, scattered light,
scatter/scene transition, scene/dark transition, and row 0 respectively. For
example, when bit 1 is 1, the pixel is a scene pixel, and when bit 1 is 0, the
pixel is not a scene pixel.
The
wavelength tables are implicit in the detector masks, because scene pixels in
rows that are used have bit 1 set equal to 1 while all pixels in rows that are
not used have bit 0 set equal to 1. However, the wavelength tables are also
given in the level 6 CDR named CDR6_0000000000_WV_n_v.TAB,
where n=sensor ID and v=version number. In these tables, a 1 indicates the row
is used, and a 0 indicates the row is not used.
Again
this is trivial now that we have gone through all the correction steps. The spectral
radiance RDmx,l,r is just the count rate divided by
the instrument responsivity and the flat field FFx,l. The flat field is just the image of an
external flat field with the scene pixels in each row normalized to average to
1.
RDmx,l,r = RTjx,l,TaV,TaI,Ta2,Hz,r / ( FFx,l,Hz · RSPlx,l,TaV,TaI,Ta2,Hz )
FFx,l,Hz = FLx,l,Hz + EPx,l,Hz · log( RTjx,l,TaV,TaI,Ta2,Hz,r / RSPlx,l,TaV,TaI,Ta2,Hz )
The
units of RDmx,l,r are W/(m2 micrometer sr). As of 1/28/2009, EPx,l,Hz is zero, so it is a
straight flat field with no allowance for pixel-dependent nonlinearity.
The
flat field FLx,l,Hz is given in layer 0 of the flight level 4 calibration data
records (CDRs) named CDR4#tttttttttt_NUrbeeewsd_v.IMG,
where #=spacecraft time SCLK partition at the beginning of validity of the CDR,
tttttttttt=spacecraft time SCLK at the beginning of validity of the CDR,
r=frame rate, b=binning, eee=exposure time parameter, w=wavelength filter, s=sphere lamp used
to calibrate the flat field scenes (see section
3.3), d=detector, and
v=version number. Unlike the rest of the flight CDR4s, which are generated
automatically by the pipeline software, the NU CDR is generated periodically by
the science team, based on averages of images of a featureless area of Mars. The
IR flat fields are set equal to 1 in some bands, where the interaction of sharp
atmospheric features with instrument smile makes the flat-fielding unreliable.
The generation of the NU CDRs is described in section 3.3.
The
pixel-dependent nonlinearity parameter EPx,l,Hz is given in layer 1 of
the NU CDRs. This allows one to apply a different linearizing function for
different pixels, using the same form of the nonlinearity as applied to the
entire detector using average values of the nonlinearity parameters in Section Error! Reference
source not found.. Instead of pixel-dependent nonlinearity, one could equally well
call this a brightness-dependent flat field. The function log() is the natural
or base-e logarithm.
As
of 1/28/2009, EPx,l,Hz is always zero in all the NU CDRs, so the pixel-dependent
nonlinearity correction is not applied.
VNIR
images generally have no bad pixels except for a single dead detector pixel in
the full-resolution, hyperspectral mode.
IR
image cubes, on the other hand, have many noisy pixels. Some detector pixels
are always noisy, some are noisy for a time encompassing several image cubes,
and some are noisy for a time period within an image cube. It’s useful to
assign bad detector pixels from the bias images (generally taken within a week
of the scene) to filter out pixels that are saturated or always noisy, and bad
pixels from the dark images (taken within 5 minutes of a scene) to filter out
pixels that are noisy for several minutes. However, pixels that become noisy
after the first dark calibration image is taken and before the start of the
second dark calibration image aren’t captured by this “a priori” bad pixel
mask. Also, the “a priori” mask throws out the brightest two and dimmest two
values when it calculates standard deviations on nominally identical images. A
pixel has to be *really* noisy to be included in the “a priori” mask.
The
result is that the IR image cubes still have many noisy pixels even after the
“a priori” bad pixel mask is applied. The images benefit greatly from
identification of bad pixels using the processed image itself, and
interpolation over those bad pixels. This is an “ex post facto” bad pixel
removal, because it uses only the scene image cube itself to identify bad
pixels, which are then interpolated over in the scene image cube. The “a
priori” bad pixel algorithm used only calibration images to identify bad
pixels, which are then interpolated over in the scene image cube.
The
ex post facto bad pixel map is calculated entirely from a single frame equal to
the mean of all the lines in the image cube. A frame has spatial columns as
the x coordinate and wavelength bands as the y coordinate. For this purpose,
the content of the image cube in the spacecraft downtrack direction is averaged
out. Now, construct a “filtered mean frame” by filtering each wavelength band
of that frame with a moving 7-element median in the spatial (i.e. crosstrack or
column) direction. The 7-element median is used for full resolution images.
For half-resolution images, we use a 5-element median. We use a 3-element
median for 5x and 10x binned images. Now, define the “difference frame” as the
difference of the mean frame and the filtered mean frame. For each wavelength
band of the difference frame, calculate the standard deviation over the entire
crosstrack scene. If the absolute value of a pixel of the difference frame is
greater than 2.4 times the standard deviation for that pixel’s band, then that
pixel is “ex post facto” bad. Bad pixels are replaced by linear interpolation
from nearest neighbor columns just like for the “a priori” bad pixel map,
unless they have the value 65535. The BP CDR for the scene includes all the “a
priori” bad pixels and all the “ex post facto” bad pixels.
The
bad pixels have now been replaced by interpolation. There is an additional
step which replaces all bad pixels specified in the BP CDR with the average of
the two pixels to either side in the cross-track direction (same line, same
band), or just the value of the pixel on one side if the other side has the
value 65535. If both the neighboring pixels are 65535, then it averages the
closest 6 non-65535 pixels that are in the same image line and same band, and
replaces the existing value of the pixel with that value. If all 6 are 65535 or
the pixel is not bad, then the pixel value is not changed. Unlike the
interpolation above and in section 2.6, and every other step
of the calibration, this step does replace pixels that have been marked with
the value 65535.
In
addition, pixels from the edge of the detector (“non-scene” pixels) do not
correctly represent the scene and are replaced with the value 65535 in this
last step. The function Mx,l,Hz( ) applies the IR ex post facto bad pixel correction described
above, and also replaces the non-scene pixels with 65535.
RDnx,l,r = Mx,l,Hz( RDmx,l,r )
The
detector masks are given in level 4 calibration data records (CDRs) named CDR4#0000000000_DMrbeeewsn_v.IMG,
where r=frame rate, b=binning, eee=0, w=wavelength filter, s=0, n=detector, and v=version
number. Each detector mask consists of an image of 8-bit integers, with the
individual bits set equal to 1 for different masks. Bits 0,1,2,3,4,5,6,7
represent no data, scene, dark, dark/scatter transition, scattered light,
scatter/scene transition, scene/dark transition, and row 0 respectively. For
example, when bit 1 is 1, the pixel is a scene pixel, and when bit 1 is 0, the
pixel is not a scene pixel.
The
radiance RDnx,l,r for each scene image is saved in a targeted radiance data record
(TRDR)
named CCC########_XX_SCmmmn_TRRv.TAB, where CCC describes the observation
(target mode, multispectral survey or multispectral windows mode, etc.), ######## is the
observation ID in hex, XX is the counter within the observation, mmm is the
macro ID, n is the detector number 1 or 2, and v is the software version
number.
TRDRs are
saved in both target mode and mapping mode. The use of the word “targeted” in
TRDR has nothing to do
with target mode versus mapping mode. Rather, “targeted” in this application
is synonymous with “scene”.
In
addition to the scene radiance for every image, the TRDR also contains a smaller cube with summary
products. The summary products are designed to isolate surface and atmospheric
spectral features of scientific interest. Typically, they are formulae based
on ratios of radiances in defined wavelength channels, but sometimes they are
just the radiance of a given channel. Generally, the atmospheric summary
products are calculated directly from the radiance RDnx,l,r, while the surface
summary products are calculated from radiances with further atmospheric
corrections applied. The summary parameters are beyond the scope of this
report, which deals only with generating calibrated radiance images.
The
science team will monitor the TRDR files for saturated
pixels and adjust the choice of integration time or bad pixel algorithm as
necessary. As of 12/30/2008, no adjustments have been necessary.
Four
sources of nonrepeatability contribute to uncertainty in RDnx,l,r.
(1) Shot noise, from
photon-counting statistics in the signal, is given as
sqrt(
DN14gx,l,TaI,Ta2,TaV,Hz,t,r · gain ) / gain
where gain is approximately 80e-/DN for each detector.
(2) Dark noise, which
contains both read noise, shot noise due to dark current and thermal
background, and effects of any systematic detector noise. This is calculated
with each set of dark data
Noisex,l,Hz = s( DND14m=0…mtot,x,l,TdI,Td2,Hz,t,r )
The
Noisex,l,Hz read noise images are
stored as a level 4 calibration data record (CDR) named CDR4#0000000000_ UBrbeeewsn_v.IMG,
where r=frame rate=0, b=binning=0, eee=exposure time parameter, w=wavelength filter, n=detector, and
v=version number. A time ordered list of these files is also maintained as a
level 6 CDR, named CDR6_#_0000000000_UD_n_v.TAB,
where n=sensor ID and v=version number.
(3) Variations in
throughput of the optics due to differences in the exact position of the
shutter and what fraction of the beam of light it occludes. This would be the
variations in sphere radiance after the
shutter mirror correction has been made as described in section 3.4
(4) Variations in the
sphere radiance
each time the sphere is measured, as a function of any inaccuracy in the closed
loop control system. Again, this is after the corrections for sphere
temperature and shutter mirror position described in section 3.4 are made.
Note
that all of the errors in the list above are either random errors or some other
form of nonrepeatability. Currently, the uncertainty tables do not include any
allowance for systematic error such as errors in the calibration of the
reference source used on the ground or aging of the sphere lamps over the course of the
mission.
Another
error term that would be important for zone 3 of the IR spectrometer is error
due to subtraction of the 2nd order stray light. This would include
a random term due to noise in the scene data at the source wavelength, and a
systematic term accounting for errors in the ground measurement of the stray
light matrix.
The
I/F is the
ratio of the radiance observed from a surface to that of a perfect white
Lambertian surface illuminated by the same light but at normal incidence. The
formula is
IFx,l = p · RDnx,l,r / ( SFx,l / r2 )
The
solar flux SFx,l is solar spectral irradiance as seen by a normally illuminated
surface 1 AU from the Sun. SFx,l is evaluated at the wavelengths corresponding to the CRISM
spectral calibration and convolved to the CRISM spectral profile functions.
The variable r is the distance of Mars from the Sun in AU for that particular
observation.
The
array SFx,l is stored as a level 4
calibration data record (CDR) named CDR4#tttttttttt_SFrbeeewsn_v.IMG,
where #=spacecraft time SCLK partition at the beginning of validity of the CDR,
tttttttttt=spacecraft time for start of applicability of the file, r=frame
rate, b=binning, eee=exposure time parameter, w=wavelength filter, s=lamp=0, n=detector, and
v=version number.
The
I/F will have a dependence on incident (illumination) angle and emission
(reflection) angle. Incidence and emission angles relative to a model of the
Martian surface are given in a derived data record (DDR) file that is associated with
each TRDR file.
The name of the DDR file is CCC########_XX_SCmmmn_DDRv.TAB, where CCC describes
the observation (target mode, mulitspectral survey or multispectral windows mode, etc.),
######## is the observation ID in hex, XX is the counter within the
observation, mmm is the macro ID, n is the detector number 1 or 2, and v is the
software version number. The variable r is the value of the keyword
SOLAR_DISTANCE in the label file CCC########_XX_SCmmmn_DDRv.LBL that
accompanies each DDR file and describes its contents.
Interpretation
of I/F.
In optics, we often use BRDF, the ratio of the observed radiance from a surface
area to the irradiance incident on that surface area. The quantity I/F=BRDF·p·cosq, where q is the angle of incidence of the light from the Sun on the
surface of Mars. The BRDF of a perfect Lambertian surface is a constant 1/p, which gives the factor of p at q=0. The factor of cosq comes from the fact that the solar flux is the energy per unit
area per unit time incident on a normally illuminated surface, while the
irradiance is the energy per unit area per unit time incident on the actual
surface given the incidence angle of the light coming from the Sun. We prefer
to leave in the dependence on cosq rather than dividing it out because q depends on the local topography of the surface, so the user may
decide to use different values depending on the preferred model of the local
topography. The factor of p makes I/F more
intuitive in terms of energy absorbed and reflected. If the surface has some
absorption but its reflections are diffuse with a Lambertian distribution, then
the value of I/F for normal incidence light at a given wavelength is just the
total reflectivity, the total light energy reflected at that wavelength divided
by the total light energy incident at that wavelength.
Bias
is the DN level extrapolated to zero exposure time, in image form, taken at a
particular frame rate. This represents an electronics bias added to the
measured signal, to prevent near-zero DNs from going negative (and being
clipped) due to superimposed noise. In detector-level testing it was found that
bias has a nearly fixed pattern pixel to pixel, but that its magnitude varies
weakly with temperature and strongly with frame rate.
In
flight, bias for the IR detector is derived from a dedicated calibration,
performed periodically, in which, at each frame rate, a burst of 12 images is
taken with the shutter closed at each of several short exposure times. These
data are taken at IR detector temperature TbI. After making a
correction for a step in the bias that is a function of integration time
parameter, the DN values are fit linearly on a pixel-by-pixel basis and the
exposure time=0 y-intercept image is used as the bias estimate.
Processing
of the bias image cubes DNBn,x,l,TbI,TbJ,Tb2,Hz,t before bias Biasx,l,TbI,TbJ,Hz is calculated. See sections 2.2 and 2.6 for details.
DNBm,x,l,TbI,TbJ,Tb2,Hz,t is raw DN after fast
lossless compression is undone. The
subscript m runs from 0 to 11 and represents image number within a burst of
identical images.
Lossy
compression will
never be used on bias measurements, so there is no 8-bit to 12-bit conversion.
DNB12m,x,l,TbI,TbJ,Tb2,Hz,t = DNBm,x,l,TbI,TbJ,Tb2,Hz,t
DNB14m,x,l,TbI,TbJ,Tb2,Hz,t = Offsetl + Gainl · DNB12m,x,l,TbI,TbJ,Tb2,Hz,t
DNB14ax,l,TbI,TbJ,Tb2,Hz,t = mean2,2( DNB14m,x,l,TbI,TbJ,Tb2,Hz,t )
The
function mean2,2() is the per-pixel mean of the 12 bias frames with
the two highest and two lowest values thrown out for each pixel. This removes
cosmic rays and reduces noise.
At
a single frame rate, each pixel of the set of bias images at different
integration rates are fit to the following equation.
DNB14ax,l,TbI,TbJ,Tb2,Hz,t = c0x,l,TbI,TbJ,Hz + c1x,l,TbI,Tb2,Hz · t – a0I · Hv(rowl+1-(502/480) · (480-integ(t)))
Note
that c0 corresponds to the bias for that frame rate, and c1(t) corresponds to
the background signal for that frame rate. The third term is a step function
resulting from details of the readout of the image in the electronics. It is
entirely predetermined. The constant a0 is determined from ground calibration
data, Hv() is the Heaviside function, and integ(t) is the integration parameter. The value of t in ms is
calculated from the integration time parameter integ using the fomula t
= 1000 · ( 502 – floor((502/480) · (480-integ)))/(502 · rate)
), where floor() is a function that creates an integer from a real number by
rounding down.
To
calculate c0 and c1, DNB is corrected for the third term and a linear fit is
performed for each pixel. The fit is y=mx+b, where y = DNB14ax,l,TbI,TbJ,Tb2,Hz,t + a0I · Hv(rowl+1-(502/480) · (480-integ(t))), m =
c1, x = t, and b = c0. Then,
Biasx,l,TbI,TbJ,Hz = Bx,l,Hz ( c0x,l,TbI,TbJ,Hz )
The
function B() is the bad pixel removal algorithm (see section 2.6). Bias frames
Biasx,l,TbI,TbJ,Hz are stored as level 4
calibration data records (CDRs) named CDR4#tttttttttt_BIrbeeewsL_v.IMG,
where #=spacecraft time SCLK partition at the beginning of validity of the CDR,
tttttttttt=spacecraft time SCLK at the beginning of validity of the CDR,
r=frame rate, b=binning, eee=exposure time parameter, w=wavelength filter, s=0, L=detector
(IR), and v=version number. The tttttttttt=spacecraft time SCLK at the
beginning of validity of the CDR tells the software which bias measurement to
use for a given scene measurement. The calibration software uses the CDR4 file
with the largest value of tttttttttt that is smaller than the value of SCLK for
the scene measurement.
The
constants a0I for IR and a0V for VNIR are calculated from
ground calibration data and given in the level 6 CDR named CDR6_#_0000000000_BS_n_v.TAB,
where #=spacecraft time SCLK partition at the beginning time of validity of the
CDR, 0000000000=spacecraft time SCLK at the beginning time of validity of the
CDR, n=detector, and v=version number.
Shutter-closed image cubes (darks) are
taken with every scene and calibration measurement to subtract instrumental
background. They are taken at the same set of frame rates, integration times,
wavelength tables, and binning as
the associated scene or calibration measurement. For the VNIR, there is no
dark current or IR thermal background and this represents just detector bias,
the DN level at zero integration time. For the IR, the bias is subtracted
separately so that the nonlinearity correction may be applied before the dark
current and IR thermal background subtraction. The shutter-closed images are
then used in the IR background subtraction step.
Pipeline
for VNIR darks:
DNDm,x,l,TdV,Hz,t is raw DN after fast
lossless compression is undone. The
subscript m represents line number within a burst of identical frames. The
subscript d on the temperatures indicates temperatures for the dark image taken
before the scene image. The pipeline is exactly the same for the dark image
taken after the scene image, which is given the subscript e in the main
pipeline.
Lossy
compression will
never be used on dark measurements, so there is no 8-bit to 12-bit conversion.
DND12m,x,l,TdV,TdW,Hz,t = DNDm,x,l,TdV,TdW,Hz,t
DND14m,x,l,TdV,TdW,Hz,t = Offsetl + Gainl · DND12m,x,l,TdV,TdW,Hz,t
Biasx,l,TdV,TdW,Hz,t = mean2,2( Bx,l,Hz( DND14m,x,l,TdV,TdW,Hz,t ) )
VNIR
bias frames will be have to be binned in ground processing for use with scene
images that are EPFs and have 10x binning at 3.75 Hz.
The
function B() is the bad pixel removal algorithm (see section 2.6), and DND14 is
the 14-bit DN for the dark images. The frames within the burst are averaged,
throwing out the two as part of the cosmic ray removal algorithm, so the
subscript m disappears at that point. The dark image taken before has VNIR
detector temperature TdV, and the dark image taken after has VNIR
detector temperature TeV.
The
VNIR bias images Biasx,l,TdV,TdW,Hz,t are stored as level 4
calibration data records (CDRs) named CDR4#tttttttttt_BIrbeeewsS_v.IMG,
where #=spacecraft time SCLK partition at the beginning of validity of the CDR,
tttttttttt=spacecraft time SCLK at the beginning of validity of the CDR,
r=frame rate, b=binning, eee=exposure time parameter, w=wavelength filter, s=0, S=detector
(VNIR), and v=version number. The calibration software uses the CDR4 file with
the largest value of tttttttttt that is smaller than the value of SCLK for the
scene measurement.
Pipeline
for IR darks:
DNDm,x,l,TdI,TdJ,Td2,Hz,t is raw DN after fast
lossless compression is undone. The
subscript m represents frame number within a burst of identical frames. The
subscript d on the temperatures indicates temperatures for the dark image taken
before the scene image. The pipeline is exactly the same for the dark image
taken after the scene image, which is given the subscript e in the main
pipeline.
Lossy
compression will
never be used on dark measurements, so there is no 8-bit to 12-bit conversion.
DND12m,x,l,TdI,TdJ,Td2,Hz,t = DNDm,x,l,TdI,TdJ,Td2,Hz,t
DND14m,x,l,TdI,TdJ,Td2,Hz,t = Offsetl + Gainl · DND12m,x,l,TdI,TdJ,Td2,Hz,t
DND14am,x,l,TdI,Td2,Hz,t = DND14m,x,l,TdI,TdJ,Td2,Hz,t – Biasx,l,TbI,TbJ,Hz
+ a0I · Hv(rowl+1-(502/480) ·
(480-integ(t)))- bI,Hz · ( TdI
- TbI ) - bJ,Hz · ( TdJ - TbJ )
DND14bm,x,l,TdI,Td2,Hz,t = DND14am,x,l,TdI,Td2,Hz,t – Sn=0n=3 GI( DND14am,x0+n·d,l,TdI,Td2,Hz,t )
DND14cm,x,l,TdI,Td2,Hz,t =
S( DND14bbm,x,l,TdI,Td2,Hz,t, DND14am,x,l,TdI,Td2,Hz,t, DNDm,x,l,TdI,TdJ,Td2,Hz,t )
DND14dm,x,l,TdI,Td2,Hz,t = Bx,l,Hz( DND14cm,x,l,TdI,Td2,Hz,t )
DND14ex,l,TdI,Td2,Hz,t = mean2,2( DND14dm,x,l,TdI,Td2,Hz,t )
DND14gx,l,TdI,Td2,Hz,t = DND14ex,l,TdI,Td2,Hz,t / ( eHz · log(DND14ex,l,TdI,Td2,Hz,t) + fHz )
RTD14gx,l,TdI,Td2,Hz,t = DND14gx,l,TdI,Td2,Hz,t / t
IR
darks will have to be binned in ground processing for use with scene images
that are EPFs and have 10x binning at a given frame rate 3.75 Hz.
The
steps above follow the steps of correcting the scene images up to the point of
the IR background subtraction. Those steps are described in sections 2.2-2.8.
Background
images RTD14gx,l,TdI,Td2,Hz,t are stored in units of counts/millisecond as level 4 calibration
data records (CDRs) named CDR4#tttttttttt_BKrbeeewsL_v.IMG,
where #=spacecraft time SCLK partition at the beginning of validity of the CDR,
tttttttttt=spacecraft time SCLK at the beginning of validity of the CDR,
r=frame rate, b=binning, eee=exposure time parameter, w=wavelength filter, s=0, L=detector
(IR), and v=version number. The integration time t, used to calculate RTD14gx,l,TdI,Td2,Hz,t from DND14gx,l,TdI,Td2,Hz,t, may be calculated
from the integration time parameter in the label file
CDR4#tttttttttt_BKrbeeewsL_v.LBL that goes with the .IMG file containing the DND14gx,l,TdI,Td2,Hz,t images.
The
IR background rate RTD14gx,l,TdI,Td2,Hz,t is an input to section
2.9 of the main pipeline, where the dark images are interpolated to the time of
the scene or calibration measurement.
The
flat field FFx,l,Hz is just an average of many images of a featureless region of
Mars, with the scene pixels in each row normalized so they average to 1. The
EDRs are sent through the entire calibration pipeline to make radiance images,
and then averaged. A slight correction has to be made to the averaged images
to account for the fact that the featureless scene spectral radiance varies
with wavelength and the spectrometer has smile. Then, each row is normalized
so that the scene pixels in that row average to 1.
Some
of the IR flat field bands are set equal to 1. These are wavelengths near
sharp atmospheric features, where the interaction between sharp spectral
feature and instrument smile makes the flat field inaccurate.
The
flat field FFx,l,Hz is given in layer 0 of the flight level 4 calibration data
records (CDRs) named CDR4#tttttttttt_NUrbeeewsd_v.IMG,
where #=spacecraft time SCLK partition at the beginning of validity of the CDR,
tttttttttt=spacecraft time SCLK at the beginning of validity of the CDR,
r=frame rate, b=binning, eee=exposure time parameter, w=wavelength filter, s=0, d=detector, and
v=version number. Unlike the rest of the flight CDR4s, which are generated
automatically by the pipeline software, the NU CDR is generated by hand. It is
based on the median of several hundred images of a featureless area of Mars.
3.4 Calculating sphere radiance including sphere temperature and shutter mirror position
The
sphere radiance
was measured in ground calibration with respect to known external sources. The
most useful ones were a Spectralon plate illuminated by a NIST standard lamp and a cavity
radiation source imaged through a collimator. The sphere radiance measured on
the ground is then corrected to a value appropriate for a given calibration
source measurement in flight. There are two corrections currently planned:
- A
correction for the temperature of the integrating sphere in flight. The current in
the sphere is controlled by a silicon photodiode through a closed loop.
The long-wavelength edge of the sensitivity of that photodiode is
temperature-dependent, which causes the lamp current and sphere output to be
temperature-dependent. From the ground calibration data, we have images
taken at different sphere temperatures and we can estimate this effect.
This also corrects for variations in the thermal emission of the sphere,
which may have a small effect at long wavelengths. In addition, the
temperature of the beamsplitter tracks the temperature of the optical
bench to some extent, and the temperature of the optical bench tracks the
temperature of the integrating sphere. As an unintended side effect, the
correction of the sphere radiance for the integrating sphere temperature
will also give a partial correction for any dependence of the instrument
response on the beamsplitter temperature.
- A
correction for the exact angle of the shutter mirror for the sphere measurement in flight. The
shadow of the mask at the boundary of the VNIR order-sorting filter is
compared between the flight measurement and the ground measurement, and a
correction is made to the ground radiance to give the radiance expected
for that flight measurement. This correction changes every time the
shutter mirror is moved.
It
is possible that other effects such as the temperature of the focal plane board
controlling the sphere lamp have an effect on
sphere radiance, but as of this writing (10/19/2005) we have not yet
investigated the repeatability of the sphere images with changes in the
temperature of the focal plane boards.
First,
the calculation of sphere radiance at the
temperature of the flight sphere images.
The
ground measured sphere radiance as a function
of temperature is found in level 4 calibration data record CDR4#tttttttttt_SSrbeeewsn_v.IMG,
where #=spacecraft time SCLK partition at the beginning of validity of the CDR,
tttttttttt=spacecraft time, r=frame rate=0, b=binning, eee=exposure time
parameter, w=wavelength filter, s=1 or 2 depending on whether side 1 (IRFPE-controlled,
cross-slit) or 2 (VNIRFPE-controlled, along-slit) lamp is used, n=detector,
and v=version number. It consists of 3 images that are polynomial coefficients
for the sphere radiance at each pixel as a function of temperature in degrees
C. The sphere radiance is
qs,x,l + ss,x,l · Tc3 + ts,x,l · Tc32
The
units of sphere radiance are W/(m2
micrometer sr). Note: As of 12/30/2008, we are using values q=1, s=0, and t=0, so the correction is not explicitly applied.
Second,
the correction of the sphere radiance for shutter
mirror position nonrepeatability.
Rows
223-247 of the VNIR sphere images have DN levels
sensitive to the shutter mirror position because they are on the edges of the
VNIR filter zone boundary mask, and the shadow of the mask moves with the
shutter mirror. The mirror parameter MPs, a single value for each
set of calibration images taken without moving the shutter mirror, measures the
microscopic difference between the shutter mirror angle for the flight radiance
calibration and the ground radiance calibration. A different definition of MPs
is used for s=1 (IRFPE controlled, cross-slit lamp) and s=2
(VNIRFPE-controlled, along-slit lamp).
MP1
= S RTS14js=1,x=0…639,l=232…234,Tc3 / RGSBjs=1,Tc3
- S RTS14js=1,x=0,…639,l=223…225,Tc3 / RGSAjs=1,Tc3
MP2
= S RTS14js=2,x=0…639,l=235…237,Tc3 / RGSBjs=2,Tc3
- S RTS14js=2,x=0,…639,l=245…247,Tc3 / RGSAjs=2,Tc3
with
RGSBjs=1,Tc3 = Sx=0…639,l=232....234 RGS14js=1,x,l,TgV,Tg3 · (qs=1,x,l + ss=1,x,l · Tc3 + ts=1,x,l · Tc32 ) / (qs=1,x,l + ss=1,x,l · Tg3 + ts=1,x,l · Tg32 )
RGSAjs=1,Tc3 = Sx=0…639,l=223…225 RGS14js=1,x,l,TgV,Tg3 · (qs=1,x,l + ss=1,x,l · Tc3 + ts=1,x,l · Tc32 )
/ (qs=1,x,l + ss=1,x,l · Tg3 + ts=1,x,l · Tg32 )
RGSBjs=2,Tc3 = Sx=0…639,l=235....237 RGS14js=2,x,l,TgV,Tg3 · (qs=2,x,l + ss=2,x,l · Tc3 + ts=2,x,l · Tc32 ) / (qs=2,x,l + ss=2,x,l · Tg3 + ts=2,x,l · Tg32 )
RGSAjs=2,Tc3 = Sx=0…639,l=245…247 RGS14js=2,x,l,TgV,Tg3 · (qs=2,x,l + ss=2,x,l · Tc3 + ts=2,x,l · Tc32 )
/ (qs=2,x,l + ss=2,x,l · Tg3 + ts=2,x,l · Tg32 )
RTS14
is count rate observed with the onboard sphere as a source, and RGSA, RGSB are
the total count rates from sample rows in a given column of the ground data
from which the sphere radiance CDR is derived, corrected from Tg3,
the integrating sphere temperature for the ground calibration, to Tc3,
the integrating sphere temperature for the flight calibration. Rows 223-247 of
the VNIR have responsivity insensitive to detector temperature, so RTS14, RGSA,
and RGSB are not functions of TcV or TgV. RTS14j
and RGS14j have the full set of corrections for bias, detector
ghosts, bad pixel and cosmic ray removal, detector nonlinearity, background
subtraction, and stray light subtraction. A detailed description of these
corrections is given in section 3.5, and also in the main
data pipeline in sections 2.2 to 2.11.
RGS14js,x,l,TgV,Tg3 is the count rate for
the sphere radiance
measurement made during the ground calibration. It is given in the level 4
calibration data record CDR4#tttttttttt_SHrbeeewsn_v.IMG
described at the end of this chapter. The integration time t for the reference
measurement may be calculated from the integration time parameter for the
reference measurement, which is given in the label file CDR4#tttttttttt_SHrbeeewsn_v.LBL.
The integrating sphere temperature Tg3 for the ground measurement is
also given in the label file CDR4#tttttttttt_SHrbeeewsn_v.LBL.
The
movement of the shutter mirror causes the signal to increase in one set of rows
and decrease in the other. Subtracting the ratios in the two sets of rows
makes the parameter MPs insensitive to small changes in the
brightness of the sphere lamps. MPs
is derived from just the VNIR image, but it is used to correct both VNIR and IR
images.
The
formula for sphere radiance SRs,x,l,Tc3 including the shutter
mirror nonrepeatability correction simply comes from the assumption that the
correction is linearly dependent on the shutter movement parameter MPs.
This should be a good assumption if the correction is small, and in ground data
it appears to be 5% or less so far.
SRs,x,l,Tc3 = ( qs,x,l + ss,x,l · Tc3 + ts,x,l · Tc32 ) / ( 1 + MPs
· SCs,x,l )
The
shutter correction SCs,x,l image is derived by taking ratios of images, subtracting 1, and
dividing by the value of MPs for each image ratio. This may be done
with ground or flight images, and the correction is proven valid by the fact
that the correction image thus derived is pretty much the same for all image
pairs for which the shutter mirror has moved enough that the correction is
significant. In practice, SCs,x,l is an average of values calculated from multiple ground images.
Note: the images ratioed to calculate SCs,x,l as part of the analysis of the ground
calibration data not only have all the data pipeline corrections from sections 2.2-2.11, but also are
corrected for the detector temperature as described in 2-12, a later step.
This is just a detail of how the relevant ground CDR4 is generated, and it does not
affect the flight data pipeline.
MPs
itself will depend on which sphere lamp is used, but the
correction for shutter mirror position should be the same for either sphere
lamp if the mirror is not moved between one sphere lamp measurement and the
other.
The
shutter correction image SCs,x,l is kept in layer 1 of the level 4 calibration data record CDR4#tttttttttt_SHrbeeewsn_v.IMG,
where #=spacecraft time SCLK partition at the beginning of validity of the CDR,
tttttttttt=spacecraft time, r=frame rate=0, b=binning=0, eee=exposure time
parameter, w=wavelength filter=0, s=1 or 2 depending on whether side 1 (IRFPE-controlled,
cross-slit) or 2 (VNIRFPE-controlled, along-slit) lamp is used, n=detector,
and v=version number. The image RGS14js,x,l,TgV,Tg3,t is kept in layer 0 of
the level 4 calibration data record CDR4#tttttttttt_SHrbeeewsn_v.IMG, where
#=spacecraft time SCLK partition at the beginning of validity of the CDR,
tttttttttt=spacecraft time, r=frame rate=0, b=binning=0, eee=exposure time
parameter, w=wavelength filter=0, s=1 or 2 depending on whether side 1
(IRFPE-controlled, cross-slit) or 2 (VNIRFPE-controlled, along-slit) lamp is
used, n=detector, and v=version number. The image RGS14js,x,l,TgV,Tg3,t is simply the count
rate in DN/millisecond for the VNIR ground sphere radiance measurement, converted
to 14-bits and with all corrections applied that are applied to the RTj
flight data except the division by integration time t is not applied. The
count rate from the VNIR ground sphere radiance measurement is necessary in
order to calculate the shutter movement parameter MPs from the
flight VNIR calibration image. That calculation also requires the sphere
temperature Tg3 for the ground sphere radiance measurement. Tg3
is listed in the label file CDR4#tttttttttt_SHrbeeewsn_v.LBL. The integration
time parameter is listed in the label file CDR4#tttttttttt_SHrbeeewsn_v.LBL,
and the integration time t may be calculated from the integration time
parameter.
Responsivity
as a function of wavelength results from three effects:
- The
instrument design including telescope design, optical efficiency, and
detector performance.
- Variations
in detector responsivity as a function of detector temperature. The main
effects are a shift in the long wavelength edge for the VNIR detector, and
a movement in the interference fringes that appear on the long wavelength
end of the IR detector.
- Accumulation
of absorbing contaminants on optical surface. The major expected
contaminant is water ice on the detector.
CRISM’s
responsivity is tracked in flight using the internal integrating sphere, run under closed
loop control, using either bulb. This provides a field- and aperture-filling
source with stable radiance. The current plan is to take sphere calibration
measurements with one lamp within a few minutes of every scene measurement, and take
calibration measurements with the other lamp once a month to check the first
lamp. The sphere calibration may also be checked with images from Diemos when
available.
The
calculation of sphere radiance SRs,x,l,Tc3 is described in
Section 3.4, including the
correction for shutter mirror position.
The
pipeline processing for the onboard integrating sphere images before they are used to
calculate the responsivity.
DNSm,s,x,l,TcV,TcI,Tc2,Tc3,t is raw DN after fast
lossless compression is undone. The
subscript m represents image number within a burst of identical images. The
subscript s represents choice of sphere lamp, 1 or 2. The
subscript c on the temperatures indicates temperatures for the calibration
images. Note the sphere radiance depends on the sphere temperature Tc3, so
there’s an implicit dependence of DNS on Tc3 that is shown. Also, all sphere
images are taken at 1 Hz with no binning and the largest wavelength tables, so the Hz subscript is
omitted. The results are binned and the wavelength tables applied in section
2.13of the main pipeline.
Lossy
compression will
never be used on sphere measurements, so there
is no 8-bit to 12-bit conversion.
DNS12m,s,x,l,TcV,TcW,TcI,TcJ,Tc2,Tc3,t = DNSm,s,x,l,TcV,TcW,TcI,TcJ,Tc2,Tc3,t
DNS14m,s,x,l,TcV,TcW,TcI,TcJ,Tc2,Tc3,t = Offsetl + Gainl · DNS12m,s,Lx,l,TcV,TcW,TcI,TcJ,Tc2,Tc3,t
DNS14am,s,x,l,TcI,Tc2,Tc3,t = DNS14m,s,x,l,TcI,TcJ,Tc2,Tc3,t – Biasx,l,TbI,TbJ,Hz=1
+ a0I · Hv(rowl+1-(502/480) · (480-integ(t)))- bI,Hz=1 · ( TcI
- TbI ) - bJ,Hz=1 · ( TcJ
- TbJ )
DNS14am,s,x,l,TcV,t = DNS14m,s,x,l,TcV,TcW,t – ( aec·Biasx,l,TdV,TdW,t + acd·Biasx,l,TeV,TeW,t ) / (acd+aec)
-
bV,Hz=1 · [ aec · ( TcV - TdV ) + acd · ( TeV -
TcV
) ] / (acd + aec )
-
bW,Hz=1 · [ aec · ( TcW - TdW ) + acd · ( TeW -
TcW
) ] / (acd + aec )
DNS14bm,s,x,l,TcV,t = DNS14am,s,x,l,TcV,t – Sn=0n=3 GV( DNS14am,s,x0+n·d,l,TcV,t ) for VNIR and
DNS14bm,s,x,l,TcI,Tc2,Tc3,t = DNS14am,s,x,l,TcI,Tc2,Tc3,t – Sn=0n=3 GI( DNS14am,s,x0+n·d,l,TcI,Tc2,Tc3,t ) for IR
DNS14bbx,l,TaV,Hz,t,r = DNS14bx,l,TaV,Hz,t,r - medianx,l ( DNS14bx1...xn,l0...ls,TaV,TaW,Hz,t,r ) for VNIR and
DNS14cm,x,l,TcV,TcI,Tc2,Tc3,t =
S( DNS14bbm,x,l,TcV,TcI,Tc2,Tc3,t, DNS14am,x,l,TcV,TcI,Tc2,Tc3,t, DNSm,x,l,TcV,TcW,TcI,TcJ,Tc2,Tc3,t )
DNS14dm,s,x,l,TcV,TcI,Tc2,Tc3,t = Bx,l,Hz( DNS14cm,s,x,l,TcV,TcI,Tc2,Tc3,t )
DNS14es,x,l,TcV,TcI,Tc2,Tc3,t = mean2,2( DNS14dm,s,x,l,TcV,TcI,Tc2,Tc3,t )
DNS14gs,x,l,TcI,Tc2,Tc3,Taf,t = DNS14es,x,l,TcI,Tc2,Tc3,TcV,t / ( eHz · log(DNS14es,x,l,TcI,Tc2,Tc3,TcV,t) + fHz )
RTS14gs,x,l,TcI,Tc2,Tc3,TcV = DNS14gs,x,l,TcI,Tc2,Tc3,TcV,t / t
RTS14hs,x,l,TcV,Tc3 = RTS14gs,x,l,TcV,Tc3 for VNIR and
RTS14hs,x,l,TcI,Tc2,Tc3 = RTS14gs,x,l,TcI,Tc2,Tc3,ta1 – Bkgdx,l,TdI,TeI,Td2,Te2,ta1,td1,te1 for IR
RTS14ix,l,TaI,Ta2,Hz,t,r = RTS14hx,l,TaI,Ta2,Hz,t,r
- medianx,l ( RTS14hx1...xn,l0...ls,TaI,Ta2,Hz,t,r
) for IR
RTS14is,x,l,TcV,TcI,Tc2,Tc3,Hz = RTS14hs,x,l,TcV,TcI,Tc2,Tc3 – <RTS14hx1…xn,l,TaV,TaI,Ta2,Hz> ∙ SWhx,TaV,TaI,Ta2,Hz
for l<563 nm, - <RTS14hx1…xn,l,TaV,TaI,Ta2,Hz> ∙ CShx,l,TaV,TaI,Ta2,Hz for l>563 nm
for VNIR and
RTS14js,x,l,TcV,TcI,Tc2,Tc3,Hz = RTS14is,x,l,TcV,TcI,Tc2,Tc3 – Sn=1n=6 kx,l,n,Hz · RTS14ix,l’=yn,Hz,TaI,Ta2,Hz
for
IR.
The
steps above follow the steps of correcting the scene images up to the point of
the subtraction of second-order stray light. Those steps are described in
sections 2.2 to 2.11.
For
VNIR detector rows 185-215, the sphere is too dim to be used to calibrate the
images, and the SS CDR values in those rows are just instrument responsivity
calculated from the laboratory calibration.
The
sphere count
rate images RTS14js,x,l,TcI,Tc2,Tc3 are written to level 4 calibration data records (CDRs) named CDR4#tttttttttt_SPrbeeewsn_v.IMG,
where #=spacecraft time SCLK partition at the beginning of validity of the CDR,
tttttttttt=spacecraft time SCLK at the beginning of validity of the CDR,
r=frame rate, b=binning, eee=exposure time parameter, w=wavelength filter, s=0, n=detector, and
v=version number.
The
calculation of responsivity RSPjx,l,TcI,Tc2 is then very simple.
It’s just counts/radiance.
RSPjx,l,TcI,Tc2 = RTS14js,x,l,TcV,TcI,Tc2,Tc3 / SRs,x,l,Tc3
The
corrections to the responsivity for detector temperature are made in the main
data pipeline in section 2.12.The responsivity is not saved as a calibration
data record. It is calculated each time from the flight sphere images and the ground sphere
radiance. Normally, the responsivity is calculated using data from the primary
sphere lamp, which is s=2 (the
VNIRFPE-controlled, cross-slit lamp) as of 10/28/2005. Measurements with the
secondary lamp are taken during monthly engineering checkouts. The
responsivity should be the same calculated with either lamp, and this is a
useful in-flight check on the accuracy of the onboard calibration system. The
units of responsivity are DN/ms/(W/(m2 micrometer sr)).


The ATF
table is a special CDR used to list the calibration EDRs to be used to
calibrate each scene EDR. It is located in the
crism_pds_archive/edr/CDR/yyyy_doy/ATF directory of the PDS archive. The first
column of the ATF table lists every scene EDR with START_TIME in that day. The
remaining columns of each row list the calibration EDRs to use for the scene
EDR given in the first column of that row. The ATF table consists only of EDRs
that have actually been received. These are the ones used in calibration.
There is a similar BTF table that gives the calibration EDRs that were planned
for use with each scene EDR. The BTF table is generated for comparison with
the ATF table, in case some of the calibration EDRs are not downlinked and the
algorithm was forced to use a substitute.
VNIR
There are
2 types of calibration EDRs to be searched for, the shutter-closed DFs (for
VNIR these are for the bias calculation) and the sphere calibration SP EDRs. The SP EDRs have their
own DFs for calculating the bias for sphere measurements.
Note that
any downlinked EDRs with a “UN” macro descriptor in the filename should be
rejected as calibration EDRs. This will filter out any problem EDRs caused
when the instrument occasionally reverts back to default state 2 frames before
the end of a mapping mode observation.
I.
Logic for
determining desired calibration EDRs from predicted EDRs in initial observation
tracking table for a given measurement (BTF table)
a.
Shutter closed DF EDRs for bias for
scene or sphere EDR
i.
Select latest
(in encoded SCLK) DF EDR that is earlier than the scene or
sphere EDR and has the
same frame rate, exposure, and binning as
the scene or sphere EDR, and acceptable wavelength filter for the scene or sphere EDR
ii.
Select earliest
(in encoded SCLK) DF EDR that is later than the scene or
sphere EDR and has the
same frame rate, exposure, and binning as
the scene or sphere EDR, and acceptable wavelength filter for the scene or sphere EDR
iii.
Definition of
“acceptable wavelength filter for
the scene or sphere EDR”
1.
Filter 0 DF is
acceptable for filters 0, 1, 2, and 3 SP or SC
2.
Filter 1 DF is
acceptable for filter 1 SP or SC
3.
Filter 2 DF is
acceptable for filters 1, 2, and 3 SP or SC
4.
Filter 3 DF is
acceptable for filters 1 and 3 SP or SC
b.
Sphere
calibration SP SC EDR for radiometric calibration
i.
Select closest
(in encoded SCLK) SP EDR that is has acceptable binning and wavelength filter to go with the scene EDR
ii.
Select shutter
closed DF EDRs to go with the SP EDR by following (a) above
iii.
Definition of
“acceptable binning to
go with the scene EDR”
1.
For 10x binning scene EDR, any binning is OK for the SP EDR
2.
For 5x binning scene EDR, 1x or 5x are OK for the SP EDR
3.
For 2x binning scene EDR, 1x or 2x are OK for the SP EDR
4.
For 1x binning scene EDR, 1x is OK for the SP EDR
c.
Shutter closed DF EDR for bad pixel mask
i.
Select closest
(in encoded SCLK) DF EDR with 1x binning, 1Hz frame rate, integ time
parameter 425, and hyperspectral wavelength filter
II.
Logic for
determining calibration EDRs to use from the list of valid downlinked
calibration EDRs (ATF table), and what to do if some of them are invalid
a.
Shutter closed DF EDRs for bias for
scene or sphere EDR
i.
Select latest
(in encoded SCLK) existing valid DF EDR that is earlier than the scene or
sphere EDR and has the
same frame rate, exposure, and binning as
the scene or sphere EDR, and acceptable wavelength filter for the scene or sphere EDR
ii.
Select earliest
(in encoded SCLK) existing valid DF EDR that is later than the scene or
sphere EDR and has the
same frame rate, exposure, and binning as
the scene or sphere EDR, and acceptable wavelength filter for the scene or sphere EDR
iii.
If unexpected
DF EDRs are selected
1.
If the early DF
EDR is more than 6
hours earlier than the scene EDR, do not select that EDR but instead select the
late DF EDR twice
2.
If the late DF
EDR is more than 6
hours later than the scene EDR, do not select that EDR but instead select the
early DF EDR twice
3.
If both DF EDRs
differ from the scene EDR by more than 6 hours, select the
one that is closest in time to the scene EDR twice
4.
If either of
the DF EDRs selected is different from that predicted in the early observation
tracking table (note this part of the logic is implemented by the C++ program,
while the rest is implemented in PIPE)
a.
For scene
measurements, set the flag in the data quality indicator in the TRDR but otherwise continue normally
b.
For DF EDRs to
be used with SP EDRs, declare that SP EDR invalid, do not generate an SP flight CDR4 from that SP EDR, and go back
to PIPE to get another SP EDR
b.
Sphere
calibration SP EDR for radiometric calibration
i.
For VNIR,
detector temperature effect on responsivity is forward modeled, so we use only
one SP EDR
ii.
Select closest
(in encoded SCLK) SP EDR that has acceptable binning and wavelength filter to go with the scene EDR
iii.
Select shutter
closed DF EDRs to go with the SP EDR by following (a) above
iv.
If unexpected
SP EDRs are selected
1.
There is no
time limit on whether SP EDRs are acceptable, just use the closest in time of
the valid ones.
2.
If the SP EDR selected is different from
that predicted in the early observation tracking table, set the flag in the
data quality indicator in the TRDR but otherwise continue normally
(note this part of the logic is implemented by the C++ program, while the rest
is implemented in PIPE)
c.
Shutter closed DF EDR for bad pixel mask
i.
Select closest
(in encoded SCLK) DF EDR with 1x binning, 1 Hz frame rate, integ time
parameter 425, and hyperspectral wavelength filter
IR
There are
3 types of calibration EDRs to be searched for, the shutter-closed DFs (for IR
these are used for background subtraction), the shutter-closed BIs (for IR these
are used for bias subtraction), and the sphere calibration SP EDRs. The SP EDRs have their
own DF EDRs for calculating the background for sphere measurements.
Note that
any downlinked EDRs with a “UN” macro descriptor in the filename should be
rejected as calibration EDRs. This will filter out any problem EDRs caused
when the instrument occasionally reverts back to default state 2 frames before
the end of a mapping mode observation.
I.
Logic for
determining desired calibration EDRs from predicted EDRs in initial observation
tracking table for a given measurement (BTF table)
a.
Shutter closed DF EDRs for background
for scene or sphere EDR
ii.
Select latest
(in encoded SCLK) DF EDR that is earlier than the scene or
sphere EDR and has the
same frame rate and binning as
the scene or sphere EDR, and acceptable wavelength filter for the scene or sphere EDR
iii.
Select earliest
(in encoded SCLK) DF EDR that is later than the scene or
sphere EDR and has the
same frame rate and binning as
the scene or sphere EDR, and acceptable wavelength filter for the scene or sphere EDR
b.
Shutter closed BI EDRs for bias for
scene or sphere EDR
iv.
Find closest
(in encoded SCLK) set of BI EDRs and select all EDRs from that set that have
the same frame rate and binning as
the scene or sphere measurement regardless of
exposure, and acceptable wavelength filter for the scene or sphere EDR
c.
Sphere
calibration SP EDRs for radiometric calibration
i.
Select closest
(in encoded SCLK) nightside SP EDR that has acceptable binning and wavelength filter, and
frame rate to go with
the scene EDR (note as of 12/30/2008, nightside or dayside is acceptable)
ii.
Definition of
“acceptable frame rate to go with the scene EDR”
1.
1 Hz SP is
acceptable for 1 Hz or 3.75 Hz SC
2.
3.75 Hz SP is
acceptable for 1 Hz or 3.75 Hz SC
3.
15 Hz SP is
acceptable for 15 Hz SC
4.
30 Hz SP is
acceptable for 30 Hz SC
5.
Note 1 Hz SC
only occurs for FLAT macro, but 1 Hz SP will be fairly common
iii.
Select closest
(in encoded SCLK) dayside SP EDR that has acceptable binning, wavelength
filter, and frame rate to go with the scene EDR (note as of 12/30/2008, it
finds the same sphere as i, nightside or dayside)
iv.
If either SP
EDR differs from the
scene EDR by more than 24 hours, replace the errant SP EDR by a dummy EDR name
to force the C++ program to set the data quality flag in the TRDR no matter what SP EDR it actually
ends up using
v.
Select the VNIR
SP EDRs taken at the same time as the IR SP EDRs to do the shutter mirror
position correction. Select shutter closed DF EDRs to go with each sphere EDR by following (a) above
vi.
Select shutter
closed BI EDRs to go with each sphere EDR by following (b) above
d.
Shutter closed BI EDRs for bad pixel
mask
i.
Select closest
(in encoded SCLK) set of BI EDRs with 1x binning and hyperspectral wavelength filter
II.
Logic for
determining calibration EDRs to use from the list of valid downlinked
calibration EDRs (ATF table), and what to do if some of them are invalid
a.
Shutter closed DF EDRs for background
for scene or sphere EDR
ii.
Find latest (in
encoded SCLK) existing valid DF EDR that is earlier than the scene or
sphere EDR and has the
same frame rate and binning as
the scene or sphere EDR, and acceptable wavelength filter for the scene or sphere EDR
i.
Find earliest
(in encoded SCLK) existing valid DF EDR that is later than the scene or
sphere EDR and has the
same frame rate and binning as
the scene or sphere EDR, and acceptable wavelength filter for the scene or sphere EDR
ii.
If unexpected
DF EDRs are selected
1.
If the early DF
EDR is more than 6
hours earlier than the scene EDR, do not select that EDR but instead select the
late DF EDR twice
2.
If the late DF
EDR is more than 6
hours earlier than the scene EDR, do not select that EDR but instead select the
early DF EDR twice
3.
If both DF EDRs
differ from the scene EDR by more than 6 hours, select the
one that is closest in time to the scene EDR twice
4.
If either of
the DF EDRs selected is different from that predicted in the early observation
tracking table (note this part of the logic is implemented by the C++ program,
while the rest is implemented in PIPE)
a.
For scene
measurements, set the flag in the data quality indicator in the TRDR but otherwise continue normally
b.
For DF EDRs to
be used with SP EDRs, declare that SP EDR invalid, do not generate an SP flight CDR4 from that SP EDR, and go back
to PIPE to get another SP EDR
b.
Shutter closed BI EDRs for bias for
scene or sphere EDR
i.
Find closest
(in encoded SCLK) set of BI EDRs and choose all EDRs from that set that have
the same frame rate and binning as
the scene or sphere measurement regardless of
exposure, and acceptable wavelength filter for the scene or sphere EDR
ii.
If unexpected
BI EDRs are selected (note this part of the logic is implemented by the C++
program, while the rest is implemented in PIPE)
1.
There is no
time limit on whether BI EDRs are acceptable, just use the closest in time of
the valid ones
2.
If the BI EDR selected is different from
that predicted in the early observation tracking table, set the flag in the
data quality indicator in the TRDR but otherwise continue normally
3.
For BI EDRs to
be used with SP EDRs, declare that SP EDR invalid, do not generate an SP flight CDR4 from that SP EDR, and go back
to PIPE to get another SP EDR
c.
Sphere
calibration SP EDRs for radiometric calibration
i.
Select closest
(in encoded SCLK) nightside SP EDR that has acceptable binning, wavelength filter, and frame
rate to go with the
scene EDR (note as of 12/30/2008, nightside or dayside is acceptable)
ii.
Select closest
(in encoded SCLK) dayside SP EDR that has acceptable binning, wavelength filter, and frame
rate to go with the
scene EDR (note as of 12/30/2008, it finds the same sphere as i, nightside or
dayside)
iii.
Ensure the IR
detector temperature for the scene EDR does not fall too far outside the
range of the dayside and nightside SP EDRs
1.
Let T, Td, and
Tn be the median IR detector temperatures for the frames of each of the scene,
dayside SP, and nightside SP EDRs respectively
2.
If Td<=Tn,
replace the dayside SP EDR with the one closest (in encoded
SCLK) to the scene EDR with Td>Tn
3.
If
(T-Td)>0.5*(Td-Tn), replace the currently selected dayside SP EDR with the one closest (in encoded
SCLK) to the scene EDR with (T-Td)<0.5*(Td-Tn)
4.
If
(Tn-T)>0.5*(Td-Tn), replace the nightside SP EDR with the one closest (in encoded SCLK) to the
scene EDR with (Tn-T)<0.5*(Td-Tn)
iv.
Select the VNIR
SP EDRs taken at the same time as the IR SP EDRs to do the shutter mirror
position correction
v.
Find shutter
closed DF EDRs to go with each sphere EDR by following (a) above
vi.
Find shutter
closed BI EDRs to go with each sphere EDR by following (b) above
vii.
If unexpected
SP EDRs are selected
1.
If either SP
EDR differs from the
scene EDR by more than 24 hours, generate an error and ask for human
intervention to select the proper pair of SP EDRs to use in generating the TRDR for the given scene EDR
2.
If either of
the SP EDRs selected is different from that predicted in the early observation
tracking table, set the flag in the data quality indicator in the TRDR but otherwise continue
normally (note this part of the logic is implemented by the C++ program, while
the rest is implemented in PIPE)
e.
Shutter closed BI EDRs for bad pixel
mask
i.
Select closest
(in encoded SCLK) set of BI EDRs with 1x binning and hyperspectral wavelength filter
Locations of the reported temperatures, as well as
locations of heaters whose current is reported in housekeeping,
are shown in the following graphics

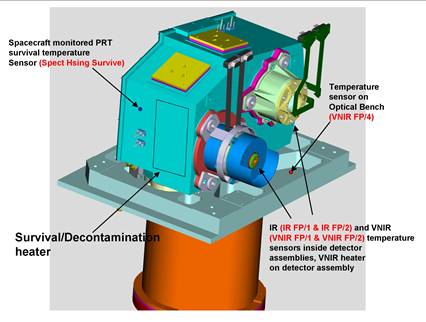


CRISM Hyperspectral Data Filter
PDS Data Product SIS Appendix - 02/02/2011
F. Seelos
CRISM version 3 TRDR (TRR3) I/F
full and half resolution hyperspectral data products (observations classes FRT,
HRS, HRL, FRS, ATO, ATU; e.g. FRT0000C202_07_IF165L_TRR3.IMG shown in Figure
N-8) have been processed with a custom filtering procedure prior to PDS
delivery (Figure N-1) [1,2]. The corresponding PDS delivered radiance on sensor
spectral data products (e.g. FRT0000C202_07_ RA165L_TRR3.IMG) have not been
filtered, allowing for the recovery of unmodified reflectance spectra (Figure
N-2). Over the course of the Mars Reconnaissance Orbiter (MRO) mission, CRISM
has operated with an IR detector temperature between ~107 K and ~127 K. IR
observations acquired at higher detector temperatures exhibit an increase in
systematic and stochastic noise (e.g. Figure N-2, Figure N-4). The primary
systematic noise component in both CRISM IR and VNIR data appears as along
track column-oriented striping due in part to artifacts in ground calibration
files applied to inflight integrating sphere image cubes. This is addressed by
the Ratio Shift Correction (RSC) - a scene-dependent multiplicative correction
frame developed through the serial evaluation of channel-specific inter-column
ratio statistics. The dominant CRISM IR stochastic noise components appear as
isolated positive or negatives data spikes or as column-oriented groups of
pixels with erroneous values. The spikes are thought to originate from the
delayed response of specific detector elements to high time frequency changes
in brightness as the slit moves across a contrasty scene on Mars. The
column-oriented features come from transient elevated values of detector dark
current either in the science data or the accompanying calibrations. Non-systematic
noise in IR data is identified and corrected through the application of an
Iterative Kernel Filter (IKF), which employs a formal statistical outlier test
as the iteration control and recursion termination criterion. This allows the
filtering procedure to make a statistically supported distinction between high
frequency (spatial/spectral) signal and high frequency noise based on the
information content of a given multidimensional data kernel. To illustrate the
end-to-end hyperspectral filtering process each data processing procedure shown
in Figure 1 is briefly described with the corresponding resulting data products
shown in Figures N-2 through N-9.
|

|
Figure N-1: CRISM
hyperspectral data filter processing flow chart. Boxes represent data
processing steps; Stacks represent CRISM image cubes. All procedures and
intermediate products are employed in the filtering of IR data. The elements
shown in green are bypassed by the VNIR filtering process.
|
Data Processing Overview
– The CRISM hyperspectral data filtering process takes as input a three
dimensional (x,t,λ) CRISM VNIR or IR I/F full or half resolution
hyperspectral image cube (Figure N-1: TRR I/F) and generates a filtered version
of the input data (Restore I/F) with the same dimensions – there is a 1:1
correspondence between a given input and output pixel (x0,t0,λ0).
The two main data filtering procedures – RSC and IKF – are optimally performed
on continuum-normalized spectral data, so the initial data processing steps are
the calculation of a reference image cube (Calculate Reference) and the
subsequent calculation of a ratio image cube using the reference image cube as
the denominator (TRR I/F / Reference). In this reference-normalized ratio space,
the filtering procedures to be applied depend on the wavelength range of the
input image cube. CRISM VNIR data does not exhibit the non-systematic or
stochastic noise the IKF procedure is designed to address, so only a single
application of the RSC procedure is required. The noise structure in CRISM IR
data is more complex, and requires the use of the RSC procedure as a pre- and
post- processing step relative to the application of the IKF procedure. The
image cube resulting from the ratio space data processing (VNIR: Ratio RSC; IR:
Resolve RSC) is then recombined with the previously calculated reference cube
(Resolve RSC * Reference) to transform the data back to I/F. The image cubes
used are described further below.
TRR I/F - PDS deliverable radiance on sensor image
cube (e.g. FRT0000C202_07_RA165L_ TRR3.IMG) transformed to I/F (Figure N-2).
Reference Cube - The reference cube is a low spectral
frequency / high spatial frequency representation of the input image cube
(Figure N-3). The spectrum for each spatial pixel is processed with a series of
boxcar filter and tuned implementations of the RSC procedure to produce a
'pristine' reference spectrum for each pixel. Any residual noise in the
reference cube will be propagated into the final result.
Ratio Cube - The reference cube is used to normalize
the input image cube to produce a ratio cube (Figure N-4). High frequency real spatial
variability in spectral radiance is normalized out of the ratio, while high
frequency spectral variability (signal and noise) is retained. All subsequent
data processing occurs in ratio space or a space resulting from further
transformations of the ratio cube.
Ratio Shift Correction (RSC) - The RSC procedure is
applied to the normalized spectral data as both a pre-processing (Figure N-5)
and post-processing (Figure N-7) step relative to the application of the IKF
procedure for IR data, or as the dominant filtering process for VNIR data.
Within a given spectral band, a spatial column corresponds to a single detector
element. The Ratio Shift Correction characterizes residual bias of each
detector element through the evaluation of inter-column (or cross-track
shifted) ratio statistics relative to an appropriate cross track model.
Modifying the complexity of the underlying cross track model allows the RSC
procedure to address high frequency column striping (Figure N-4 to Figure N-5)
or low frequency banding (Figure N-6 to Figure N-7), while retaining real scene
cross-track variability.
Iterative Kernel Filter (IKF) - The IKF procedure is a
kernel based filtering algorithm that models the information content of a given
three dimensional (x,t,λ) normalized data kernel as a multidimensional
polynomial. The model residuals are treated as a sample set and examined for
outliers using the Grubbs test. If an outlier is detected, the corresponding
pixel is removed from consideration and the kernel model is iterated. Model
iteration is terminated when no further outliers are detected. The filtered value
for the target pixel at the center of the input kernel is then given by a
proximity weighted model of the kernel elements that were not marked as
outliers. The confidence level threshold for the Grubbs test is conservative so
the filter retains some marginal noise (Figure N-6) rather than erroneously
removing real spectral structure.
Restore I/F - The result of the ratio space data
processing (Figure N-7) is multiplied by the reference cube (Figure 3) to
transform the filtered data back to I/F (Figure N-8). Figure N-9 shows the
effect of the CRISM hyperspectral filtering process on the example image cube.
References -
[1] Seelos F. P., Parente M., Clark T., Morgan F., Barnouin
O. S., McGovern A., Murchie S. L, and Taylor H. (2009) American Geophysical
Union, Fall Meeting, P23A-1234.
[2] F. P. Seelos, S. L. Murchie, D. C. Humm, O. S. Barnouin,
F. Morgan, H. W. Taylor, and C. Hash (2011) 42nd Lunar and Planetary
Science Conference, 1438.

Figure N-2: Three panel composite view of FRT0000C202
segment 0x07 (central scan) input I/F IR image cube. The corresponding radiance
image has been delivered to the PDS as FRT0000C202_07_RA165L_ TRR3.IMG Observation
FRT0000C202 was acquired with an IR detector temperature of ~120.8 K. The
systematic and stochastic noise components to be addressed by the filtering
procedure are evident as bright pixels and vertical lines. The composite plot
consists of: 1) Band 240 (~2300 nm) ground plane (x,t) image with a 1% linear
stretch; 2) Boxplot showing the data distribution and stretch limits for the
displayed band; 3) Median spectrum and [1,99]% envelope for the input image
cube.
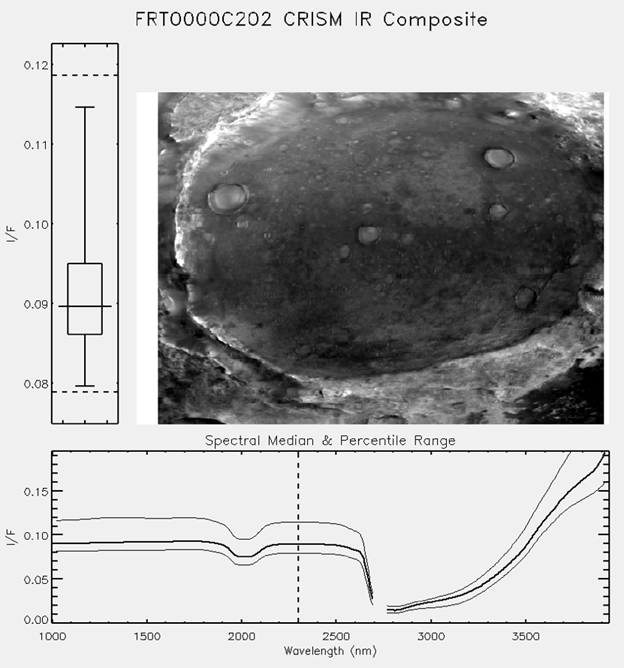
Figure N-3: FRT0000C202 reference cube. High frequency
spatial information is retained while high frequency spectral information is
discarded.
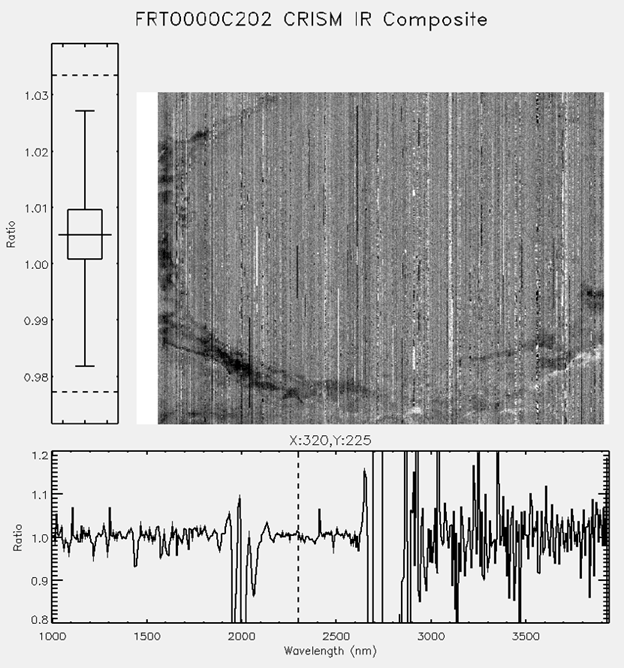
Figure N-4: FRT0000C202 ratio cube. Spatial pixel scale
variability due to low-spectral frequency continuum variation is retained by
the reference cube (Figure 3) but normalized out of the ratio cube. The ratio
cube contains both high frequency noise and high frequency signal components.
The spectral plot corresponds to the center pixel in the scene.
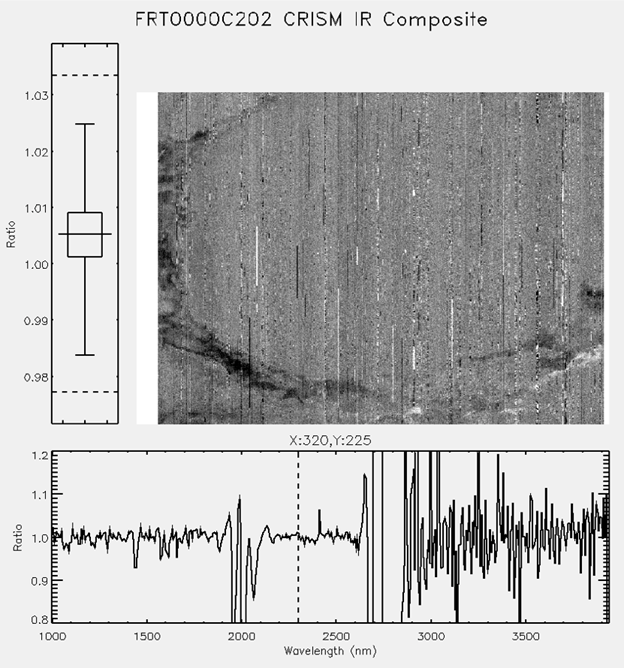
Figure N-5: FRT0000C202 ratio RSC cube. Systematic
column-to-column (along track) bias has been mitigated.

Figure N-6: FRT0000C202 resolve cube. Stochastic noise
components have been highly reduced while real high frequency spatial/spectral
variability has been retained.

Figure N-7: RFRT0000C202 resolve RSC cube. Systematic
along track banding has been mitigated.
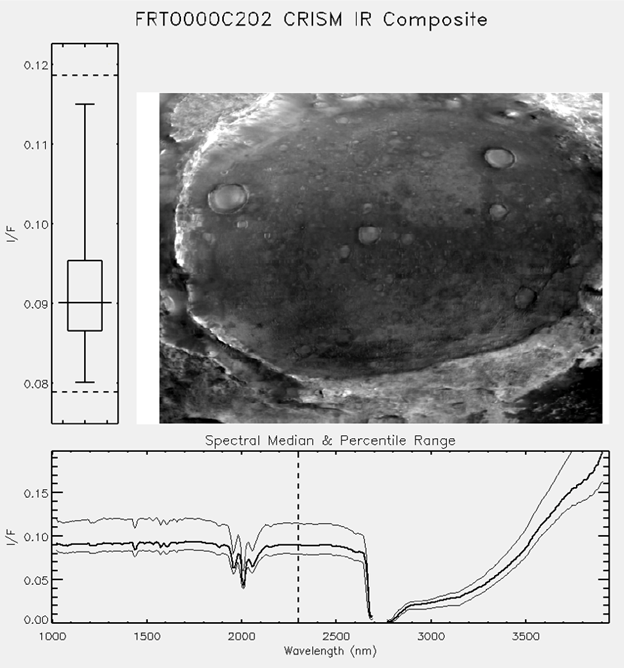
Figure N-8: FRT0000C202 restore cube – delivered to the
PDS as FRT0000C202_07_IF165L_ TRR3.IMG. Compare the ground plane image, median
spectrum and spectral percentile envelope, and data distribution boxplot to
Figure 2.

Figure N-9: FRT0000C202 input / output ratio cube showing
the effect of the data filtering procedure. Note that the single pixel
input/output ratio spectrum and band 240 ratio data are centered on unity.
N/A
0.
Orientation – CRISM Hyperspectral Targeted Observation Structure
A CRISM
hyperspectral targeted observation is composed of one central scan that is
acquired at either 1x (full resolution) or 2x (half resolution) cross-track binning
at relatively small gimbal angles (~[-30.0º, 30.0º]) and accompanying 10x
binned Emission Phase Function (EPF) scans that are acquired at larger gimbal
angles (~[-60º,-30º], ~[30º, 60º]). The central scan typically has a counter
within observation value (or segment ID) of 0x07, but this can vary in
anomalous circumstances. The majority of the TER/MTRDR data processing pertains
to the central scan, though the EPFs are critical to the Empirical Geometric
Normalization (EGN) procedure (P1-4). The central scan results in a three
dimensional hyperspectral image cube with dimensions [x,t,λ] where
individual [x,λ] frames are accumulated over time [t]. A given element in
the image cube can be indexed as [xi,tj,λk]
where 0 ≤ i ≤ (ns – 1), 0 ≤ j ≤ (nl – 1),
0 ≤ k ≤ (nb – 1), and ns, nl, and nb
are the number of samples, lines, and bands. Overall flow of the processing is
repeated below from Figure 2-9a. Visualizations of the TER/MTRDR data
processing procedures as applied to each targeted observation are included in
the PDS EXTRAS directory. These visualizations are described in detail in
Appendix P2.

1. PHT
– Lambertian Photometric Correction
The TER/MTRDR
data processing pipeline photometric correction uses a Lambert assumption:
 where
where  is the observed spectral
reflectance (I/F),
is the observed spectral
reflectance (I/F),  is photometrically corrected
spectral reflectance, and
is photometrically corrected
spectral reflectance, and  is
the angle of incidence.
is
the angle of incidence.
The
photometric correction is calculated for each spatial pixel [xi,tj]
and is applied uniformly to all spectral channels [λ]. The spatial pixel
specific incidence angle information is derived from the 'INA at areoid' band
(incidence angle with respect to the Mars areoid) in the CRISM DDR (Derived
Data Record) associated with the targeted observation and segment under
consideration. The DDR INA information is calculated with respect to the MOLA
(Mars Orbiter Laser Altimeter) areoid, which is reported as a degree and order
50 spherical harmonic expansion [Smith et al., 1999] and stored in the PDS (Planetary
Data System) as a 16 pixel/degree gridded data product. CRISM targeted
observations spatially oversample the gridded areoid data (~20/40 m/pxl vs.
~3.7 km/pxl), which results in non-physical spatial discretization in the DDR
incidence and emission angle bands. To prevent the propagation of this sampling
effect into the TER/MTRDR data products the INA data are fit by a low-order
two-dimensional polynomial in CRISM sensor space and the polynomial model is
used as the incidence angle information source in the spatial pixel specific
photometric correction.
The
reference polynomial model has the form:
 where x is the CRISM sample index,
t is the CRISM line index, and the model coefficients c0, c1,
…, c4 minimize
where x is the CRISM sample index,
t is the CRISM line index, and the model coefficients c0, c1,
…, c4 minimize  where
where  and
and  are the DDR INA and model incidence
angle bands.
are the DDR INA and model incidence
angle bands.
The
spatial/spectral impact of the PHT correction in the TER/MTRDR processing of a
given targeted observation can be assessed by comparing
[Class
Type][Target ID]_[Sensor]_COMPOSITE_01.PNG and
[Class
Type][Target ID]_[Sensor]_COMPOSITE_02.PNG in the PDS EXTRAS directory. The
variation in incidence angle across a CRISM targeted observation central scan
is generally very small so the PHT correction does not differ greatly from a
scalar multiplicative change in scale. The PHT correction is applied to all
segments of a targeted observation to maintain radiometric consistency across
the central scan and EPFs for downstream data processing.
2. ATM
– Modified 'Volcano Scan' Atmospheric Correction
The
volcano scan atmospheric correction uses empirically derived Mars atmospheric
transmission spectra to correct CRISM IR (L-detector) spectral reflectance data
for atmospheric gas absorptions (due primarily to CO2, H2O,
and CO) [Langevin et al., 2005; McGuire
et al., 2009; Morgan et al., 2011]. There are no significant atmospheric gas absorptions
over the CRISM VNIR wavelength range, so this correction is not applied to VNIR
(S-detector) data. Detector column-specific reference atmospheric transmission
spectra ([xi,λ] to accommodate spectral smile) are derived from
a suite of push-broom hyperspectral Flat Field Calibration (FFC) scans over
Olympus Mons and are matched to a given targeted observation to minimize high
frequency residual spectral structure due to sub-nm wavelength calibration
variability across the wavelengths affected by the 2000 nm CO2
absorption (1947 – 2066 nm). The depth of the 2000 nm CO2 absorption
is determined for the spectrum of each spatial pixel [xi,tj]
in the image cube under consideration, the selected reference transmission
spectrum is scaled to match according to the Beer-Lambert Law, and the
resulting model transmission spectrum is ratioed out of the I/F data. The TER/MTRDR
pipeline implementation of the volcano also includes a CRISM-specific volcano
scan patch (included in the CRISM Analysis Toolkit v7.1+ available at the PDS
Geosciences Node) that is applied after the initial correction to reduce the
influence of varying path length and pressure broadening in the derivation of
the reference transmission spectra.
The
spectral impact of the ATM correction on the IR data for a given targeted
observation in the TER/MTRDR processing flow is illustrated by comparing
[Class
Type][Target ID]_L_COMPOSITE_02.PNG and
[Class
Type][Target ID]_L_COMPOSITE_03.PNG in the PDS EXTRAS directory. The wavelength
bands selected for the RGB composite visualization are by design not greatly
influenced by atmospheric gas absorptions, so the effect of the ATM correction
is most evident in the scene median and percentile envelope spectral plots. The
ATM correction is applied to all segments of a targeted observation to maintain
radiometric consistency across the central scan and EPFs for downstream data
processing.
3. RSC
– Ratio Shift Correction (Empirical Flat Field / Along-Track 'Destriping')
The Ratio
Shift Correction (RSC) is a spatial column-oriented ‘destriping’ procedure
applied after the correction for atmospheric gas absorptions (ATM) to mitigate
the reintroduction of column stripe residuals [xi,t,λj]
that arise due to differences in detector element nonuniformity between the
acquisition of the selected reference Olympus Mons scan and the acquisition of
the targeted observation under consideration. The RSC procedure was initially
developed as a component of the TRR3 (targeted reduced data record calibration
version 3) hyperspectral data filtering procedure [Seelos et al., 2009] and seeks to isolate and mitigate
systematic calibration residuals traceable to individual detector elements [xi,λj].
The detector column and wavelength specific nature of the ATM correction can
result in similarly structured residuals. The RSC procedure is a
band-independent operation that gathers adjacent inter-column ratio statistics
from continuum-normalized spectral data and constructs a cross-track
multiplicative aggregate profile from robust estimates (median values) of the
inter-column ratios. The ratio of the cross-track aggregate profile to a
low-order Legendre polynomial (typically l = 5, m = 0) model profile fit
results in a correction profile [x] for the subject band [λ], and the
accumulation of correction profiles with wavelength results in a correction
frame [x,λ]. This correction frame is applied to all frames [t] in the
continuum normalized spectral cube, and the data are then transformed back to
I/F. The accumulation of the cross-track aggregate profile is subject to memory
(history) effects, so the inter-column ratio statistics are collected with both
a +1 and -1 column shift, and the profile accumulation is conducted in both
cross-track directions (+x, -x). The average of the four resulting correction
profiles is forwarded into the correction frame. The reference Legendre
polynomial profile is determined using a least absolute deviation figure of
merit which reduces the influence of spurious inter-column ratio median samples
on the model profile fit.
Visualizations
of the information content of an IR hyperspectral targeted observation central
scan image cube before and after application of the RSC procedure are provided
by
[Class
Type][Target ID]_L_COMPOSITE_03.PNG and
[Class
Type][Target ID]_L_COMPOSITE_04.PNG in the PDS EXTRAS directory. The magnitude
of the RSC result is commonly much smaller than the dynamic range of a targeted
observation central scan so the effect of the RSC procedure is not always
evident when comparing the 3-panel visualizations. In the TER/MTRDR data
processing flow this correction is applied to the central scan but not the
corresponding EPFs which do not provide adequate sampling statistics.
4. EGN
– Empirical Geometric Normalization
CRISM
hyperspectral targeted (gimbaled) observation data exhibit geometric effects
traceable to the requisite continuously varying observation geometry (gimbal
motion). The EGN procedure is designed to characterize the geometric
dependencies of spectral radiance across all segments of a CRISM targeted
observation (the central scan and any associated EPFs), isolate the spectral
continuum variability attributable to the gimbal motion, and transform the
central scan to a synthetic idealized (zero gimbal angle or push-broom)
acquisition geometry. Note that this procedure effectively normalizes the
effects of observing geometry to the minimum emergence angle (more-or-less
equivalent to the MRO spacecraft roll off nadir) during the central scan.
For this
correction the CRISM spectral data are binned as a function of two geometric
variables – the cosine of the emission angle [cos(e)] which is proportional to
the atmospheric path length under a plane-parallel simplifying assumption, and
the phase angle [g] which is a strong discriminator for atmospheric aerosol
scattering. With the (generally minimal) incidence angle variability across the
observation structure accommodated by the PHT correction, the [cos(e), g]
sampling also captures variability due to surface photometry. The data are
binned in one degree increments in phase angle [g] and an equivalent sampling frequency
in emission angle cosine (90 bins over the interval [0,1]).
The
spatial pixel specific geometric data are taken from the 'EMA at areoid'
(emission angle with respect to the Mars areoid) and 'Phase angle' bands in the
DDRs associated with the targeted observation under consideration. An abstract
polynomial model of the form:
 is fit to the sampled data so that
the coefficients c0, c1, …, c4 minimize
is fit to the sampled data so that
the coefficients c0, c1, …, c4 minimize  where 1 ≤ n ≤ N
for the N binned data points. The sampled spectral data for each wavelength are
modeled independently, but the high channel-to-channel correlation in
hyperspectral data allows the model parameters for band λk
to be used to seed the optimization for band (λk + 1).
where 1 ≤ n ≤ N
for the N binned data points. The sampled spectral data for each wavelength are
modeled independently, but the high channel-to-channel correlation in
hyperspectral data allows the model parameters for band λk
to be used to seed the optimization for band (λk + 1).
The model
parameters for each spectral channel are used to calculate a central scan
spatial pixel specific forward model using the EMA and Phase angle bands from
the associated central scan DDR as the independent variables. The accumulation
of forward model bands with wavelength produces a forward model spectral cube
that encompasses the geometric dependent variation across the central scan. The
objective of the EGN procedure is to transform the I/F data to a synthetic
idealized observation geometry, rather than a geometry-dependent continuum
removed space, so the forward model spectral cube is scaled by the forward
model spectrum at a reference [cos(e), g] geometry that corresponds to the
center of the cross-track field of view [x] within the frame [tj]
that includes the minimum sampled emission angle. As a result the correction
cube is unity at all wavelengths at the reference geometry and a relative
multiplicative correction at all other geometric coordinates.
In high
spectral contrast scenes (e.g. observations of polar layered deposit scarps),
particularly those with spatially organized disparate spectral classes (e.g.
regolith to ice transition across the central scan), the empirical geometric
modeling can be unduly influenced by surface spectral variability leading to
the incorporation of interpretable spectral structure in the correction cube. To
ensure that that resulting correction cube tracks the spectral continuum and
maintains channel-to-channel continuity the correction cube is spectrally
stabilized. The stabilization takes the form of a low-order Legendre polynomial
least absolute deviation figure of merit model fit as a function of wavelength,
weighted by the reference forward model spectrum. The resulting correction cube
is approximately unity at all wavelengths at the reference geometry, and a
multiplicative correction at all other geometric coordinates.
The
spatial/spectral impact of the EGN procedure in the TER/MTRDR processing of a
given targeted observation can be assessed by comparing
[Class
Type][Target ID]_S_COMPOSITE_02.PNG and
[Class
Type][Target ID]_S_COMPOSITE_05.PNG for VNIR (S-detector) data and
[Class
Type][Target ID]_L_COMPOSITE_04.PNG and
[Class
Type][Target ID]_L_COMPOSITE_05.PNG for IR (L-detector) data in the PDS EXTRAS
directory. Snapshots of the geometric modeling at the foundation of the EGN
procedure are shown in the series of model fit plots
[Class
Type][Target ID]_[Sensor]_EGN_FIT_[Number].PNG, and EGN along-track correction
profiles are presented in [Class Type][Target ID]_[Sensor]_EGN_PRO.PNG.
5. ESC
– Empirical Smile Correction
CRISM data
exhibit spatial/spectral structure traceable to spectral smile – an optical
artifact where the wavelength calibration shifts as a function of cross-track
spatial position [xi]. Spectral smile effects are most evident where
the observed spectral reflectance is changing rapidly with wavelength (steep
spectral slopes) and a small change in the center wavelength of the bandpass
can result in a relatively large change in the measured signal. The most
notable examples are the the steep spectral slopes from 450–750 nm and within
the composite CO2 absorption from 1850–2150 nmIn addition to spectral slope
effects, the CRISM radiometric calibration exhibits a small residual related to
spectral smile that appears as a wavelength-dependent cross-track gradient.
These effects are addressed by the Empirical Smile Correction (ESC) which uses
the WA-CDR (detector center wavelength sampling map) and SW-CDR (detector
sweet-spot wavelength vector) for the targeted observation under consideration
to transform data acquired across the detector to the reference (SW-CDR) center
wavelength sampling vector.
The
primary ESC procedure uses the detector wavelength map to construct an
intra-channel wavelength sampling histogram for each spectral channel that
delineates the cross-track spatial columns that fall into each wavelength bin. The
bin size is 0.125 nm for full resolution data (FRT) and 0.250 nm for half
resolution data (HRL, HRS). Continuum normalized spectral data are binned
according to the histogram map and the resulting data points are modeled as a
linear function of wavelength. Each binned data point is weighted in the linear
fit by the corresponding histogram count and the inverse of the binned sample
set dispersion. A forward model is calculated for the detector wavelength map
cross-track profile for each spectral channel, and the reference wavelength for
each channel is used to calculate a reference model value. Each
channel-specific forward model is then normalized to the appropriate reference,
the resulting correction frame [x,λ] is applied to all frames [t] in
continuum normalized spectral cube, and the result is transformed back to I/F.
Spectral
smile related effects in CRISM IR (L-detector) data are primarily due to
spectral slope, so spectral interpolation to the reference wavelength sampling
vector is performed prior to the application of the empirical correction
procedure. Spectral smile effects in CRISM VNIR (S-detector) data are generally
consistent with a minor radiometric residual, so the empirical correction procedure
is applied directly.
The
spatial/spectral impact of the primary ESC procedure in the TER/MTRDR
processing of a given targeted observation can be assessed by comparing
[Class
Type][Target ID]_[Sensor]_COMPOSITE_05.PNG and
[Class
Type][Target ID]_[Sensor]_COMPOSITE_06.PNG in the PDS EXTRAS directory. Snapshots
of the intra-band wavelength dependency modeling at the foundation of the ESC
procedure are shown in the series of model fit plots
[Class
Type][Target ID]_[Sensor]_ESC_FIT_[Number].PNG, and ESC cross-track correction
profiles are presented in [Class Type][Target ID]_[Sensor]_ESC_PRO.PNG.
6. XFM
- VNIR → IR Sensor Space Transform (Geometric Reconciliation)
The CRISM
VNIR and IR optical designs were individually optimized. As a result a given
location in the field of view is sampled differently and mapped to different
coordinates on the two detectors. The VNIR/IR sensor space transform uses the
known ground location of every VNIR and IR spatial pixel to construct a spatial
transformation that maps VNIR data into the IR sensor space. This
transformation allows for the concatenation of VNIR and IR spectral information
and the generation of full spectral range IR sensor space (TER) and map
projected (MTR) data products. The spatial transformation of the VNIR data is
conducted as a nearest neighbor resampling to avoid spectral averaging. After
the corrected and transformed VNIR data and corrected IR data are concatenated
in the IR sensor space, an image mask is generated that sets all the spectral
channels in any spatial pixels that do not have both VNIR and IR data to the
CRISM NAN value (65535.0). This results in the TER IF data product – a fully
corrected, full spectral range image cube.
7. INF
– TER/MTRDR Data Processing Pipeline Information Maps
Spatial
pixel specific performance and traceability information for the ATM and XFM
procedures is stored in the processing information (IN) data product. Spectral
discontinuity at the ~1000 nm VNIR/IR interface can be inherited from the
source TRR3 I/F data, arise as a byproduct of the TER/MTRDR data processing
pipeline which operates on the VNIR (S-detector) and IR (L-detector) data
independently prior to the spatial reconciliation and spectral concatenation,
and/or as a result of the nearest neighbor mapping of the VNIR data into the IR
sensor space. A spectral discontinuity residuals map (which can be influenced
by all of the above factors) and spatial sampling residual map (which traces
specifically to the VNIR/IR spatial transform) are both provided in the TER IN data
product (VNIR/IR Spectral Continuity Residual and VNIR/IR Spatial Gradient Residual).
The most common ATM correction residual is a high spectral frequency
oscillation across the wavelengths affected by the ~2000 nm CO2
absorption ultimately traceable to small variations in the wavelength
calibration between the observation being corrected and the best matching
reference atmospheric transmission frame. The IN product includes a
parameterization of this spectral shift artifact (ATM Correction Spectral Shift
Artifact). The remaining IN product bands provide full spatial traceability to
the source VNIR and IR TRR data products (VNIR Sample, VNIR Line, IR Sample, IR
Line), a measure of the magnitude of the VNIR/IR sampling discrepancy (VNIR/IR
Ground Sampling Offset), and a mask band which indicates which IR sensor space
spatial pixels have both VNIR and IR spectra (VNIR/IR Mask).
8. SUM
– Spectral Summary Parameters
The CRISM
spectral summary parameter library has been revised to take full advantage of
the hyperspectral sampling in CRISM targeted observation data and augmented to
span the diverse mineralogy identified and/or reported in CRISM data [Viviano-Beck et al., 2014]. The revised library is used to
generate a suite of 56 parameterizations of the spectral structure in the TER
and MTRDR IF data products (Table 3-12). The hyperspectral implementation of
each summary parameter generally takes the form of sampling multiple adjacent
spectral channels for a given reference wavelength used in the band math
calculation for a given parameter, and integrating the data in the sampling
kernel as appropriate to reduce the influence of spectral noise in the
parameter result. The dimension and handling of the spectral sampling ‘boxcar’
varies depending on the nature of the spectral feature being parameterized.
Narrow spectral features (e.g. BD1435 – CO2 ice) use few channels to
characterize the center and shoulders in the calculation of the relative band
depth, while parameters that are chiefly directed at the spectral continuum
level at a given wavelength (e.g. R1330 – proxy for IR albedo) use a large
boxcar and a spectral median to arrive at the parameterization result. The
summary parameter calculation results in the TER SU data product image cube.
9. SRE
– Refined Spectral Summary Parameters
The
hyperspectral data filtering procedure put in place as part of the CRISM v3
radiometric calibration (Appendix N) and the hyperspectral implementation of
the parameter calculations in the revised spectral summary parameter library
are effective at mitigating and suppressing spectral noise. However, the
majority of the parameter calculations seek to accentuate small spectral
variations so spectral noise residuals can still be propagated into the summary
parameters – particularly from IR (L-detector) data acquired later in the
mission at elevated detector operating temperatures. This has the potential to
compromise data visualizations based on the summary products and derivative
browse products. To maximize the scientific utility of the visualization
products a custom noise remediation procedure is applied to the majority of the
summary parameters. This procedure has some heritage in the CRISM hyperspectral
data filtering procedure implemented in version 3 of the CRISM calibration
pipeline, but has been modified to operate on individual parameter bands,
rather than hyperspectral I/F data. The filtering procedure identifies spurious
pixels using a statistical outlier test applied to an iterative sampling
kernel. Pixels that are flagged as outliers are subsequently interpolated from
neighboring non-spurious data elements. The parameter filtering procedure
results in the TER SR data product image cube.
10. BRS
– Browse Products
Browse
products are a series of up to 18 8-bit scaled RGB color composites that
display 3-band combinations of thematically related summary products (section
3.11). They provide a high-level visualization of the information content in
the source spectral image cube. The suite of CRISM browse products was
augmented in 2014 to span the diverse mineralogy reported in the CRISM data
set, and to provide better discrimination between spectrally similar phases [Viviano-Beck et al., 2014]. The utility of a browse product
visualization is dependent on the quality of the constituent summary parameter
bands and the stretch limits applied in scaling the parameter bands from 32-bit
(floating point) to 8-bit (byte). Parameters that are measures of the spectral
continuum at a given wavelength (e.g. R770, R1330) and those that encode
spectral ratio or slope information (e.g. ISLOPE1, IRR2) are stretched
according to the scene statistics. Parameters that are seeking to quantify the
presence and magnitude of a particular spectral feature (i.e., those with the
embedded character strings BD, INDEX, and MIN) are scaled using a stretch that
is calculated from the scene statistics but constrained by both the range of
physically meaningful parameter calculations and cumulative statistics
representative of the parameter variability for the entire data set. The
stretch floor is set by the expected minimum meaningful value for a featureless
spectrum according to the underlying band math calculation (e.g. band depth
(BD) parameters are designed to return zero for a featureless spectrum), and
the stretch ceiling is set by the scene statistics, subject to a minimum
reasonable ceiling value. This value is based on cumulative statistics for each
parameter band across a TER sample set encompassing ~5% of all targeted
observations. This parameter stretching protocol prevents saturation in scenes
where the parameter values are in the tail of the global distribution (when the
stretch ceiling is set by scene statistics), and prevents scenes that lack the
spectral structure a given parameter is designed to isolate from presenting
spectral noise as a meaningful detection (when the stretch ceiling is set by
cumulative statistics). Scaling information for each band is stored in the
associated PDS label. Each resulting browse product is stored as both a 3-band
raw binary file (.IMG) and a Portable Network Graphics file (.PNG) with an
alpha transparency channel corresponding to the non-scene spatial pixels. The
generation of the TER BR product suite marks the end of the TER/MTRDR data
processing pipeline sensor space data processing.
11.
Spectral Bad Bands
A canonical
set of spectral ‘bad bands’ has been identified through the evaluation of a set
of prototype TER IF data products and includes spectral channels with
questionable radiometry identified in the TRDR_DS.CAT catalog file, as well as
those that are subject to large uncertainties in the MTRDR data processing
pipeline. The TER/MTRDR ‘bad bands’ list is stored in the TER WV table, and
applied to the TER IF spectral data prior to map projection so the ‘bad bands’
are not forwarded into the MTR IF data product.
12.
Calculate Map-Projection Transformation
All of the
TER data products are in the IR (L-detector) sensor space established by the
source targeted observation. This allows for the calculation of a single
map-projection spatial transformation that will map the data from the IR sensor
space to the map projected space. The MTRDR data processing pipeline makes use
of the ESRI Projection Engine (PE) available through the ENVI APIs (ENVI
version 4.7+) in the generation of a Geographic Lookup Table (GLT) that encodes
this transformation. The map projection transformation is generated in
accordance with MRO project standards and is detailed in the MTR_MAP.CAT
catalog file.
13.
Map-Projection
The GLT is
applied to each TER data product to produce a paired MTR data product. The ‘bad
bands’ identified in the TER WV table are removed from the TER IF image cube
prior to map projection, so there are fewer spectral channels in the MTR IF
spectral product as compared to the TER IF spectral product. A map projected
version of the source targeted observation IR (L-detector) DDR is also included
in the MTR data product suite.

The
Targeted Empirical Record (TER) EXTRAS directory contains a series of data
processing visualizations for each CRISM hyperspectral targeted observation
that has been processed through the Map-Projected Targeted Reduced Data Record
(MTRDR) pipeline. These visualizations collectively depict the geometric
structure of the source TRR3 I/F spectral data, illustrate the spatial and
spectral impact of the TER/MTRDR data processing procedures
(Figure 2-9a), and provide snapshots of the underlying modeling behavior
of the empirical data processing. Detailed descriptions of the TER/MTRDR data
processing procedures are provided in Appendix P1. The
MTRDR EXTRAS directory contains one visualization for each processed
observation that illustrates the spatial/spectral information content of the
primary MTRDR I/F data product. Every TER/MTRDR data product set that is
released to the PDS has been reviewed and approved by members of the CRISM Science
Operations Center (SOC). The information generated by this release review
process is included in a Microsoft Excel format spreadsheet that is stored in
the top level TER/MTRDR EXTRAS directories.
All
TER/MTRDR EXTRAS visualizations are Portable Network Graphics (PNG) format
files. The TER detector specific systematic data processing visualizations have
file names with the form [Class Type][Target ID]_[Sensor]_[Name].PNG where
[Class Type] is a three letter observation type code (e.g. FRT, HRL, HRS),
[Target ID] is an eight character hexadecimal observation identifier, [Sensor]
is a single character indicating the VNIR (S-detector) or IR (L-detector)
wavelength range, and [Name] indicates the plot contents.
TRR3
I/F Observation Geometry:
Three
CRISM targeted observation geometry plots are color coded within a single file with
the inbound EPF branch in blue, the central scan in green, and the outbound EPF
branch in red. The geometric visualization plots are only generated for CRISM
VNIR (S-detector) data as the observation geometry is consistent across the
entire CRISM spectral range and a reference VNIR spectral band is sufficient to
illustrate the geometric dependency.
[Class
Type][Target ID]_S_PHA_EMI.PNG – Cartesian plot showing phase angle (g) vs.
emission angle (e). The incidence angle is plotted in black at [g = i, e = i]
for completeness.
[Class
Type][Target ID]_S_EMI_AZI.PNG – Polar plot showing emission angle (e) vs.
azimuth angle (ψ). The 360° azimuth space has been folded about the
principal plane (ψ = 0°; ψ = 180°) to reduce redundancy. In this
coordinate system the sub-solar azimuth is ψ = 180° and the zero phase
point lies along ψ = 0°. The incidence angle is plotted in black at [e =
i, ψ = 90° + i] for completeness.
[Class
Type][Target ID]_S_REF_EMD.PNG – Cartesian plot showing I/F for a reference
VNIR wavelength (~770 nm) vs. signed (directional) emission angle (e) with the
inbound branch plotted at negative emission angles.
MTRDR
processing 3-panel composites:
A three
panel display is generated for each significant processing step in the TER/MTRDR
pipeline allowing the spatial/spectral impact to be visualized and evaluated.
Each display includes a false color RGB composite with a 0.5% linear stretch on
each band, a spectral plot with the scene median and 5%-95% spectral envelope
(dashed lines indicate RGB band wavelengths), and distribution boxplots for the
three bands in the RGB composite (dashed lines indicate RGB band stretch
limits). The composite visualizations are numbered 01-06, but 03 and 04 only
apply to IR (L-detector data).
[Class
Type][Target ID]_[Sensor]_COMPOSITE_01.PNG – CRISM TRR3 I/F (MTRDR data
processing input – P1.0).
[Class
Type][Target ID]_[Sensor]_COMPOSITE_02.PNG – Lambertian photometric correction
(PHT – P1.1). The incidence angle does not vary significantly over the duration
of a CRISM targeted observation so this is most evident as a change in scale.
The plot scales are held constant for composites 02-06 for ease of comparison.
[Class
Type][Target ID]_L_COMPOSITE_03.PNG – Volcano scan atmospheric correction (ATM
– P1.2). Spectral structure resulting from atmospheric gas absorption is
mitigated.
[Class
Type][Target ID]_L_COMPOSITE_04.PNG – Ratio Shift Correction (RSC – P1.3).
Applied after the ATM correction to address spatially structured correction
residuals.
[Class
Type][Target ID]_[Sensor]_COMPOSITE_05.PNG – Empirical Geometric Normalization
(EGN – P1.4). Geometric dependencies that manifest as wavelength dependent
along-track gradients are mitigated.
[Class
Type][Target ID]_[Sensor]_COMPOSITE_06.PNG – Empirical Smile Correction (ESC –
P1.5). Spectral smile related spectral sampling (L-detector) and radiometric
residuals (S-detector; L-detector) are mitigated.
Empirical
procedure modeling plots:
The TER/MTRDR
empirical processing procedures (Empirical Geometric Normalization (EGN) and
Empirical Smile Correction (ESC)) address spatial/spectral variability as a
function of known observation properties (geometry and wavelength sampling).
The series of modeling plots are snapshots of the processes that underpin the
empirical procedures showing the sampled data and model fits for the spectral
channels that compose the RGB composites in the 3-panel displays. The reference
band ordering is inherited from the CRISM TRR3 I/F data and is reversed for the
IR (L-detector) relative to the VNIR (S-detector).
[Class
Type][Target ID]_[Sensor]_EGN_FIT_00.PNG – I/F vs. cos(e) for IR red (band 205)
/ VNIR blue (band 12).
[Class
Type][Target ID]_[Sensor]_EGN_FIT_01.PNG – I/F vs. g for IR red (band 205) /
VNIR blue (band 12).
[Class
Type][Target ID]_[Sensor]_EGN_FIT_02.PNG – I/F vs. cos(e) for IR green (band
360) / VNIR green (band 25).
[Class
Type][Target ID]_[Sensor]_EGN_FIT_03.PNG – I/F vs. g for IR green (band 360) /
VNIR green (band 25).
[Class
Type][Target ID]_[Sensor]_EGN_FIT_04.PNG – I/F vs. cos(e) for IR blue (band
425) / VNIR red (band 36).
[Class
Type][Target ID]_[Sensor]_EGN_FIT_05.PNG – I/F vs. g for IR blue (band 425) /
VNIR red (band 36).
[Class
Type][Target ID]_[Sensor]_ESC_FIT_00.PNG – Normalized I/F vs. center wavelength
for IR red (band 205) / VNIR blue (band 12).
[Class
Type][Target ID]_[Sensor]_ESC_FIT_01.PNG – Normalized I/F vs. center wavelength
for IR green (band 360) / VNIR green (band 25).
[Class
Type][Target ID]_[Sensor]_ESC_FIT_02.PNG – Normalized I/F vs. center wavelength
for IR blue (band 425) / VNIR red (band 36).
Empirical
procedure profile plots:
The
empirical corrections (EGN and ESC) are both constructed relative to reference
independent variable coordinates representative of idealized observing
circumstances – a nadir push-broom observation geometry for EGN and uniform
spectral sampling for ESC. The EGN geometric reference is set to the [cos(e),
g] geometry at the middle of the CRISM FOV (cross-track) in the frame that
includes the minimum sampled emission angle. The ESC wavelength reference is
taken from the SW-CDR (sweet-spot wavelength vector) for the observation under
consideration. Since the empirical corrections are relative and operate
orthogonally in the CRISM sensor space (EGN – along track; ESC – cross track)
it is instructive to evaluate profiles taken through I:O ratio cubes in the direction
of greatest influence. Each of the empirical correction profile plots show
three traces corresponding to the spectral channels that compose the RGB
composites in the 3-panel displays.
[Class
Type][Target ID]_[Sensor]_EGN_PRO.PNG – Along-track slice through the
cross-track center of the EGN I:O ratio cube.
[Class
Type][Target ID]_[Sensor]_ESC_PRO.PNG – Cross-track slice through the
along-track center of the ESC I:O ratio cube.
Empirical
procedure input and output comparison:
The
aggregate impact of the TER/MTRDR empirical processing (EGN and ESC) is
illustrated in four visualizations.
[Class
Type][Target ID]_[Sensor]_EGN_ESC_DST.PNG – Comparison of the data
distributions before and after the empirical processing in the three spectral
channels that compose the RGB composites in the 3-panel displays.
[Class
Type][Target ID]_[Sensor]_EGN_ESC_GRD.PNG – The base image is equivalent to the
sensor space TRU (VNIR RGB natural color) or FAL (IR RGB false color) browse
products as well as the RGB composite in the final 3-panel display. The nine
evenly distributed plot symbols indicate the spatial locations detailed in the companion
empirical processing I:O comparison spectral plots (IOS and IOR).
[Class
Type][Target ID]_[Sensor]_EGN_ESC_IOS.PNG – EGN and ESC aggregate input (gray)
and output (black) spectra for the spatial locations indicated in the companion
scene visualization (GRD).
[Class
Type][Target ID]_[Sensor]_EGN_ESC_IOR.PNG – EGN and ESC aggregate input to
output spectral ratios for the spatial locations indicated in the companion
scene visualization (GRD). Low spectral frequency variation is generally
attributable to the EGN procedures and high spectral frequency variation to the
ESC procedure.
MTRDR
processing resultant spectral product visualizations:
The two
main spectral data products that result from the TER/MTRDR data processing
pipeline are a fully corrected full spectral range image cube in the CRISM IR
(L-detector) sensor space ([Class Type][Target
ID]_[Counter]_IF[Macro]J_TER3.IMG) and the corresponding map projected data
product with spectral bands known to be radiometrically questionable or
inconsistently processed through the MTRDR pipeline removed from the image cube
([Class Type][Target ID]_[Counter]_IF[Macro]J_MTR3.IMG). Three-panel displays
for both of these image cubes provide an overview of the information content
and have a file name form inherited directly from the source TRR3 I/F data
products:
[Class
Type][Target ID]_[Counter]_IF[macro]J_TER3_Composite.PNG – 3-panel display for
the Targeted Empirical Record (TER) spectral product.
[Class
Type][Target ID]_[Counter]_IF[macro]J_MTR3_Composite.PNG – 3-panel display for
the Map-projected Targeted Record (MTR – short for MTRDR) spectral product.
APPENDIX P3. MRDR Data
Processing and Product Description
0.
Orientation – CRISM VNIR+IR Mapping Strip Structure
A CRISM VNIR+IR
mapping observation is composed of a series of one or more 180-second acquisitions
of nadir-pointed mapping data acquired at 10x binning. There are two classes of
such data, 72/73 selected channels called Multispectral Survey (MSP), and 262
channels called Hyperspectral Survey (HSP). Both include the same core set of
72 selected VNIR+IR channels with meaningful measurements of the surface and
atmosphere, and 1 nominally UV VNIR channel that measures only scattered light
and is used as part of the radiometric calibration process as described in Appendix
M. For the purpose of MRDR construction, the 72 channels of calibrated I/F data
are extracted from a parent TRDR of either class. A single input strip is a
three dimensional hyperspectral image cube with dimensions [x,t,λ] where
individual [x,λ] frames are accumulated over time [t]. The dimension
λ is built from discrete, non-adjacent VNIR or IR detector rows. A given
element in the image cube can be indexed as [xi,tj,λk]
where 0 ≤ i ≤ (ns – 1), 0 ≤ j ≤ (nl – 1),
0 ≤ k ≤ (nb – 1), and ns, nl, and nb
are the number of samples, lines, and bands. Augmentations to the processing for
version 4 MRDRs are repeated below from Figure 2-9b. Processing in versions 1
and 3 is shown in Figure 2-9.

1.
Pre-processing
Pre-processing
of input strips calibrated to I/F consists of three major downselections of the
input data.
First,
only data acquired with an IR detector temperature of ≤127.5K are
included. This is determined using the calibrated value of IR_DETECTOR_TEMP1
from the label on the multiband image.
Second,
only data from time periods when atmospheric dust opacity tdust <1.0 (scaled to CRISM
wavelengths) are included. This is determined from time periods when that range
was consistently exceeded in historical record of dust opacity retrievals, and
rejecting data acquired during those time periods. The opacities used are from multiannual
climatology of airborne dust from Martian year 24 to 35 using observations of
the Martian atmosphere from April 1999 to February 2021 made by the Thermal
Emission Spectrometer (TES) aboard Mars Global Surveyor, the Thermal Emission
Imaging System (THEMIS) aboard Mars Odyssey, and the Mars Climate Sounder (MCS)
aboard Mars Reconnaissance Orbiter (MRO), from Montabone et al. [2015, 2020].
These are accessible at http://www-mars.lmd.jussieu.fr/mars/dust_climatology/. The scaling factor in dust
opacity from thermal IR to CRISM wavelengths is 2.0.
Third, all
input data are reformatted as 72-channel I/F by deleting the detector rows in
dimension λ that are outside of the core VNIR+IR 72-channel set.
2. Filtering
(beginning with v4)
The
subsetted 72-channel I/F mapping strips are then filtered for stochastic and
systematic noise in two steps, respectively. The first step to remediate
stochastic noice is a simplified version of the Iterative Kernel Filter used
for noise remediation in the I/F version of TRR3’s. The second step to
remediate systematic noise is the Ratio Shift Correction also applied during
that filtering.
The Iterative
Kernel Filter (IKF) procedure as applied to multispectral data is a kernel
based filtering algorithm that models the information content of a given two
dimensional (x,t) normalized data kernel as a multidimensional polynomial. The
model residuals are treated as a sample set and examined for outliers using the
Grubbs test. If an outlier is detected, the corresponding pixel is removed from
consideration and the kernel model is iterated. Model iteration is terminated
when no further outliers are detected. The filtered value for the target pixel
at the center of the input kernel is then given by a proximity weighted model
of the kernel elements that were not marked as outliers. The confidence level
threshold for the Grubbs test is conservative so the filter retains some
marginal noise. The IKF is applied primarily to IR data.
The Ratio
Shift Correction (RSC) procedure as applied to multispectral data is the primary
filtering process for VNIR data. Within a given spectral band, a spatial column
corresponds to a single detector element. The Ratio Shift Correction
characterizes residual bias of each detector element through the evaluation of
inter-column (or cross-track shifted) ratio statistics relative to a cross
track model. Modifying the complexity of the underlying cross track model
allows the RSC procedure to address high frequency column striping or low
frequency banding while retaining real scene cross-track variability.
3. Two
alternative paths for correction of atmospheric and photometric effects (second
path only applies to v4)
(3.1) Mapping
data acquired prior to May 2012 fall within the time range of acquisition of CRISM
EPF data, from which retrievals provide a record of atmospheric dust opacity
sampled at CRISM’s wavelength sampling and resolution as a function of
latitude, longitude, Ls, and Mars year (stored in the ADR-CL; section 3.9). MRO
MARCI data provide retrievals of atmospheric water-ice opacity also as a
function of latitude, longitude, Ls, and Mars year (also stored in the ADR-CL).
Where these opacities are present, using the procedures described by McGuire et
al. [2013] and shown in Figs. 2-9 and 2-9b, a full radiative transfer model is
used to correct I/F to a standard reference photometric geometry with
atmospheric contributions to I/F normalized. Rather than calculations being
repeated for each pixel with minor inter-pixel differences, calculations are
done using DISORT for the range of expected variables and stored as look-up
tables in ADRs for discrete values, and the corrections are interpolated to the
specific conditions of each element in the I/F image cube [x,t,λ].
Information
on latitude, longitude, Ls, and altitude are extracted from the header of the
TRDR containing the I/F data and the companion DDR. These data are used to
extrapolate to the best estimate of the atmospheric opacites from the ADR-CL.
Then the photometric angles, altitude, Ls, and wavelength plus the opacities
extracted from the ADR-CL are used to interpolate wavelength-by-wavelength to
correction from I/F to Lambert albedo at i=30°, e=0°, g=30°, tdust=0.2, and tice=0.0 with no absorptions due to
atmospheric gases. The Lambert albedo becomes the basis to which mapping strips
acquired after May 2012 (when EPFs were no longer acquired) are corrected.
(3.2a) For
mapping data acquired after May 2012, a two-step (2a, 2b) correction is used that
does normalize out atmospheric gas absorptions and correct for photometric
effects, but does not attempt to correct for aerosol effects. This processing
closely follows that applied to TERs and MTRDRs (Appendix P1). The first step
is the volcano scan atmospheric correction uses empirically derived Mars
atmospheric transmission spectra to correct CRISM IR (L-detector) spectral
reflectance data for atmospheric gas absorptions (due primarily to CO2,
H2O, and CO) [Langevin et al., 2005; McGuire et
al., 2009; Morgan et al., 2011].
There are no significant atmospheric gas absorptions over the CRISM VNIR
wavelength range, so this correction is not applied to VNIR (S-detector) data.
Detector column-specific reference atmospheric transmission spectra ([xi,λ]
to accommodate spectral smile) are derived from a suite of push-broom
hyperspectral Flat Field Calibration (FFC) scans over Olympus Mons and are
matched to a given targeted observation to minimize high frequency residual
spectral structure due to sub-nm wavelength calibration variability across the
wavelengths affected by the 2000 nm CO2 absorption (1947 – 2066 nm).
The depth of the 2000 nm CO2 absorption is determined for the
spectrum of each spatial pixel [xi,tj] in the image cube
under consideration, the selected reference transmission spectrum is scaled to
match according to the Beer-Lambert Law, and the resulting model transmission
spectrum is ratioed out of the I/F data. The MRDR pipeline implementation of
the volcano also includes a CRISM-specific volcano scan patch (included in the
CRISM Analysis Toolkit v7.1+ available at the PDS Geosciences Node) that is
applied after the initial correction to reduce the influence of varying path
length and pressure broadening in the derivation of the reference transmission
spectra.
(3.2b) The
second step for data corrected using the volcano scan is application of a photometric
correction using a Lambert assumption:
where is the observed spectral
reflectance (I/F), is photometrically corrected
spectral reflectance, and is
the angle of incidence.
The
photometric correction is calculated for each spatial pixel [xi,tj]
and is applied uniformly to all spectral channels [λ]. The spatial pixel
specific incidence angle information is derived from the 'INA at areoid' band
(incidence angle with respect to the Mars areoid) in the CRISM DDR (Derived
Data Record) associated with the targeted observation and segment under
consideration.
4.
Empirical Smile Correction (beginning with v4)
CRISM data
exhibit spatial/spectral structure traceable to spectral smile – an optical
artifact where the wavelength calibration shifts as a function of cross-track
spatial position [xi]. Spectral smile effects are most evident where
the observed spectral reflectance is changing rapidly with wavelength (steep
spectral slopes) and a small change in the center wavelength of the bandpass
can result in a relatively large change in the measured signal. The most
notable examples are the the steep spectral slopes from 450–750 nm and within
the composite CO2 absorption from 1850–2150 nm. In addition to spectral slope
effects, the CRISM radiometric calibration exhibits a small residual related to
spectral smile that appears as a wavelength-dependent cross-track gradient.
These effects are addressed by the Empirical Smile Correction (ESC) which uses
the WA-CDR (detector center wavelength sampling map) and SW-CDR (detector
sweet-spot wavelength vector) for the strip under consideration to transform
data acquired across the detector to the reference (SW-CDR) center wavelength
sampling vector.
The
primary ESC procedure uses the detector wavelength map to construct an
intra-channel wavelength sampling histogram for each spectral channel that
delineates the cross-track spatial columns that fall into each wavelength bin.
Each binned data point is weighted in the linear fit by the corresponding
histogram count and the inverse of the binned sample set dispersion. A forward
model is calculated for the detector wavelength map cross-track profile for
each spectral channel, and the reference wavelength for each channel is used to
calculate a reference model value. Each channel-specific forward model is then
normalized to the appropriate reference, the resulting correction frame
[x,λ] is applied to all frames [t] in continuum normalized spectral cube,
and the result is transformed back to I/F.
6. Reconciliation
of Inter-strip Residuals in Corrected I/F and Lambert Albedo (beginning with
v4)
At this
stage of processing there are significant residual differences in I/F between
overlapping strips of mapping data due to several effects: systematic errors in
radiometric calibration between strips; inaccuracy in the assumption of a
wavelength-independent Lambert photometric function; for strips processed to
Lambert albedo, differences between the modeled and actual atmospheric dust and
ice opacities; for strips processed using the volcano scan correction, the
presence of atmospheric dust and ice opacities different that the target values
of tdust=0.2,
and tice=0.0; and differences between the
actual and modeled values of H2O vapor and CO due to seasonal or meteorological
variations. The calibration residuals are only somewhat notable in I/F, but the
magnitudes are in family with real spectral variations for many of the
mineralogical spectral indices represented as summary products.
To
remediate these interstrip differences, an optimization procedure is performed
in which derived values of surface reflectance are corrected to the values in
the closest to ideal data among the mapping strips, using the millions of overlap
and proximity relations among the approximately 83,000 strips of VNIR+IR data
in the map. The optimization procedure is shown schematically in the diagram
below. Prior to optimization, the millions of areas of intersection and close proximity
are identified. The differences between each such pair of strips is analyzed
using graph theory, and the best-fit gain and offset describing the differences
are recorded. Of course, each such solution will have some systematic error.
In the
optimization procedure, overall error is minimized (and the data set is
optimized) by applying the gains and offsets in a weighted fashion, anchoring
the output values to that part of the data which is closest to ideal. Those
“anchor” strips have the following attributes: low IR detector temperature, as
close as possible to the minimum value used in flight; low solar incidence
angles; low tdust in the data as acquired as
recorded in the Montabone et al. data; and the atmospheric corrections were
performed using the ADRs (traceable to DISORT; blue in the diagram below). The
mapping strips with such attributes have large weights as represented by the
dumbbells. The relative weighting among competing overlaps in correcting an
individual strip is represented by the springs below, with the “higher spring
constants” representing large overlaps or closer adjacencies and smaller
radiometric discrepancies.
Note that
only mapping strips corrected to tdust=0.2 and tice=0.0 using DISORT-traceable ADRs
populate the anchor strips. Provided that there are overlaps with such strips,
the strips corrected with the volcano scan approach effectively have their dust
and ice opacities normalized to the values in the overlapping ADR-corrected
strips. Thus the correction to Lambert albedo is propagated among all strips.
The resulting processed data populate the MRRAL multiband image.

7. Spectral
Summary Products (revised for v4)
The revised
CRISM spectral summary parameter library has been augmented to span the diverse
mineralogy identified and/or reported in CRISM data [Viviano-Beck et al., 2014;
Applicable Document 12]. The library is used to generate a suite of 56
parameterizations of the spectral structure in the MRDR I/F and Lambert albedo data
products (MRRIF and MRRAL respectively; Table 3-12). The summary product
calculation results in the MRRSU data product image cube. Note that unlike
summary products for TERs and MTRDRs, which are evaluated hyperspectrally at
wavelengths specified in the summary product formulas, MRDR summary products
are evaluated at the detector row closest to the specified wavelengths. Thus
the values resulting from the calculation are different for MRDRs. The
parameters specified as “surface” in Table 3-12 are evaluated using the MRRAL
multiband image; the parameters specified as “atmosphere” in Table 3-12, if
present, are evaluated using the MRRIF multiband image (v1).
8.
Reconciliation of Inter-strip Residuals in “Surface” Summary Products
(beginning with v4)
Even after
reconciliation of inter-strip residuals in reflectance data, very small
wavelength-dependent strip-to-strip residuals remain. These result in small
strip-to-strip residuals in “surface” summary products which in principle
capture stable surface spectral reflectance properties. To remediate the
residuals, the optimization procedure is applied a second time to “surface”
summary products (1-51 in Table 3-12), using the same weights and relative
weightings as applied earlier to strips corrected to Lambert albedo using ADRs
or corrected I/F using the volcano scan correction and photometric
normalization using a Lambertian function.
9. VNIR
to IR Sensor Space Transform (v4)
The VNIR
and IR component strips of mapping data are in slightly different sensor spaces
established by the instrument optics and detector layout. This difference is
accommodated by the calculation and application of a VNIRàIR sensor space
transformation. The VNIR and IR DDR per-pixel latitude and longitude
information is used to construct a nearest-neighbor transform, where each IR
spatial scene pixel is assigned the nearest-neighbor VNIR spatial scene pixel.
This transformation carries the VNIR data into the IR sensor space, and ensures
that all populated pixels in the downstream assembled tile have full spectral
range information (VNIR + IR).
10. Map-Projection;
Tile Traceability Template (v4)
The VNIR
to IR sensor space transformation also allows both the IR sensor space data and
transformed VNIR sensor space data to be propagated into the map projected tile
space using the IR DDR per-pixel latitude and longitude information. The map
projection of the IR and VNIR traceability data makes use of the ESRI
Projection Engine (PE) available through the ENVI APIs (ENVI version 4.7+) in
the generation of a Geographic Lookup Table (GLT) for each observation that
encodes this transformation. The map projection is generated in accordance with
MRO project standards and is detailed in the MRR_MAP.CAT catalog file. After
map projection, the VNIR and IR traceability information is assembled into a
map tile virtual mosaic which informs the downstream tile assembly. In the v1
and v3 tile production process the individual data products were map projected
directly, rather than through a traceability tile template.
11.
Stacking and Tiling
The tiling
scheme for MRDRs is described in section 3.5.2 and shown in Figure 2-10. Groups
of map tiles are processed one Mars chart at a time as described in the CRISM
Data Archive SIS (Applicable Document 5, section 3.2.7 and Table 3-12). For v4,
the traceability tile constituent observations are ordered so that the strips
acquired under the highest atmospheric optical depth (Montabone et al.) are
placed first, and strips are then placed in order of decreasing optical depth
with the strips acquired under the clearest atmospheric conditions “on top”.
The ordered traceability tile governs the assembly of the all the corresponding
tile data products which ensures stacking order and per-pixel data source
consistency. In the v1 and v3 tile production process, the constituent
observation are ordered by solar incidence angle rather than atmospheric
opacity, and the data product tiles were assembled directly from the
constituent map projected data products, rather than through a traceability
template. Up to five map projected multiband images are generated: (a)
uncorrected I/F which [MRRIF file], (b) Lambert albedo [MRRAL file], (c)
summary products [MRRSU file], (d) data from the VNIR and IR DDRs corresponding
to the data strips that are part of the I/F file [MRRDE], and (e) data from the
VNIR and IR DDRs corresponding to the data strips that are part of the Lambert
albedo file [MRRDE].
12.
Browse Products (revised for v4)
Browse
products are a series of up to 18 8-bit scaled RGB color composites that
display 3-band combinations of thematically related summary products (section
3.11). They provide a high-level visualization of the information content in
the source spectral image cube. The suite of CRISM browse products was
augmented in 2014 to span the diverse mineralogy reported in the CRISM data
set, and to provide better discrimination between spectrally similar phases [Viviano-Beck et al., 2014]. The utility of a browse product
visualization is dependent on the quality of the constituent summary parameter
bands and the stretch limits applied in scaling the parameter bands from 32-bit
(floating point) to 8-bit (byte). Parameters that are measures of the spectral
continuum at a given wavelength (e.g. R770, R1330) and those that encode
spectral ratio or slope information (e.g. ISLOPE1, IRR2) are stretched
according to the scene statistics. Parameters that are seeking to quantify the
presence and magnitude of a particular spectral feature (i.e., those with the
embedded character strings BD, INDEX, and MIN) are scaled using a stretch that
is calculated from the tile statistics, but constrained by both the range of
physically meaningful parameter calculations and cumulative statistics
representative of the parameter variability for the entire data set. The
stretch floor is set by the expected minimum meaningful value for a featureless
spectrum according to the underlying band math calculation (e.g. band depth
(BD) parameters are designed to return zero for a featureless spectrum), and
the stretch ceiling is set by the scene statistics, subject to a minimum
reasonable ceiling value. This value is based on cumulative statistics for each
parameter band across a sample of all MRDRs. This parameter stretching protocol
prevents saturation in scenes where the parameter values are in the tail of the
global distribution (when the stretch ceiling is set by scene statistics), and
prevents scenes that lack the spectral structure a given parameter is designed
to isolate from presenting spectral noise as a meaningful detection (when the
stretch ceiling is set by cumulative statistics). Scaling information for each
band is stored in the associated PDS label. Each resulting browse product is
stored as both a 3-band raw binary file (.IMG) and a Portable Network Graphics
file (.PNG) with an alpha transparency channel corresponding to the non-scene
spatial pixels. The generation of the browse product suite marks the end of the
MRDR data processing pipeline.
13. Differences
by Version
V1 MRDRs were
built using TRR1 mapping strips, and a preliminary version of the radiometric
transfer corrections stored in ADRs. All five multiband images are present, and
the MRRSU files use older formulations of summary products. MRRAL and MRRSU
files retain uncorrected interstrip residuals; MRRSU files suffer from
unfiltered stochastic noise. MRRIF files are available to create custom
products using derived information in the MRRDE file and CAT.
V3 MRDRs
were built using TRR3 mapping strips. The MRRIF and MRRDE multiband images are
present, representing coverage from 2012. MRRIF files can be used to create
custom products using derived information in the MRRDE file and CAT. MRRAL,
MRRDL, and MRRSU files are not present.
V4 MRDRs
are built using TRR3 mapping strips, and the refined version of the radiometric
transfer corrections stored in ADRs. All reflectance data are corrected to
Lambert albedo using the optimization procedures described above, and the MRRSU
files use current formulations of summary products. In MRRAL and MRRSU files
interstrip residuals and stochastic noise are minimized using the IKF filter
and optimization. The v4 inter-observation optimization employs seasonal frost
masking at latitudes poleward of +/-42.5 degrees. The MRRDE files provide
observing conditions and traceability to source observations. MRRIF and MRRDL
files are not present.
References:
Langevin, Y., F. Poulet, J.-P.
Bibring, and B. Gondet (2005), Sulfates in the North Polar Region of Mars
Detected by OMEGA/Mars Express, Science, 307(5715), 1584–1586,
doi:10.1126/science.1109091.
McGuire, P.C., et al. (2013) Mapping
Minerals on Mars with CRISM: Atmospheric and Photometric Correction for MRDR
Map Tiles, Version 2, and Comparison to OMEGA. 44th Lunar and Planetary Science
Conference, abstract #1581.pdf
McGuire, P. C. et al. (2009), An
improvement to the volcano-scan algorithm for atmospheric correction of CRISM
and OMEGA spectral data, Planet. Space Sci., 57(7), 809–815,
doi:10.1016/j.pss.2009.03.007.
Montabone, L., et al. (2015)
Eight-year Climatology of Dust Optical Depth on Mars. Icarus 251, pp. 65-95,
doi: https://doi.org/10.1016/j.icarus.2014.12.034
Montabone, L., et al. (2020)
Martian Year 34 Column Dust Climatology from Mars Climate Sounder Observations:
Reconstructed Maps and Model Simulations. J. Geophys. Res. - Planets, https://doi.org/10.1029/2019JE006111
Morgan, F., J. F. Mustard, S. M.
Wiseman, F. P. Seelos, S. L. Murchie, P. C. McGuire, and CRISM Team (2011),
Improved Algorithm for CRISM Volcano Scan Atmospheric Correction, in Lunar and
Planetary Institute Science Conference Abstracts, vol. 42, p. 2453.
Seelos, F. P., M. Parente, T.
Clark, F. Morgan, O. S. Barnouin-Jha, A. McGovern, S. L. Murchie, and H. Taylor
(2009), CRISM Hyperspectral Data Filtering with Application to MSL Landing Site
Selection, AGU Fall Meet. Abstr., 23, 1234.
Viviano-Beck, C. E. et al. (2014),
Revised CRISM Spectral Parameters and Summary Products Based on the Currently
Detected Mineral Diversity on Mars, J. Geophys. Res. Planets, doi:2014JE004627.
APPENDIX P4. VRDR Data
Processing and Product Description
A CRISM
VNIR hyperspectral mapping observation is composed of a series of one or more
180-second acquisitions of nadir-pointed mapping data acquired at 5x or 10x
binning. There are two classes of such data, all 107 VNIR channels 10x binned
spatially to ~180 m/pxl called Hyperspectal Survey VNIR (HSV), and 90 VNIR channels
5x binned spatially to ~90 m/pixel called Multispectral Survey VNIR (MSV). Both
include the same core set of 90 selected VNIR channels with meaningful
measurements of the surface and atmosphere, and 1 nominally UV VNIR channel
that measures only scattered light and is used as part of the radiometric
calibration process as described in Appendix M. For the purpose of VRDR
construction, the 92 channels of calibrated I/F data are extracted from a
parent TRDR of either class. A single input strip is a three dimensional
hyperspectral image cube with dimensions [x,t,λ] where individual
[x,λ] frames are accumulated over time [t]. The dimension λ is built
from discrete, non-adjacent VNIR detector rows. A given element in the image
cube can be indexed as [xi,tj,λk] where 0
≤ i ≤ (ns – 1), 0 ≤ j ≤ (nl – 1), 0
≤ k ≤ (nb – 1), and ns, nl, and nb are
the number of samples, lines, and bands.
Processing
to create tile maps is as for version 4 MRDRs with the following differences:
·
Input data
consisted of two types of mapping strip multiband images whose formats were
comparable to MSW and HSP data respectively: VNIR hyperspectral data in
92-channel MSV strips where all 92 channels with useful signal were included,
at 90 m/pixel; and VNIR 107-channel hyperspectral data in HSV strips at 180
m/pixel.
·
Pre-processing
consisted of subsetting HSV strips to the 92 channels present in MSV data.
·
No atmospheric
correction was applied to the data, only a correction to Lambert albedo.
·
The Ratio Shift
Correction (RSC) and Empirical Smile Correction (ESC) were applied exactly as
in MRDRs.
·
The Iterative
Kernel Filter (IKF) correction was not applied.
·
However
additional filtering step was required, the Frame Set Correction described by
Frizzell et al. (2019). In 30 Hz MSV mode, VNIR bias oscillated chaotically at
sub-second to seconds time scales. Differences in the oscillation pattern
between channels of the input multiband images were of a magnitude comparable
to weaker summary parameters, e.g. BD920, strength of the ~0.9-µm band due to
low-Ca pyroxene and ferric minerals. Bracketing background/bias measurements
have insufficient temporal sampling to remove this source of systematic noise.
The Frame Set Correction removed the resulting spatial row- oriented banding
(in sensor space, parallel to single frames within the strip) by gathering
adjacent [y] statistics and constructing an along-track additive aggregate
profile from the median values of the discrepancies. The profiles were
accumulated from both slightly offset along-track directions (+y and –y) and
the difference statistics were also collected with a +1 and -1 shift. The
aggregate profile was smoothed using a sliding boxcar median filter with a
length scale of 50 frames (approximately the size of the largest residual
structures). The boxcar result was subtracted from the aggregate profile to
produce a correction profile for each spectral band [lk]. The along-track correction was
then applied to all samples [yj] in the input multiband image.
·
Anchor strips
for the map were those acquired under conditions of lowest atmospheric opacity
as recorded in the data set of Montabone et al (2015, 2020). The strips
included some that anchor the MRDRs, but also incorporated strips acquired
after cessation of IR data collection. Inter-strip reconciliation proceeded as
with MRDRs except only for VNIR wavelengths.
·
The only
summary parameters and browse products generated were those that require only
VNIR wavelengths.
·
VRDRs were
constructed at a pixel scale of 654 ppd (twice the value as for v4 MRDRs, 90
m/pixel), a close match to the native resolution of MSV data. Thus resulting
tiles have 2x the linear dimension of v4 MRDRs.
·
The maps were constructed
in two steps, each with higher values of tdust laid in first, and lower values of
tdust
laid in on top. In the first step, 90 m/pixel MSV strips were laid in. Then,
180 m/pixel HSV strips are laid in the in same order, but placed “in back of”
the MSV strips. This procedure resulted in lower spatial resolution data
filling coverage gaps in higher spatial resolution data.
Frizzell,
K. R., Seelos, F. P., Humm, D. C., Murchie, S. L., Hash, C. D., 2020.
Implementation of a residual correction in the MRO CRISM VNIR mapping strip
data processing pipeline. 51st Lunar Planet. Sci. 51, abstract #2377.
PDS_VERSION_ID = PDS3
RECORD_TYPE = UNDEFINED
LABEL_REVISION_NOTE = "2003-11-19,
S. Slavney (GEO);
2005-09-25, S.
Murchie (JHU/APL);
2007-03-09, E.
Malaret (ACT Corp.);
2007-09-14, C.
Hash (ACT Corp);
2022-04-28 G.
Romeo, F. Seelos, K. Hancock,
R.
Poffenbarger (JHU/APL);"
^ENVI_HEADER =
"T1018_VRRAL_00N358_0654_1.HDR"
^IMAGE =
"T1018_VRRAL_00N358_0654_1.IMG"
/*VNIR Hyperspectral Reduced Data Record (VRDR)
Product Identification */
DATA_SET_ID =
"MRO-M-CRISM-5-RDR-VNIRHYPERSPECTRAL-V1.0"
PRODUCT_ID =
"T1018_VRRAL_00N358_0654_1"
/*(
TNNNN_VRRss_yydxxx_rrrr_v )*/
/*( NNNN = tile
number )*/
/*( ss = subtype of
image product )*/
/*( yy = latitude of
tile center )*/
/*( d = N or S for
north or south latitude )*/
/*( xxx = east
longitude of tile center (rounded) )*/
/*( rrrr = resolution
in pixels/degree )*/
/*( v = version
number )*/
INSTRUMENT_HOST_NAME = "MARS
RECONNAISSANCE ORBITER"
SPACECRAFT_ID = MRO
INSTRUMENT_NAME = "COMPACT RECONNAISSANCE
IMAGING
SPECTROMETER FOR
MARS"
INSTRUMENT_ID = CRISM
TARGET_NAME = MARS
PRODUCT_TYPE =
MAP_PROJECTED_VNIR_HYPERSPECTRAL_RDR
PRODUCT_CREATION_TIME = 2024-08-27T15:49:07
START_TIME = "N/A"
STOP_TIME = "N/A"
SPACECRAFT_CLOCK_START_COUNT = "N/A"
SPACECRAFT_CLOCK_STOP_COUNT = "N/A"
PRODUCT_VERSION_ID = "1"
PRODUCER_INSTITUTION_NAME = "JOHNS HOPKINS
UNIVERSITY
APPLIED PHYSICS
LABORATORY"
SOFTWARE_NAME =
"crism_mapping_execute_flow"
SOFTWARE_VERSION_ID = "1.04.76"
MRO:WAVELENGTH_FILE_NAME =
"T1018_VRRWV_00N358_0654_1.TAB"
/* This Map Projected VNIR Hyperspectral RDR label
describes one data file: */
/* 1. A multiple-band image file of calibrated RDR
data in radiance, */
/* reflectance, or quantities derived therein, or
related ancillary information. */
/* This RDR represents one latitude-longitude bin in
a global map. */
/* See the Map Projection Object below for bin
coordinates and resolution. */
/* See the CRISM Data Products SIS for more detailed
description. */
/* Description of MAP PROJECTED VNIR HYPERSPECTRAL
RDR REFLECTANCE IMAGE file */
/* MRO:FRAME_SET_CORR_FLAG =
"ON" */
/* MRO:PHOTOMETRIC_CORR_FLAG =
"ON" */
/* MRO:ATMOSPHERIC_CORR_FLAG =
"ON" */
/* MRO:RATIO_SHIFT_CORR_FLAG =
"ON" */
/* MRO:EMPIRICAL_GEOM_NORM_FLAG =
"OFF" */
/* MRO:EMPIRICAL_SMILE_CORR_FLAG =
"ON" */
/* MRO:SENSOR_SPACE_TRANSFORM_FLAG =
"OFF" */
/* ENVI header
description */
/* The ENVI header is a separate ASCII file that
includes basic */
/* image data file characteristics and allows the
image data to be */
/* loaded directly into the ENVI image processing
software available */
/* bands
list. */
OBJECT = ENVI_HEADER
HEADER_TYPE = "ENVI"
INTERCHANGE_FORMAT = "ASCII"
BYTES = 3256
DESCRIPTION = "This text file can
be used by ENVI image
processing software to read in the
image."
END_OBJECT = ENVI_HEADER
OBJECT = IMAGE
LINES = 3271
LINE_SAMPLES = 3271
SAMPLE_TYPE = PC_REAL
SAMPLE_BITS = 32
BANDS = 90
BAND_STORAGE_TYPE = BAND_SEQUENTIAL
BAND_NAME = ( "371.120",
"377.620", "384.120", "410.120",
"416.620",
"423.120",
"429.630", "436.130", "442.630",
"449.140",
"455.640",
"462.150", "468.650", "475.160",
"481.670",
"488.170",
"494.680", "501.190", "507.700",
"514.210",
"520.720",
"527.230", "533.740", "540.250",
"546.760",
"553.270",
"559.780", "566.290", "572.810",
"579.320",
"585.830",
"592.350", "598.860", "605.380",
"611.890",
"618.410",
"624.920", "631.440", "637.960",
"690.110",
"696.630",
"703.160", "709.680", "716.200",
"722.720",
"729.250",
"735.770", "742.300", "748.820",
"755.350",
"761.870",
"768.400", "774.920", "781.450",
"787.980",
"794.510",
"801.040", "807.560", "814.090",
"820.620",
"827.150",
"833.680", "840.220", "846.750",
"853.280",
"859.810",
"866.340", "872.880", "879.410",
"885.950",
"892.480",
"899.020", "905.550", "912.090",
"918.620",
"925.160",
"931.700", "938.240", "944.770",
"951.310",
"957.850",
"964.390", "970.930", "977.470",
"984.010",
"990.550",
"997.100", "1003.64", "1010.18",
"1016.72")
MISSING_CONSTANT = 65535
END_OBJECT = IMAGE
/* Map projection information about this RDR is in
the IMAGE_MAP_PROJECTION */
/* object
below. */
OBJECT =
IMAGE_MAP_PROJECTION
^DATA_SET_MAP_PROJECTION =
"VRR_MAP.CAT"
MAP_PROJECTION_TYPE =
"EQUIRECTANGULAR"
A_AXIS_RADIUS = 3396.190000000000
<KILOMETER>
B_AXIS_RADIUS = 3396.190000000000
<KILOMETER>
C_AXIS_RADIUS = 3396.190000000000
<KILOMETER>
POSITIVE_LONGITUDE_DIRECTION = EAST
CENTER_LATITUDE = 0.0000000
<DEGREE>
CENTER_LONGITUDE = -2.5000000
<DEGREE>
LINE_FIRST_PIXEL = 1
<PIXEL>
LINE_LAST_PIXEL = 3271
<PIXEL>
SAMPLE_FIRST_PIXEL = 1
<PIXEL>
SAMPLE_LAST_PIXEL = 3271
<PIXEL>
MAP_PROJECTION_ROTATION = 0.0000000
<DEGREE>
MAP_RESOLUTION = 654.0000294
MAP_SCALE = 0.0906341
MINIMUM_LATITUDE = -2.5000000
<DEGREE>
MAXIMUM_LATITUDE = 2.5000000
<DEGREE>
WESTERNMOST_LONGITUDE = -5.0000000
<DEGREE>
EASTERNMOST_LONGITUDE = 0.0000000
<DEGREE>
LINE_PROJECTION_OFFSET = 1634.6312282
<PIXEL>
SAMPLE_PROJECTION_OFFSET = 1634.6757534
<PIXEL>
COORDINATE_SYSTEM_TYPE = "BODY-FIXED
ROTATING"
COORDINATE_SYSTEM_NAME =
"PLANETOCENTRIC"
END_OBJECT =
IMAGE_MAP_PROJECTION
END
PDS_VERSION_ID = PDS3
RECORD_TYPE = UNDEFINED
LABEL_REVISION_NOTE = "2003-11-19,
S. Slavney (GEO);
2005-09-25, S.
Murchie (JHU/APL);
2007-03-09, E.
Malaret (ACT Corp.);
2007-09-14, C.
Hash (ACT Corp);
2022-04-28 G.
Romeo, F. Seelos, K. Hancock,
R.
Poffenbarger (JHU/APL);"
^ENVI_HEADER =
"T1018_VRRDE_00N358_0654_1.HDR"
^IMAGE =
"T1018_VRRDE_00N358_0654_1.IMG"
/*VNIR Hyperspectral Reduced Data Record (VRDR)
Product Identification */
DATA_SET_ID =
"MRO-M-CRISM-5-RDR-VNIRHYPERSPECTRAL-V1.0"
PRODUCT_ID =
"T1018_VRRDE_00N358_0654_1"
/*(
TNNNN_VRRss_yydxxx_rrrr_v )*/
/*( NNNN = tile
number )*/
/*( ss = subtype of
image product )*/
/*( yy = latitude of
tile center )*/
/*( d = N or S for
north or south latitude )*/
/*( xxx = east
longitude of tile center (rounded) )*/
/*( rrrr = resolution
in pixels/degree )*/
/*( v = version
number )*/
INSTRUMENT_HOST_NAME = "MARS
RECONNAISSANCE ORBITER"
SPACECRAFT_ID = MRO
INSTRUMENT_NAME = "COMPACT
RECONNAISSANCE IMAGING
SPECTROMETER FOR
MARS"
INSTRUMENT_ID = CRISM
TARGET_NAME = MARS
PRODUCT_TYPE =
MAP_PROJECTED_VNIR_HYPERSPECTRAL_RDR
PRODUCT_CREATION_TIME = 2024-08-27T15:49:07
START_TIME = "N/A"
STOP_TIME = "N/A"
SPACECRAFT_CLOCK_START_COUNT = "N/A"
SPACECRAFT_CLOCK_STOP_COUNT = "N/A"
PRODUCT_VERSION_ID = "1"
PRODUCER_INSTITUTION_NAME = "JOHNS HOPKINS
UNIVERSITY
APPLIED PHYSICS
LABORATORY"
SOFTWARE_NAME =
"crism_mapping_execute_flow"
SOFTWARE_VERSION_ID = "1.04.76"
MRO:WAVELENGTH_FILE_NAME =
"T1018_VRRWV_00N358_0654_1.TAB"
/* This Map Projected VNIR Hyperspectral RDR label
describes one data file: */
/* 1. A multiple-band image file of calibrated RDR
data in radiance, */
/* reflectance, or quantities derived therein, or
related ancillary information. */
/* This RDR represents one latitude-longitude bin in
a global map. */
/* See the Map Projection Object below for bin
coordinates and resolution. */
/* See the CRISM Data Products SIS for more detailed
description. */
/* Description of MAP PROJECTED VNIR HYPERSPECTRAL
RDR REFLECTANCE IMAGE file */
/* MRO:FRAME_SET_CORR_FLAG =
"ON" */
/* MRO:PHOTOMETRIC_CORR_FLAG =
"ON" */
/* MRO:ATMOSPHERIC_CORR_FLAG =
"ON" */
/* MRO:RATIO_SHIFT_CORR_FLAG =
"ON" */
/* MRO:EMPIRICAL_GEOM_NORM_FLAG =
"OFF" */
/* MRO:EMPIRICAL_SMILE_CORR_FLAG =
"ON" */
/* MRO:SENSOR_SPACE_TRANSFORM_FLAG =
"OFF" */
/* ENVI header
description */
/* The ENVI header is a separate ASCII file that
includes basic */
/* image data file characteristics and allows the
image data to be */
/* loaded directly into the ENVI image processing
software available */
/* bands
list. */
OBJECT = ENVI_HEADER
HEADER_TYPE = "ENVI"
INTERCHANGE_FORMAT = "ASCII"
BYTES = 1614
DESCRIPTION = "This text file can
be used by ENVI image
processing software to read in the
image."
END_OBJECT = ENVI_HEADER
OBJECT = IMAGE
LINES = 3271
LINE_SAMPLES = 3271
SAMPLE_TYPE = PC_REAL
SAMPLE_BITS = 32
BANDS = 17
BAND_STORAGE_TYPE = BAND_SEQUENTIAL
BAND_NAME = ( "Target ID",
"Segment ID
(Counter)",
"Sample",
"Line",
"INA at areoid -
deg",
"EMA at areoid -
deg",
"Phase angle –deg",
"Latitude -
areocentric - deg N",
"Longitude -
areocentric – deg E",
"INA at surface from
MOLA - deg",
"EMA at surface from
MOLA - deg",
"Slope magnitude from
MOLA - deg",
"MOLA slope azimuth –
deg clkwise from N",
"Elevation - meters
relative to MOLA",
"Thermal inertia - J m^-2
K^-1 s^-0.5",
"Bolometic
albedo",
"Local solar time -
hours")
MISSING_CONSTANT = 65535
END_OBJECT = IMAGE
/* Map projection information about this RDR is in
the IMAGE_MAP_PROJECTION */
/* object
below. */
OBJECT =
IMAGE_MAP_PROJECTION
^DATA_SET_MAP_PROJECTION =
"VRR_MAP.CAT"
MAP_PROJECTION_TYPE =
"EQUIRECTANGULAR"
A_AXIS_RADIUS = 3396.190000000000
<KILOMETER>
B_AXIS_RADIUS = 3396.190000000000
<KILOMETER>
C_AXIS_RADIUS = 3396.190000000000
<KILOMETER>
POSITIVE_LONGITUDE_DIRECTION = EAST
CENTER_LATITUDE = 0.0000000
<DEGREE>
CENTER_LONGITUDE = -2.5000000
<DEGREE>
LINE_FIRST_PIXEL = 1
<PIXEL>
LINE_LAST_PIXEL = 3271
<PIXEL>
SAMPLE_FIRST_PIXEL = 1
<PIXEL>
SAMPLE_LAST_PIXEL = 3271
<PIXEL>
MAP_PROJECTION_ROTATION = 0.0000000
<DEGREE>
MAP_RESOLUTION = 654.0000294
MAP_SCALE = 0.0906341
MINIMUM_LATITUDE = -2.5000000
<DEGREE>
MAXIMUM_LATITUDE = 2.5000000
<DEGREE>
WESTERNMOST_LONGITUDE = -5.0000000
<DEGREE>
EASTERNMOST_LONGITUDE = 0.0000000
<DEGREE>
LINE_PROJECTION_OFFSET = 1634.6312282
<PIXEL>
SAMPLE_PROJECTION_OFFSET = 1634.6757534
<PIXEL>
COORDINATE_SYSTEM_TYPE = "BODY-FIXED
ROTATING"
COORDINATE_SYSTEM_NAME =
"PLANETOCENTRIC"
END_OBJECT =
IMAGE_MAP_PROJECTION
END
PDS_VERSION_ID = PDS3
RECORD_TYPE = UNDEFINED
LABEL_REVISION_NOTE = "2003-11-19,
S. Slavney (GEO);
2005-09-25, S.
Murchie (JHU/APL);
2007-03-09, E.
Malaret (ACT Corp.);
2007-09-14, C.
Hash (ACT Corp);
2022-04-28 G.
Romeo, F. Seelos, K. Hancock,
R.
Poffenbarger (JHU/APL);"
^ENVI_HEADER =
"T1018_VRRSU_00N358_0654_1.HDR"
^IMAGE =
"T1018_VRRSU_00N358_0654_1.IMG"
/*VNIR Hyperspectral Reduced Data Record (VRDR)
Product Identification */
DATA_SET_ID =
"MRO-M-CRISM-5-RDR-VNIRHYPERSPECTRAL-V1.0"
PRODUCT_ID =
"T1018_VRRSU_00N358_0654_1"
/*(
TNNNN_VRRss_yydxxx_rrrr_v )*/
/*( NNNN = tile
number )*/
/*( ss = subtype of
image product )*/
/*( yy = latitude of
tile center )*/
/*( d = N or S for
north or south latitude )*/
/*( xxx = east
longitude of tile center (rounded) )*/
/*( rrrr = resolution
in pixels/degree )*/
/*( v = version
number )*/
INSTRUMENT_HOST_NAME = "MARS
RECONNAISSANCE ORBITER"
SPACECRAFT_ID = MRO
INSTRUMENT_NAME = "COMPACT
RECONNAISSANCE IMAGING
SPECTROMETER FOR
MARS"
INSTRUMENT_ID = CRISM
TARGET_NAME = MARS
PRODUCT_TYPE =
MAP_PROJECTED_VNIR_HYPERSPECTRAL_RDR
PRODUCT_CREATION_TIME = 2024-08-27T15:49:07
START_TIME = "N/A"
STOP_TIME = "N/A"
SPACECRAFT_CLOCK_START_COUNT = "N/A"
SPACECRAFT_CLOCK_STOP_COUNT = "N/A"
PRODUCT_VERSION_ID = "1"
PRODUCER_INSTITUTION_NAME = "JOHNS HOPKINS
UNIVERSITY
APPLIED PHYSICS
LABORATORY"
SOFTWARE_NAME =
"crism_mapping_execute_flow"
SOFTWARE_VERSION_ID = "1.04.76"
MRO:WAVELENGTH_FILE_NAME =
"T1018_VRRWV_00N358_0654_1.TAB"
/* This Map Projected VNIR Hyperspectral RDR label
describes one data file: */
/* 1. A multiple-band image file of calibrated RDR
data in radiance, */
/* reflectance, or quantities derived therein, or
related ancillary information. */
/* This RDR represents one latitude-longitude bin in
a global map. */
/* See the Map Projection Object below for bin
coordinates and resolution. */
/* See the CRISM Data Products SIS for more detailed
description. */
/* Description of MAP PROJECTED VNIR HYPERSPECTRAL
RDR REFLECTANCE IMAGE file */
/* MRO:FRAME_SET_CORR_FLAG =
"ON" */
/* MRO:PHOTOMETRIC_CORR_FLAG =
"ON" */
/* MRO:ATMOSPHERIC_CORR_FLAG =
"ON" */
/* MRO:RATIO_SHIFT_CORR_FLAG =
"ON" */
/* MRO:EMPIRICAL_GEOM_NORM_FLAG =
"OFF" */
/* MRO:EMPIRICAL_SMILE_CORR_FLAG =
"ON" */
/* MRO:SENSOR_SPACE_TRANSFORM_FLAG =
"OFF" */
/* ENVI header
description */
/* The ENVI header is a separate ASCII file that
includes basic */
/* image data file characteristics and allows the
image data to be */
/* loaded directly into the ENVI image processing
software available */
/* bands
list. */
OBJECT = ENVI_HEADER
HEADER_TYPE = "ENVI"
INTERCHANGE_FORMAT = "ASCII"
BYTES = 1276
DESCRIPTION = "This text file can
be used by ENVI image
processing software to read in the
image."
END_OBJECT = ENVI_HEADER
OBJECT = IMAGE
LINES = 3271
LINE_SAMPLES = 3271
SAMPLE_TYPE = PC_REAL
SAMPLE_BITS = 32
BANDS = 14
BAND_STORAGE_TYPE = BAND_SEQUENTIAL
BAND_NAME = ( "R770",
"RBR",
"BD530_2",
"SH600_2",
"SH770",
"BD640_2",
"BD860_2",
"BD920_2",
"RPEAK1",
"BDI1000VIS",
"R440",
"IRR1",
"R530",
"R600")
MISSING_CONSTANT = 65535
END_OBJECT = IMAGE
/* Map projection information about this RDR is in
the IMAGE_MAP_PROJECTION */
/* object
below. */
OBJECT =
IMAGE_MAP_PROJECTION
^DATA_SET_MAP_PROJECTION =
"VRR_MAP.CAT"
MAP_PROJECTION_TYPE =
"EQUIRECTANGULAR"
A_AXIS_RADIUS = 3396.190000000000
<KILOMETER>
B_AXIS_RADIUS = 3396.190000000000
<KILOMETER>
C_AXIS_RADIUS = 3396.190000000000
<KILOMETER>
POSITIVE_LONGITUDE_DIRECTION = EAST
CENTER_LATITUDE = 0.0000000
<DEGREE>
CENTER_LONGITUDE = -2.5000000
<DEGREE>
LINE_FIRST_PIXEL = 1
<PIXEL>
LINE_LAST_PIXEL = 3271
<PIXEL>
SAMPLE_FIRST_PIXEL = 1
<PIXEL>
SAMPLE_LAST_PIXEL = 3271
<PIXEL>
MAP_PROJECTION_ROTATION = 0.0000000
<DEGREE>
MAP_RESOLUTION = 654.0000294
MAP_SCALE = 0.0906341
MINIMUM_LATITUDE = -2.5000000
<DEGREE>
MAXIMUM_LATITUDE = 2.5000000
<DEGREE>
WESTERNMOST_LONGITUDE = -5.0000000
<DEGREE>
EASTERNMOST_LONGITUDE = 0.0000000
<DEGREE>
LINE_PROJECTION_OFFSET = 1634.6312282
<PIXEL>
SAMPLE_PROJECTION_OFFSET = 1634.6757534
<PIXEL>
COORDINATE_SYSTEM_TYPE = "BODY-FIXED
ROTATING"
COORDINATE_SYSTEM_NAME =
"PLANETOCENTRIC"
END_OBJECT =
IMAGE_MAP_PROJECTION
END
PDS_VERSION_ID
= PDS3
RECORD_TYPE
= FIXED_LENGTH
RECORD_BYTES
= 20
FILE_RECORDS
= 90
LABEL_REVISION_NOTE
= "2003-11-19, S. Slavney (GEO);
2005-09-25, S. Murchie (JHU/APL);
2007-03-09, E. Malaret (ACT Corp.);
2007-09-14, C. Hash (ACT Corp);
2022-04-28 G. Romeo, F. Seelos, K. Hancock,
R. Poffenbarger (JHU/APL);"
^TABLE
= "T1018_VRRWV_00N358_0654_1.TAB"
DATA_SET_ID
= "MRO-M-CRISM-5-RDR-VNIRHYPERSPECTRAL-V1.0"
PRODUCT_ID
= "T1018_VRRWV_00N358_0654_1"
/*( TNNNN_VRRss_yydxxx_rrrr_v )*/
/*( NNNN = tile number )*/
/*( ss = subtype of image product )*/
/*( yy = latitude of tile center )*/
/*( d = N or S for north or south latitude )*/
/*( xxx = east longitude of tile center (rounded) )*/
/*( rrrr = resolution in pixels/degree )*/
/*( v = version number )*/
INSTRUMENT_HOST_NAME
= "MARS RECONNAISSANCE ORBITER"
SPACECRAFT_ID
= MRO
INSTRUMENT_NAME
= "COMPACT RECONNAISSANCE IMAGING
SPECTROMETER FOR MARS"
INSTRUMENT_ID
= CRISM
TARGET_NAME
= MARS
PRODUCT_TYPE
= MAP_PROJECTED_VNIR_HYPERSPECTRAL_RDR
PRODUCT_CREATION_TIME
= 2024-08-27T15:49:07
START_TIME
= "N/A"
STOP_TIME
= "N/A"
SPACECRAFT_CLOCK_START_COUNT
= "N/A"
SPACECRAFT_CLOCK_STOP_COUNT
= "N/A"
PRODUCT_VERSION_ID
= "1"
PRODUCER_INSTITUTION_NAME
= "JOHNS HOPKINS UNIVERSITY
APPLIED PHYSICS LABORATORY"
SOFTWARE_NAME
= "crism_mapping_execute_flow"
SOFTWARE_VERSION_ID
= "1.04.76"
/*
A listfile including detector row numbers and wavelengths in the */
/*
I/F and Lambert albedo images. */
OBJECT
= TABLE
NAME = "CRISM VRDR WAVELENGTH TABLE"
INTERCHANGE_FORMAT = "ASCII"
ROWS = 90
COLUMNS = 3
ROW_BYTES = 20
DESCRIPTION = "CRISM VRDR wavelength table "
OBJECT = COLUMN
COLUMN_NUMBER = 1
NAME = SPECT_ID
DATA_TYPE = ASCII_INTEGER
START_BYTE = 1
BYTES = 1
DESCRIPTION = "Spectrometer identifier; 0 = IR; 1 = VNIR"
END_OBJECT = COLUMN
OBJECT = COLUMN
COLUMN_NUMBER = 2
NAME = ROWNUM
DATA_TYPE = ASCII_INTEGER
START_BYTE = 3
BYTES = 4
DESCRIPTION = "Detector row number (0-479)"
END_OBJECT = COLUMN
OBJECT = COLUMN
COLUMN_NUMBER = 3
NAME = SAMPL_WAV
DATA_TYPE = ASCII_REAL
START_BYTE = 8
BYTES = 11
DESCRIPTION = "Standard sampling center wavelength in nm"
UNIT = "NM"
END_OBJECT = COLUMN
END_OBJECT
= TABLE
END